

Weekly Summary – June 12 – 16
Key Observations:
- In our June 2 commentary, we highlighted the dramatic broadening out of sectors and stocks that participated in that day’s substantial gains. We then stated that we were inclined to give the benefit of the doubt to the sustainability of a more broad-based U.S. equity rally. In last week’s commentary we maintained that inclination but indicated that we were not completely convinced of that stance and could be very quick to change our opinion on this matter. So far, we have not changed our initial inclination. We will continue to monitor developments in financial markets and economic data very closely. In our May 26 weekly, we reiterated that the NVDIA Corporation (NVDA) was a “game changer” for financial markets, and in particular in regard to Artificial Intelligence (AI).
- As expected, the Federal Reserve (Fed) decided to pause its rate hiking strategy in its effort to bring inflation down to its 2% target. Although the decision was unanimous, there was a wide disagreement on the timing and extent of further rate hikes. Much to the surprise of many investors and analysts, a significant number of “participants” thought that two more hikes in the federal funds rate would be “appropriate.” Fed chair Powell indicated that the Fed’s next meeting in July would be “live,” meaning that the Fed could raise rates at that meeting. We believe that the Fed will raise the federal funds rate by 25 basis points (bps) at that meeting. We are still not convinced that a second 25 bps hike will be needed. But we do not think that the Fed will cut rates this year.
- In our opinion, most of the economic data we analyzed this week was supportive of the Fed’s decision to “pause.” We remain optimistic that U.S. inflation will continue to trend lower. We will monitor closely the U.S. consumer to discern the sustainability of resilient spending patterns. We remain concerned about regional banks in general as many commercial real estate loans mature later this year and next. We maintain our belief that more regional banks could be at “risk.” We viewed Powell’s comments in his press conference this week as sharing in our concern. Our concern in regard to regional banks was also exacerbated by the extreme inversion of the two-to 10-year Treasury yield curve which inverted on Friday to more than 95 bps.
- We have been negative on USD relative to other currencies as expressed by DXY since late September/early October of last year. DXY is a measure of USD relative to a selected basket of six foreign currencies. Since the end of January /early February, we thought that USD temporarily stopped depreciating and could even trade higher in the short term. After this week’s trading, and especially after the USD losses on Thursday, we thought that USD could be ready to begin to weaken once more on a more sustained trajectory. This could suggest that it could be an opportune time to once again increase exposure to international markets. To the extent China ramps up stimulus for its weakening economy, many foreign economies and commodities might be “propelled” higher.
The Upshot: Our general investment approach remains the same as depicted in last week’s summary. We maintain our preference for quality stocks with good balance sheets, relatively stable cash flows with stable margins. Volatility across sectors continues to be supportive of a diversified portfolio for long term investors. We continue to stress that stock selectivity is of paramount importance.
In our May 26 weekly, we also discussed possible strategies for investors who believe they “missed out” on owning or adding to certain positions that have experienced dramatic moves.
We will continue to monitor financial markets very closely so that we can better determine the sustainability of the recent more broad-based rally. We could be quick to change our opinion depending on new developments. We expect many surprises are possible at any time. This is not the time for complacency. We find ourselves always returning to our view that the hallmark of the period since the onset of the pandemic is one of “rapidity of change.”
More Hawkish FOMC Dot Plot than Expected
The much-anticipated meeting of the Federal Reserve’s (Fed) policy committee, Federal Open Market Committee (FOMC or Committee), took place on June 13 and June 14, with the Committee’s decision announced on June 14. As we expected, along with most investors and analysts, the Fed “paused” its rate hike strategy and maintained the federal funds rate in the 5.0%-to-5.25% range. Fed chair Powell stated that the Fed’s next meeting in July would be “live,” indicating that the federal funds rate could be raised at that time. This was all as “expected.” But the projected federal funds rate by the Committee’s eighteen participants was not as expected. Each participant’s assessment of the targeted federal funds rate is represented in a “dot plot,” with each participant having their own dot. The last dot plot was compiled in March. The median dot for 2023 in the June dot plot was in the 5.50% to 5.75% range, indicating another 50 basis points (bps) of hikes in 2023, versus an expected 25 bps of additional hikes. The dot plot is part of the Committee’s Summary of Economic Projections (SEP). The dots for nine participants indicated the two 25 bps hikes median level of the federal funds rate for 2023, and three other participants had dots above this level. So, two-thirds of the FOMC participants were projecting at least two additional 25-bps hikes in 2023. Four dots indicated only one more 25 bps hike in 2023, and only two dots indicated that the Fed should maintain the current federal funds rate. There were no indications of a cut in the federal funds rate for the year. This was characterized generally as a hawkish pause by the Fed. Although the decision to pause rate hikes in June was unanimous, there was clearly disagreement on future policy direction. It should not be a surprise to anyone that economic data can be viewed in many different ways. Many views can follow regarding the best approach to achieving the Fed’s 2% inflation target without compromising to the greatest extent possible the U.S. economy and the labor market. The song “Both Sides Now,” written by Joni Mitchell and as sung by Judy Collins, depicts in a more creative way how our viewpoints can differ. “I’ve looked at clouds from both sides now; From up and down and still somehow; It’s clouds illusions, I recall; I really don’t know clouds at all … I’ve looked at life from both sides now; From win and lose and still somehow; It’s life’s illusions, I recall; I really don’t know life at all.” We each have our own unique way of viewing and analyzing data. It is very likely that we recall our own views and not the views or opinions of others. Therefore, we might really never have “known” the “facts” at all. Please feel free to listen to Joni Mitchell’s version of her own song as well.
FOMC Statement and Powell’s Prepared Remarks – Soft Landing?
There were not many changes from the FOMC’s last meeting statement on May 2-3 when the Committee raised the fed funds rate 25 bps to the current 5.0%-to-5.25% range. The principal difference was that “holding the target range steady at this meeting allows the Committee to assess additional information and its implications for monetary policy.” Powell acknowledged that the “full effects of our tightening have yet to be felt” and that the “lags” were “uncertain.” He also observed that “nearly all Committee participants view it as likely that some further rate increases will be appropriate this year…” Powell thought “recent indicators” showed a U.S. economy that continued to expand at a “moderate“ pace as higher interest rates and slower output growth continued to affect housing and business fixed investment. Powell then proceeded to highlight many of the median projects of participants in the SEP. These included an increase in real GDP 2023 projections from 0.4% in March to 1.0%, and the unemployment rate rising to “only” 4.1%, versus the March projection of 4.5%. Powell also noted that core PCE inflation was now projected to end 2023 at a 3.9% level versus the prior projection of just 3.6%. Although the labor market remained “very tight,” Powell saw “some signs that supply and demand in the labor market are coming into better balance.” Powell then stressed that decisions will be made ‘’meeting by meeting, based on the totality of incoming data and their implications for the outlook for economic activity and inflation as well ss the balance of risks.”
The minutes of the previous two meetings indicated that the Fed’s staff projected a mild recession. In our prior commentaries, we stressed that this did not reflect necessarily the views of the FOMC participants. We viewed the changes in SEP projections and Powell’s characterization of SEP projections as more compatible with a “soft landing“ scenario. However, we would like to stress that merely because the new SEP projections appear to be more compatible with a soft landing, does not equate to the reality of that scenario. In our opinion, many of the Fed’s forecasts have been simply “wrong.” Powell even admitted this to some extent during the press conference.
Powell’s Press Conference Highlights
Although Powell observed that inflation had moderated somewhat since the middle of last year and that inflation expectations appear to be well anchored, inflationary pressures continue to “run high” and he was not seeing a lot of progress on “core” inflation. Powell then indicated the importance of needing a less-tight labor market characterized by slower wage growth as he stated that reducing core inflation would likely require a “softening” of the labor market. Moreover, Powell observed that there were some signs that the supply and demand for labor were in better balance as nominal wages showed signs of easing. Powell also thought that much of the economic data since the last SEP in March was largely consistent with those projections but were on the “high side.” Powell perceived that conditions which would lower inflation were ”coming” into place, but that it would take some time to lower core inflation. These conditions included further improvements in supply chains. Powell continued to see a path to 2% inflation without substantial job losses. Given these views, Powell thought that more time was needed before rate cuts should be considered. He stated that “it will be appropriate to cut rates at a time when inflation is coming down really significantly, we’re talking about a couple years out.” In answering a question near the end of the press conference, Powell conceded the riskiness of many commercial real estate (CRE) loans. A large portion of such loans were held largely in smaller banks but were “well distributed.” However, some banks could be at greater risk than others. A Fortune article on June 12 noted that more than $1.4 trillion of CRE loans were due to mature by 2027, including $270 billion that were due to mature this year. We assume a strong likelihood of defaults or restructurings of at least some of these loans as they mature. We maintain our assessment that at least some additional regional banks remain at risk. Could this be part of the reason for the June pause in hiking rates? In one of our prior commentaries, we referenced Treasury secretary Yellen’s prediction of more bank mergers and of Powell’s concern for regional banks only one day removed from Yellen’s comments. Another reason for a pause offered by Powell was that as the federal funds rate approached its peak, the “speed” of rate hikes became less important compared to the level of such rates.
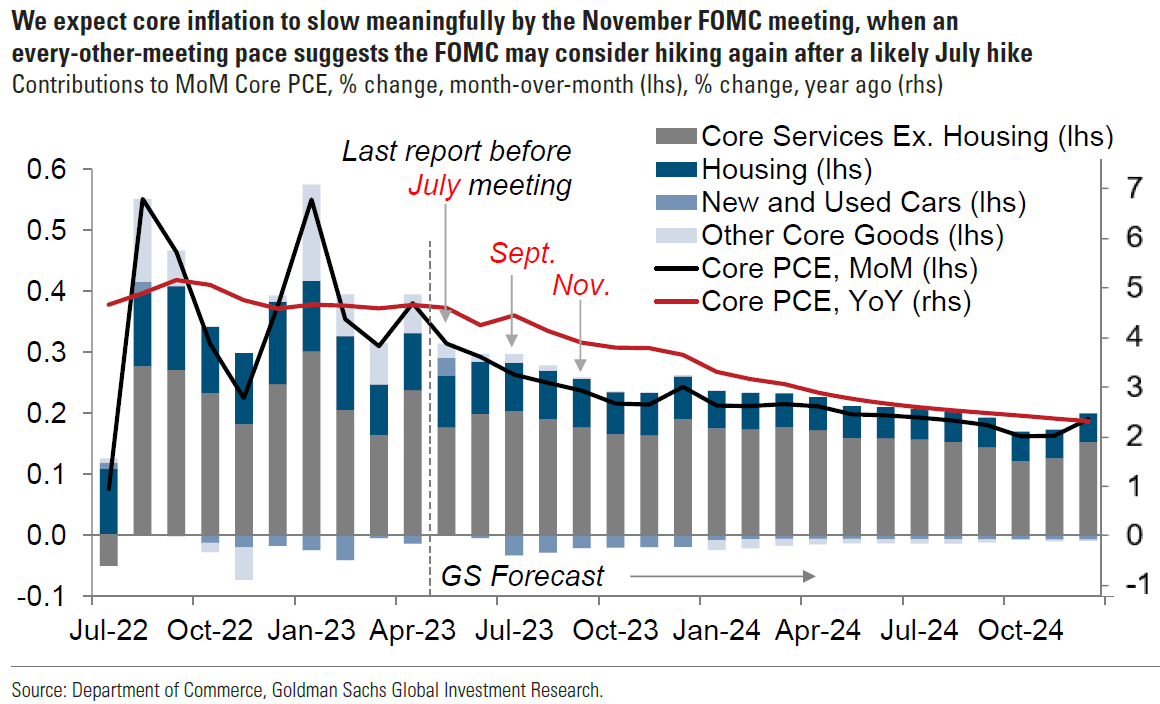
Source: Goldman Sachs, What’s Top of Mind in Macro Research: Central banks in focus, markets and inflation relief, reduced commodity upside (6-15-2023)
May U.S. CPI was Compatible with a Fed Pause
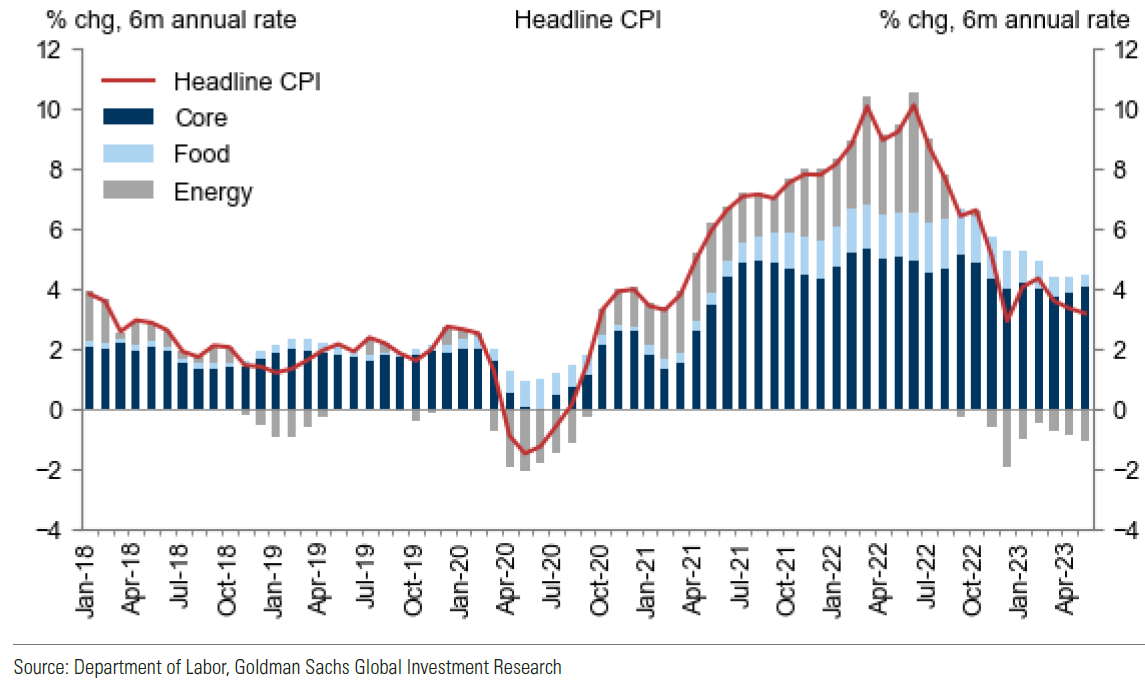
After a gain of 0.4% in April, the headline Consumer Price Index (CPI) rose 0.1% month-over-month (m/m) in May, and it was 4.0% higher year-over-year (y/y) compared to 4.9% y/y in April. The 4% increase was the lowest y/y increase since April 2021. Core CPI, which excludes food and energy, was 0.44% higher m/m versus 0.41% in April, and was 5.3% higher y/y in May compared to a 5.3% increase in April. These figures were roughly in line with expectations. We found some encouraging trends in the underlying components of core CPI. The second consecutive 4.4% m/m increase in used cars and truck prices accounted for almost all the 0.6% increase in core goods prices. We are confident that falling auction prices for used vehicles should be reflected in a lower trajectory of used vehicle prices over the coming months. We also were encouraged by the sustaining of the slowing trend of rent and owners’ equivalent rent (OER). Rent was 0.49% higher m/m in May and OER was 0.52% higher. This was a substantial improvement from the 0.7% to 0.8% rates that prevailed in winter months. We surmise that this downward trajectory of shelter costs will prevail as many more up-to-date measures that we have highlighted in past commentaries provide encouragement. The shelter index was 0.6% higher m/m in May and 8.0% higher y/y. Shelter costs accounted for more than 60% of the monthly May increase in core CPI. Powell’s “super” core services, excluding housing and energy, was 0.24% higher m/m, which was close to the 0.23% monthly average increase for this measure that prevailed over the two decades prior to the pandemic.
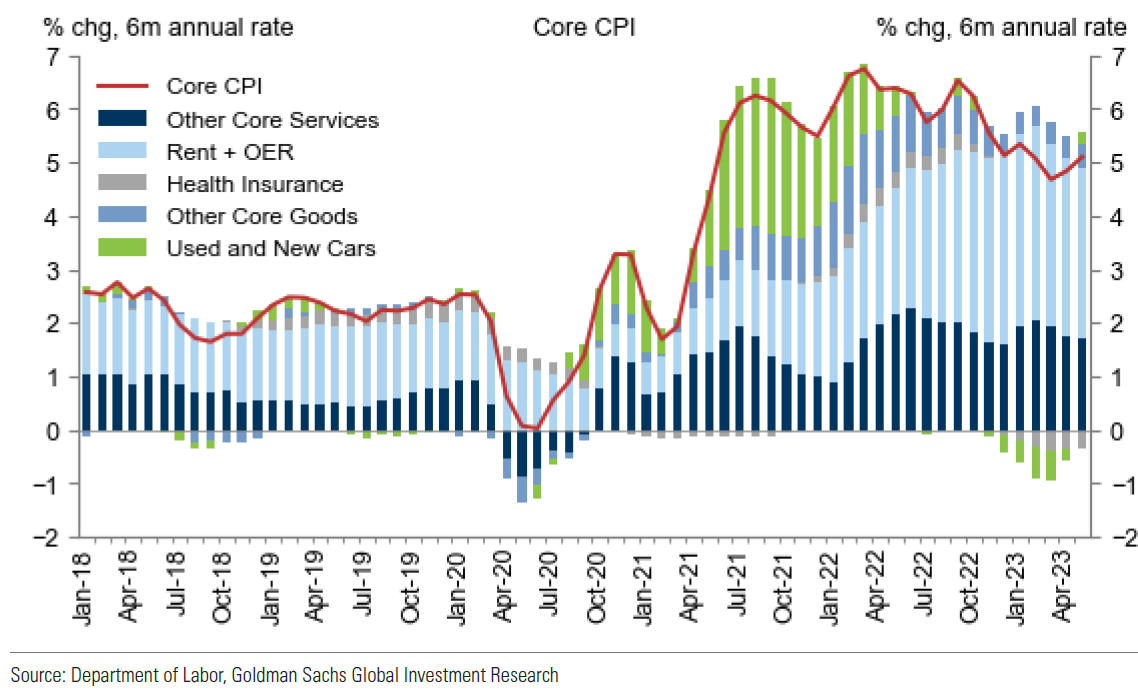
Source: Goldman Sachs, USA: Core CPI Rises 0.44% on Used Cars and Car Insurance (6-13-2023)
May U.S. PPI was Lower than Expected
The headline Producer Price Index (PPI) decreased 0.3% m/m following a 0.2% gain in April and was a larger decline than the expected 0.1% drop. A 13.8% drop in gasoline prices and a 1.3% decrease in food prices mainly were responsible for a 1.6% m/m drop in goods prices that was the largest decrease since July 2022. Services costs rose 0.2%. These costs were led by 4.2% margins for automobiles and auto parts. Prices for final demand less food, energy and trade services were unchanged versus the previous month. This core measure of PPI was 2.8% higher y/y, which was the lowest y/y increase since February 2021. Furthermore, headline PPI’s 1.1% increase y/y was the lowest annual increase since December 2020.
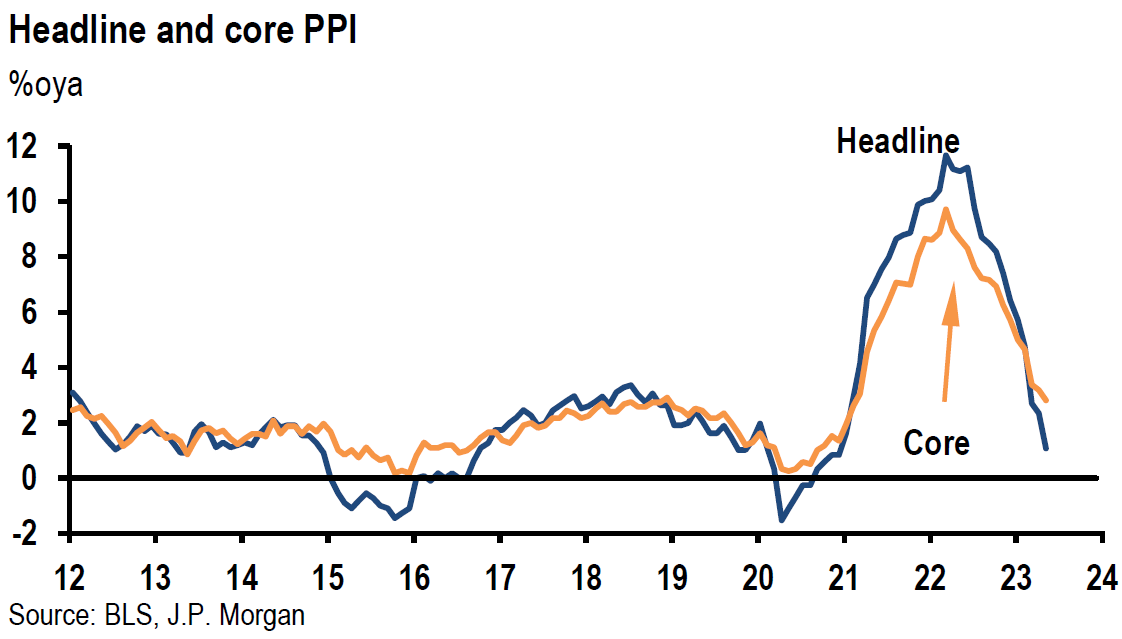
Source: JP Morgan, Softer PPI in May (6-14-2023)
May U.S. Retail Sales Increased More than Expected
Retail sales rose 0.3% m/m versus an expected decline of 0.1% and compared to a 0.4% gain in April. The May increase reflected a m/m 1.4% increase in auto sales, a 2.6% decline in gasoline station sales and a 0.2% gain in core retail sales. Over the past twelve months, retail sales were 1.6% higher. Core retail sales, otherwise referred to as the control group increased 0.2% m/m as expected, following a 0.6% gain in April. The core retail sales figure excludes food, autos, gasoline and building materials. Retail sales for both March and April were revised lower.
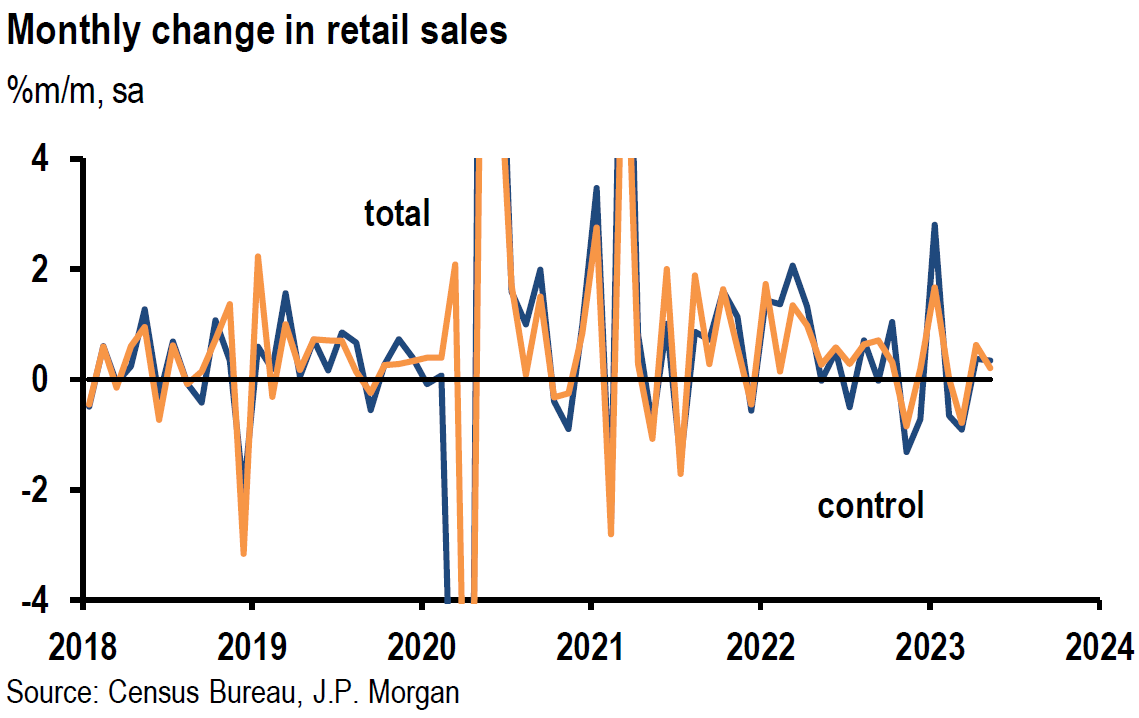
Source: JP Morgan, Thursday data wrap-up (6-15-2023)
Initial Jobless Claims Remain Elevated
Initial jobless claims remained flat at 262,000 for the week ended June 10 and were well above the expected level of 249,000. The prior week’s claims were revised higher by 1,000. Continuing claims for the week ended June 3 increased by 20,000 to 1.775 million from the previous week that was revised lower by 2,000. Continuing claims were slightly above expectations. We view the recent filings for unemployment insurance benefits as indicating a softening U.S. labor market. Year to date, initial claims are about 28% higher.
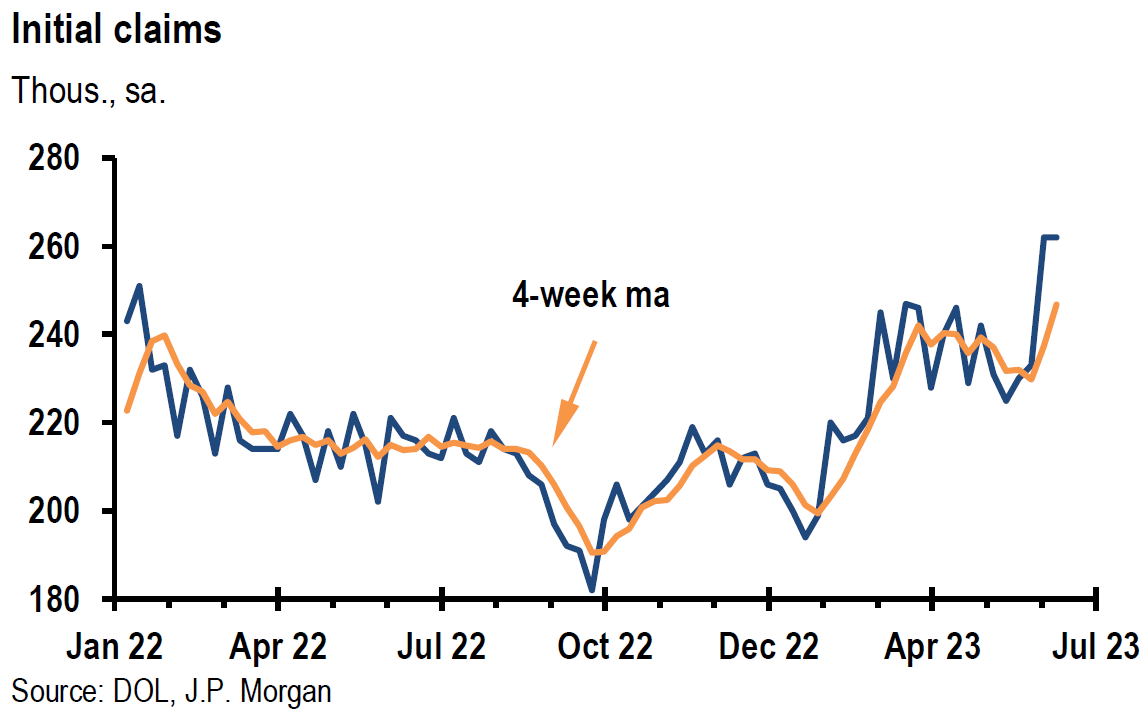
Source: JP Morgan, Thursday data wrap-up (6-15-2023)
U.S. May Import and Export Prices Decline
Import prices declined 0.6% m/m in May following this year’s first monthly increase of 0.3% in April. The 6.4% m/m decline in fuel prices was the primary driver of May’s decline. Import prices, excluding petroleum decreased 0.2% m/m, matching April’s revised decline. U.S. import prices were 5.9% lower y/y, which was the largest annual decline since the May 2019 to May 2020 period. U.S. export prices declined 1.9% in May — the largest monthly declined since last December. Export prices were 10.1% lower y/y, which was the largest annual decline since this series began in September 1984.
Latest University of Michigan Consumer Sentiment Improves as Inflation Expectations Diminish
Preliminary results for June’s consumer sentiment increased to 63.9 from 59.2 in May and exceeded an expected 60 level. June’s reading was the highest in four months. June’s increase reflected “greater optimism as inflation eased and policymakers resolved the debt ceiling crisis. The outlook over the economy surged 28% over the short run and 14% over the long run.” Perceptions of current economic conditions improved to 68 from 64.9 and consumer expectations increased to 61.3 from 55.4. Year ahead inflation expectations receded for the second consecutive month as they fell from 4.2% in May to 3.3% — the lowest since March 2021. Long run inflation expectations remained at 3%, confirming Powell’s view that inflation expectations are “well anchored.” We found this survey very encouraging in regard to consumers’ perception of the economy and inflation.
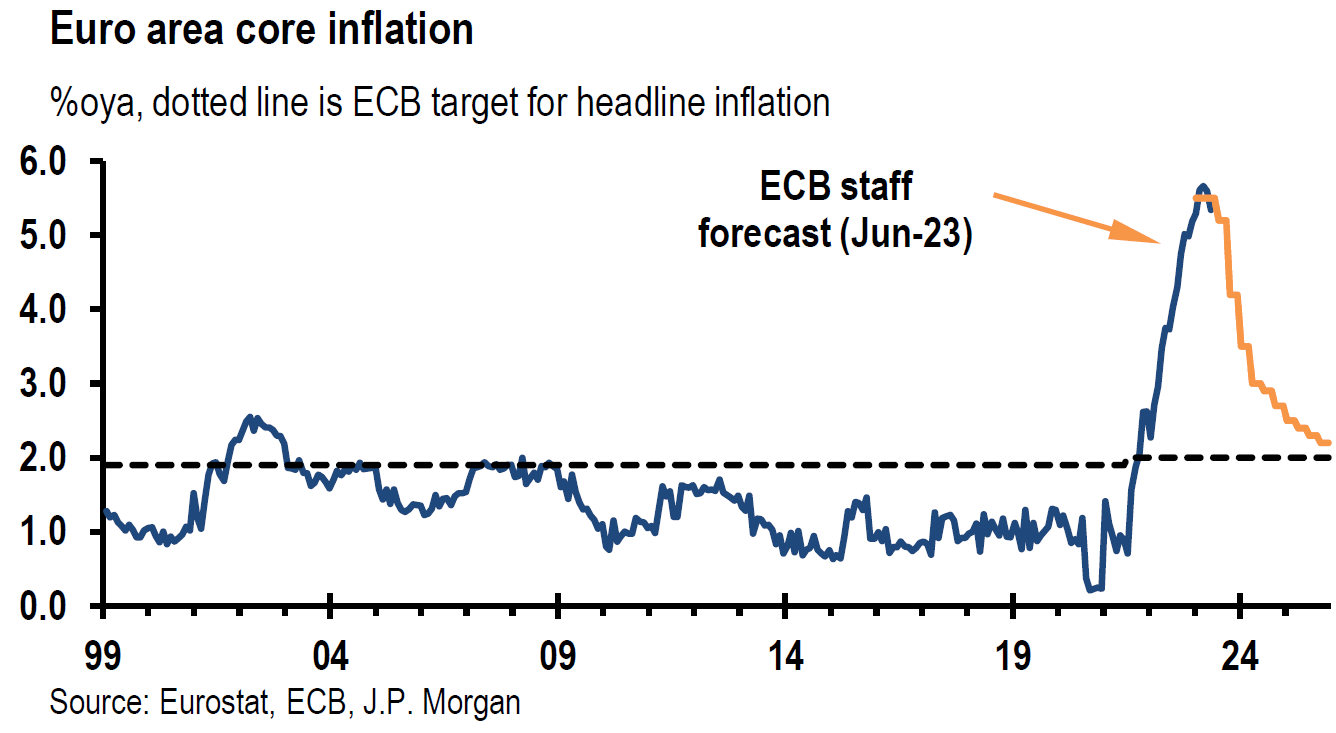
ECB Hikes Its Key Policy Rate by 25 BPS
As expected, the European Central Bank (ECB) on Thursday raised its “deposit rate” by 25 bps to 3.5% (highest since 2001). ECB president Christine Lagarde described a further hike in July as “very likely.” The ECB stated that it expected inflation to remain above its 2% inflation target through 2025 as it raised its inflation forecasts for 2023, 2024 and 2025. ECB officials also confirmed that they would halt reinvestments under their 3.2 trillion euro ($3.5 trillion) Asset Purchase Program beginning next month – an additional tightening of monetary policies. After this ECB decision, both Goldman Sachs and J.P. Morgan raised their estimates for the ECB terminal deposit rate from 3.75% to 4.0%.
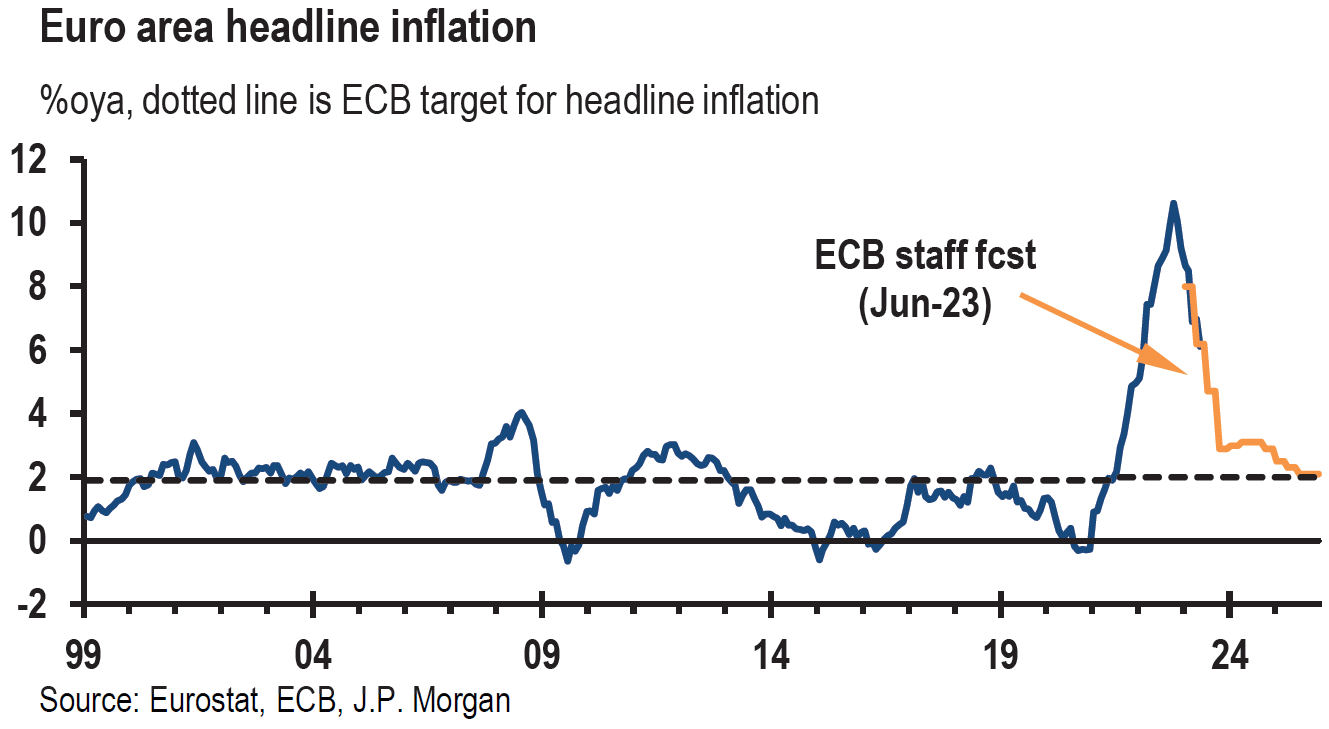
Source: JP Morgan, ECB: A hawkish 25bp, we now see terminal at 4% (6-15-2023)
BOJ Maintains Its “Ultra”- Easy Monetary Policy
As expected, the Bank of Japan (BOJ) on Friday chose to maintain its easy monetary policy, including its yield curve control policy (YCC), which targets a low band around Japan’s sovereign 10-year bond yields. Unlike most major central banks, the BOJ is trying to maintain a sustainable inflation rate of at least 2%. BOJ’s Governor Ueda expressed his opinion that “the cost of waiting for underlying inflation to rise until it can be judged that 2% inflation has fully taken hold is not as large as the cost of making hasty policy changes.” Ueda admitted that a change in BOJ’s YCC policy will come as a surprise move. We assume that every BOJ meeting is “live.”
China’s Economy Continued to Slow in May
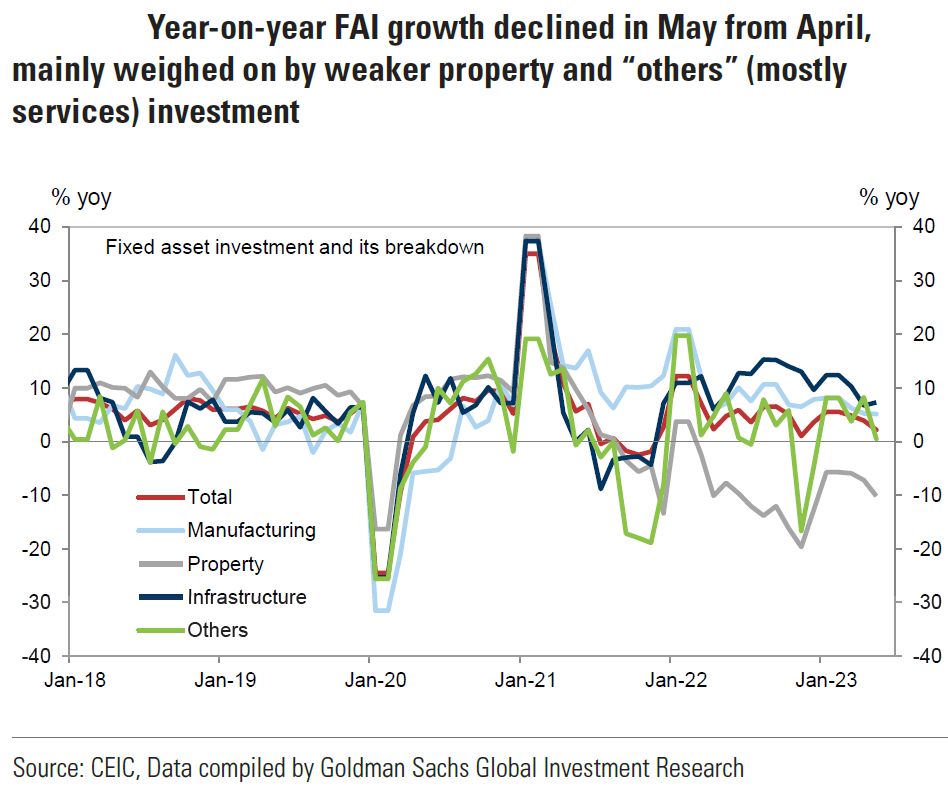
According to China’s National Bureau of Statistics (NBS) on Thursday, China’s industrial output increased by 3.5% y/y in May, slowing from a 5.6% y/y growth rate in April. Retail sales came in at 12.7% , slowing from April’s 18.4% growth rate and lower than the expected 13.6% growth rate. Investment in China’s property sector fell 7.2% in the January-May period when compared to the same period one year ago and declined further from a 6.2% drop in January-April. Broad fixed asset investment grew 4.0% y/y in the first five months of this year versus an expected 4.4% increase and down from a 4.7% increase in this year’s first four months. This week, the People’s Bank of China (PBOC) cut two rates by 10 bps, including rates on certain one-year loans. Many analysts now expect further easing measures by China, which might even include targeted fiscal stimulus. Without divulging any specific further policy easing measures, premier Li Qiang hinted that certain “growth-promoting” policies could be released soon. The premier chaired the State Council meeting on Friday. The meeting statement announced that “external environment changes hindered growth recovery. Policymakers should thus roll out more forceful measures in response to changes in economic situation.” The premier urged that detailed measures be announced soon. It is our belief that China is now more committed to further easing measures to help its economy. We surmise that this helped lead to significant gains in the price of crude oil on Thursday.
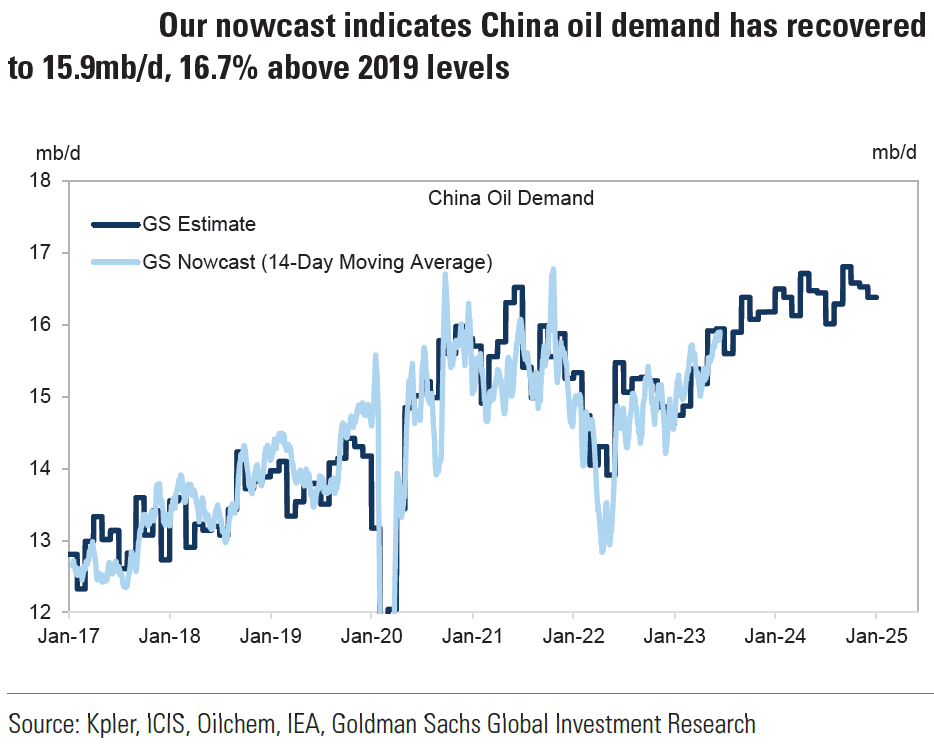
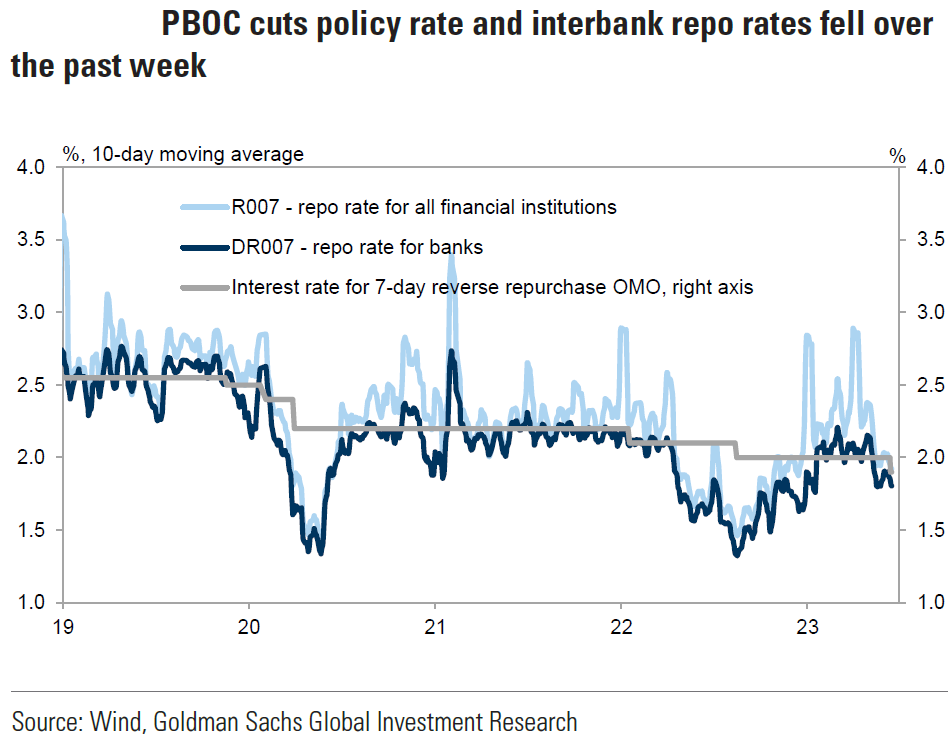
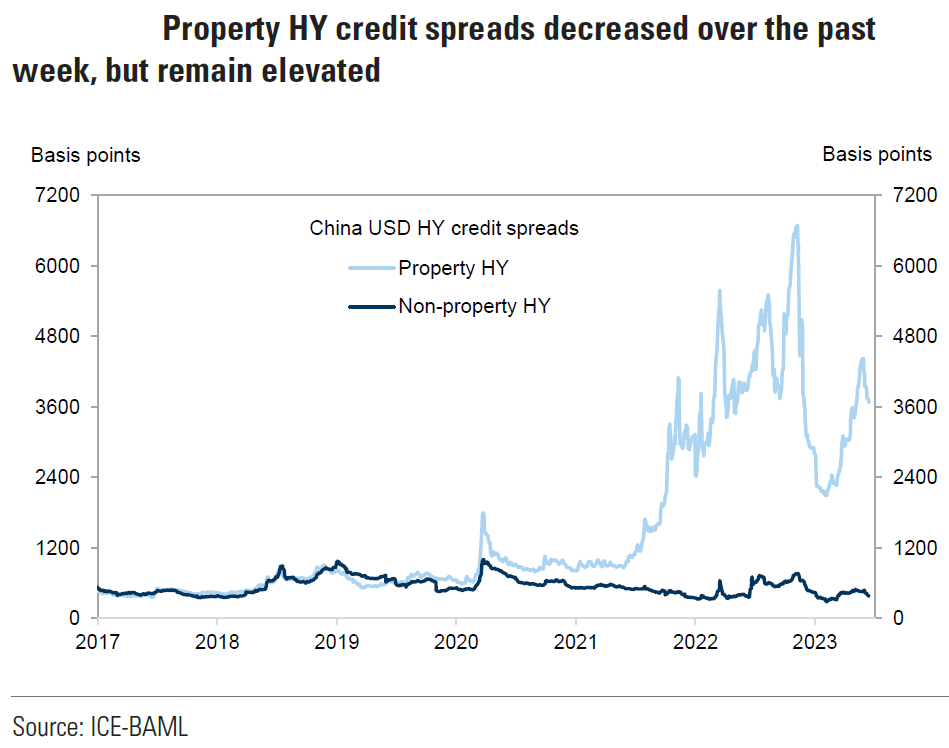
Source: Goldman, Sachs, China Economic Activity and Policy Tracker: June 16 (6-16-2023)
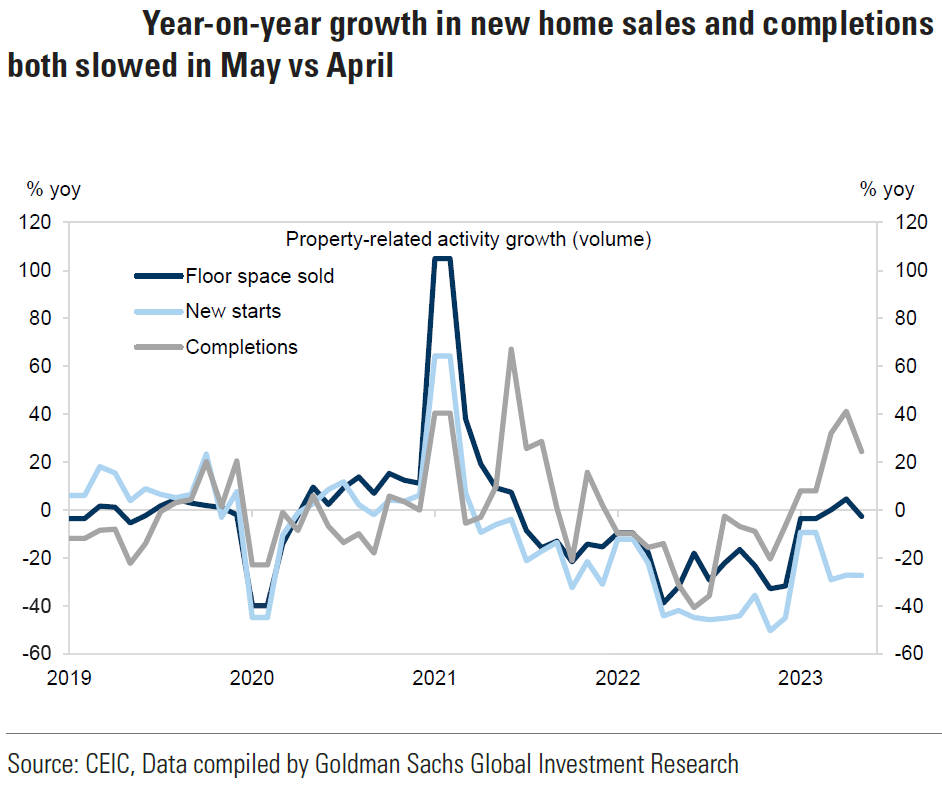
Source: Goldman Sachs, China: May activity data slightly missed expectations, calling for more policy easing (6-15-2023)
Bottom Line
For the time being we are maintaining our basic investment approach as expressed in last week’s commentary. We continue to prefer high quality stocks that offer good balance sheets, as well as relatively stable cash flows and profit margins. We prefer a global diversified portfolio for long term investors. We continue to stress that stock selectivity in this current environment is of paramount importance. We foresee continued financial market volatility.
We suppose that the divergence of opinions by FOMC participants is somewhat reflective of the divergence of opinions of investors and analysts. We still believe that many investors have little conviction in regard to many investments and would be quick to abandon many positions. This has the potential to lead to unpredictable financial market “swings.” We should all strive to see “both sides now.” It appears that many investors and analysts perceive the “facts” in a myriad of possibilities. Positioning and liquidity concerns will continue to be very important factors in determining financial market trends.
Source: JP Morgan, Thursday data wrap-up (6-15-2023)
Definitions:
Fed Funds Terminal Rate – The terminal rate is defined as the peak spot where the benchmark interest rate, the federal funds rate, will come to rest before the central bank begins trimming it back.
Federal Open Market Committee (FOMC) – The Federal Open Market Committee (FOMC) is the branch of the Federal Reserve System that determines the direction of monetary policy specifically by directing open market operations. The committee is made up of 12 members: the seven members of the Board of Governors; the president of the Federal Reserve Bank of New York; and four of the remaining 11 Reserve Bank presidents on a rotating basis.
Fed Dot Plot – The Fed dot plot is published quarterly as a chart showing where each of the 12 members of the FOMC expect the federal funds rate to be for each of the next three years and the long term.
Fed Minutes – The Minutes are a detailed record of the Federal Open Market Committee (FOMC) meetings and are released three weeks after every meeting. The minutes offer more concise insights on the monetary policy stances of all members of the committee and how individual members see the value of the USD and other securities.
Fed’s Summary of Economic Projections (SEP) – The Federal Reserve releases a summary of Federal Open Market Committee participants’ projections for GDP growth, the unemployment rate, inflation, and the appropriate policy interest rate. The summary also provides information regarding policymakers’ views on the uncertainty and risks attending the outlook. This happens four times every year.
European Central Bank (ECB) – The European Central Bank (ECB) is the central bank responsible for monetary policy of the European Union (EU) member countries that have adopted the euro currency. This currency union is known as the eurozone and currently includes 19 countries. The ECB’s primary objective is price stability in the euro area.
Initial Unemployment Insurance Claims – Initial claims are new jobless claims filed by U.S. workers seeking unemployment compensation, included in the unemployment insurance weekly claims report.
Continuing Claims – Continuing claims track the number of U.S. residents filing for ongoing unemployment benefits in a given week. Continuing claims measure ongoing unemployment benefits, which is in contrast to initial claims, which track new filings for benefits.
Headline Consumer Price Index (Headline CPI) – Headline inflation is the raw inflation figure reported through the Consumer Price Index (CPI) that is released monthly by the Bureau of Labor Statistics (BLS). The CPI calculates the cost to purchase a fixed basket of goods to determine how much inflation is occurring in the broad economy. The CPI uses a base year and indexes the current year’s prices, according to the base year’s values.
Core Consumer Price Index (Core CPI) – Core inflation removes the CPI components that can exhibit large amounts of volatility from month to month, which can cause unwanted distortion to the headline figure. The most commonly removed factors are those relating to the costs of food and energy. Food prices can be affected by factors outside of those attributed to the economy, such as environmental shifts that cause issues in the growth of crops. Energy costs, such as oil production, can be affected by forces outside of traditional supply and demand, such as political dissent.
Retail Sales – Retail sales represent a key macroeconomic metric that tracks consumer demand for finished goods. It acts as a key economic barometer and whether inflationary pressures exist. Retail sales are measured by durable and non-durable goods purchased over a defined period of time.
U.S. Dollar Index (DXY) – The U.S. dollar index is a measure of the value of the U.S. dollar relative to a basket of foreign currencies.
IMPORTANT DISCLOSURES
The views and opinions included in these materials belong to their author and do not necessarily reflect the views and opinions of NewEdge Capital Group, LLC.
This information is general in nature and has been prepared solely for informational and educational purposes and does not constitute an offer or a recommendation to buy or sell any particular security or to adopt any specific investment strategy.
NewEdge and its affiliates do not render advice on legal, tax and/or tax accounting matters. You should consult your personal tax and/or legal advisor to learn about any potential tax or other implications that may result from acting on a particular recommendation.
The trademarks and service marks contained herein are the property of their respective owners. Unless otherwise specifically indicated, all information with respect to any third party not affiliated with NewEdge has been provided by, and is the sole responsibility of, such third party and has not been independently verified by NewEdge, its affiliates or any other independent third party. No representation is given with respect to its accuracy or completeness, and such information and opinions may change without notice.
Investing involves risk, including possible loss of principal. Past performance is no guarantee of future results.
Any forward-looking statements or forecasts are based on assumptions and actual results are expected to vary from any such statements or forecasts. No assurance can be given that investment objectives or target returns will be achieved. Future returns may be higher or lower than the estimates presented herein.
An investment cannot be made directly in an index. Indices are unmanaged and have no fees or expenses. You can obtain information about many indices online at a variety of sources including: https://www.sec.gov/fast-answers/answersindiceshtm.html or http://www.nasdaq.com/reference/index-descriptions.aspx.
All data is subject to change without notice.
© 2024 NewEdge Capital Group, LLC


