


And if the dam breaks open many years too soon
And if there is no room upon the hill
And if your head explodes with dark forebodings too
I’ll see you on the dark side of the moon
-“Brain Damage”, Pink Floyd
We are a couple weeks late in celebrating the 50th anniversary of Pink Floyd’s groundbreaking Dark Side of the Moon album (did you know that it stayed on the Billboard charts for a consecutive 14 years and a total 974 weeks!), but “Brain Damage” feels particularly appropriate to describe a week of frightening headlines and tumultuous markets that surprisingly finished with the S&P 500 higher.
On Wednesday, we hosted a webcast for clients to go through our assessment of recent market news, the impacts of troubles with banks, the possible path forward for the Fed ahead, and what this means for equity and bond markets.
You can access the replay of the webcast here.
For chart lovers, we also put together a deck that covers these topics.
You can access the chart deck here.
Below we highlight the top charts to watch from the deck (and aim to not make your “head explode with dark forebodings too”!).
- Fallout Boys: The ultimate fallout and impact on the real economy of SVB’s collapse and challenges within the regional bank sector will be through loan growth. Loan growth remained robust throughout 2022, despite higher rates, but we will watch for signs that loan growth slows going forward, mostly for smaller institutions that have greater risk of deposit flight and balance sheet challenges. Note that loan growth typically is a lagging indicator (it typically contracts once a recession has begun).
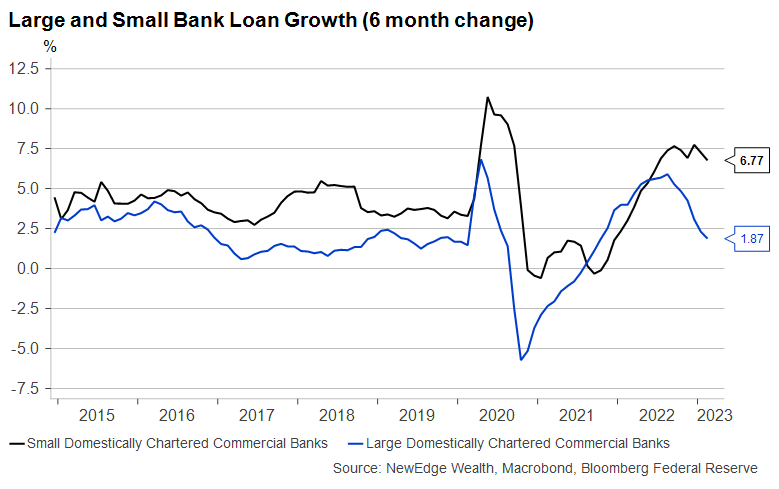
As of February 2023
2. Something’s Happening Here: Credit stress reentered the conversation after months of being benign. We look to credit spreads as a real-time indicator of funding market disruption in the fallout from SVB/banking issues. Note that despite this spread widening, credit bonds (high yield and investment grade) benefitted from the drop in Treasury yields in response to risk-off trading.
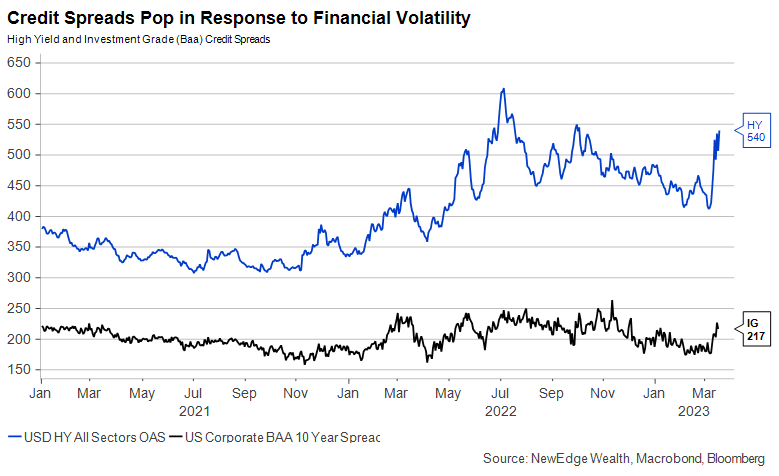
As of 3/17/23
3. Volte-Face: The Fed Funds Futures market did a swift about-face in response to the stresses within the banking sector. The market went from pricing in a higher-for-longer Fed Funds rate, to a lower terminal rate and 100 bps of cuts starting in June of this year. Will the Fed deliver on these cuts? It all depends on how they balance the need to support financial stability vs. price stability (fighting inflation).
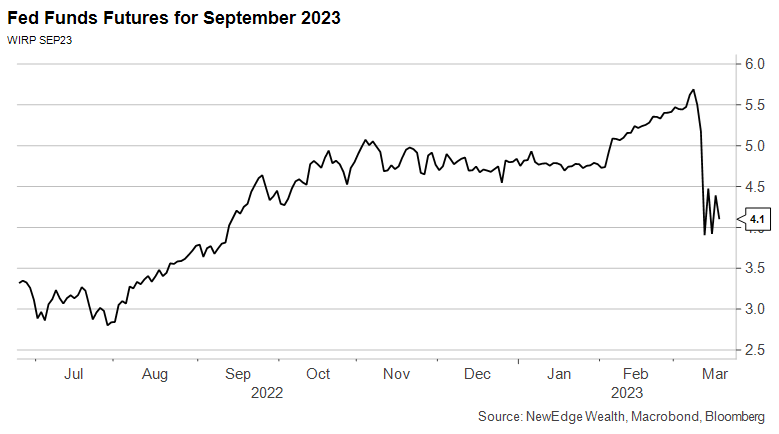
As of 3/17/23
4. It’s the Climb: As short-term yields plunged in the past week, we have seen a brisk re-steepening of the yield curve. We have been watching for a re-steepening of the yield curve as a recession timing signal. If this re-steepening climb continues, it would reflect the bond market increasingly pricing in an imminent recession.
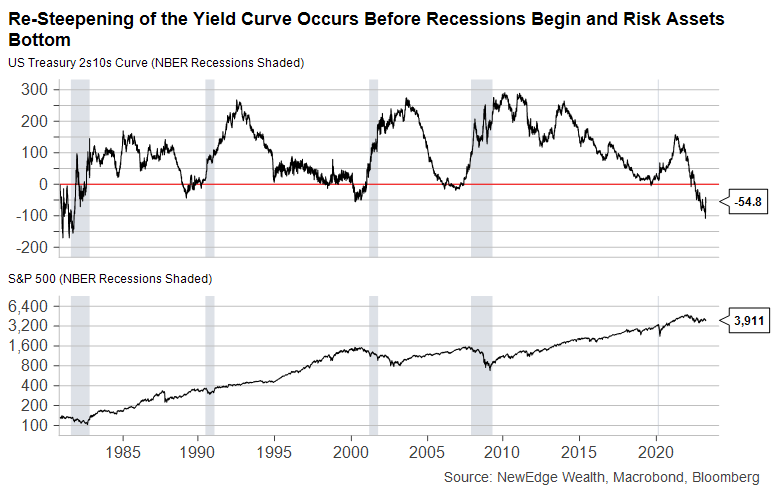
As of 3/17/23
5. Serving Two Masters: Unlike prior times when financial sector/markets came under stress and the Fed was able to provide support to calm markets (green circles below), inflation was benign. At each of these “pivots,” inflation was at or below the Fed’s 2% target.
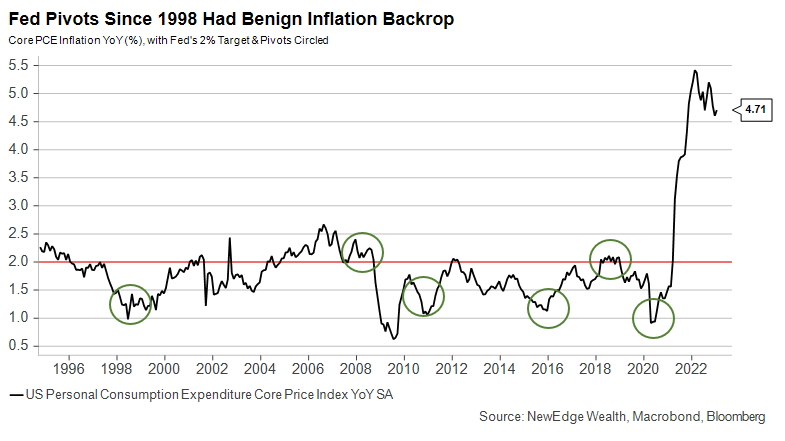
As of February 2023
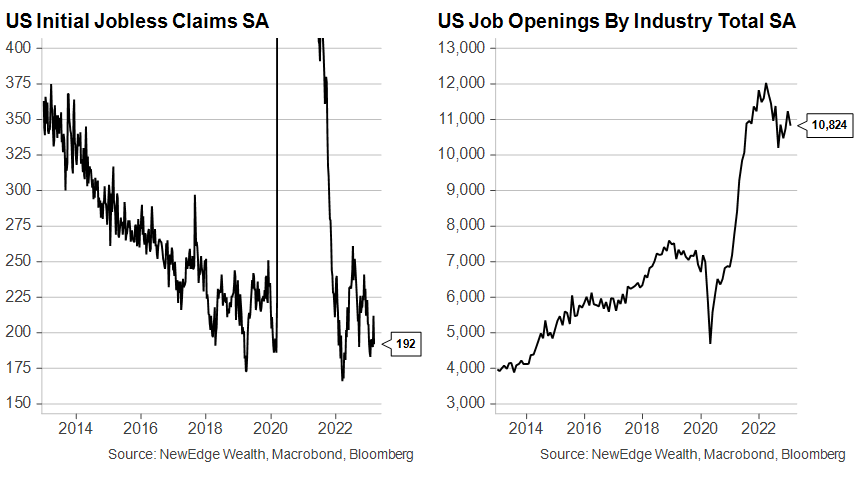
6. I’m Still Standing: In weighing their rate decisions, the Fed is also considering the state of the labor market, which remains tight. Jobless claims remain subdued, job openings elevated, and wage growth strong. Consumers are holding in with still-healthy balance sheets and better wages. We could see some of these metrics deteriorate as we get into 2Q23 when announced layoffs are enacted and student loan repayments potentially restart. Importantly, the Fed will only have March payrolls data when it meets May 3-4, making initial claims a must-watch indicator.
As of 3/17/23
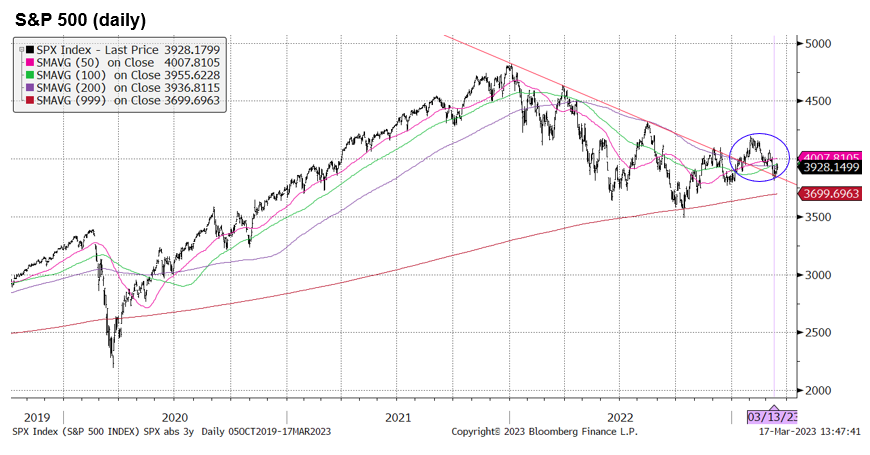
7. It Was All a Dream?: The “breakout” above the 200-day moving average for the S&P 500 in February is looking precarious and at risk of being a “false breakout”. We will watch closely how we interact with this 200-day and the prior downtrend line in the coming weeks. This will be an important signal for the potential for a retest of prior lows.
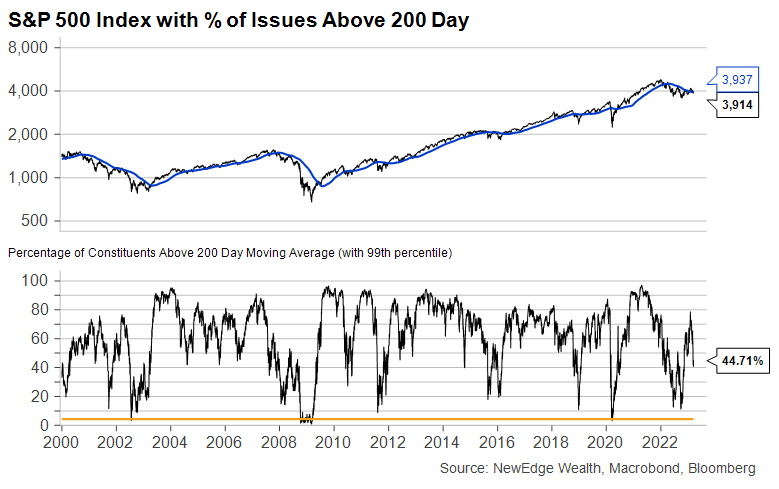
8. Underneath It All: But there is deterioration under the surface for the S&P 500. With only 45% of names above their 200-day, more names are trading below their 200-day moving averages than at the December 2022 lows, indicating some deterioration in the emerging uptrends for 55% of the names in the index.
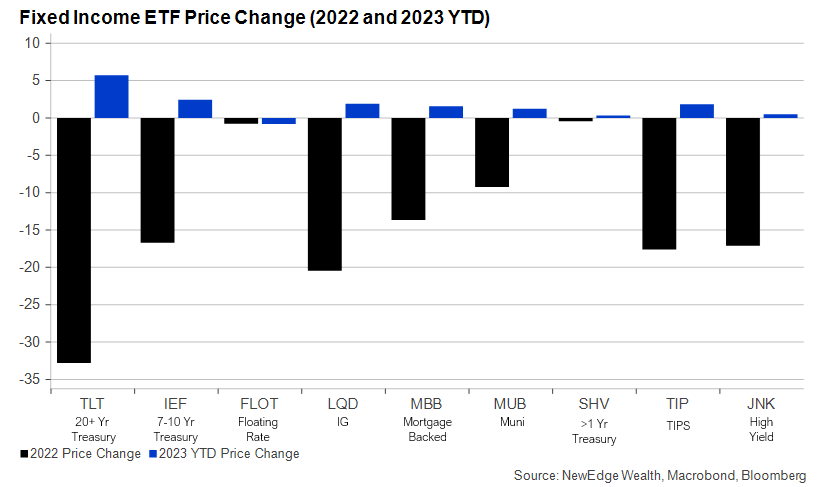
9. Back in Black: Fixed income is getting off to a much better start to the year than 2022. As bond yields have fallen across the curve in response to less Fed tightening expectations and a flight-to-safety, we have seen gains for fixed income to start 2023.
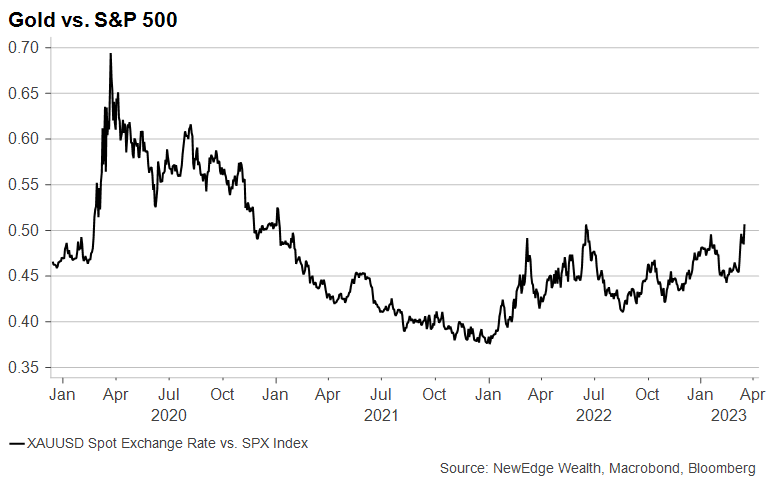
10. No More Golden Slumbers: Gold has been outperforming the S&P 500 in 2023. Strategas’ Chris Verrone has been noting that if October 2022 was the ultimate market low of this bear market, it would be the only low in recent history where Gold (often a risk-off asset) has outperformed stocks (a risk-on asset).
Top Points of the Week
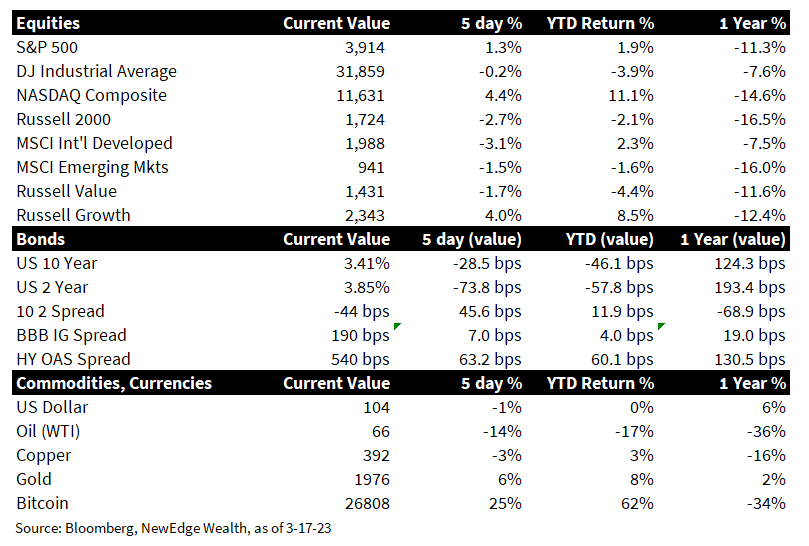
- Equities Mixed: Equity indices were mixed on the week, led by gains in Growth and Technology stocks. Tech emerged as the beneficiary of both lower interest rates (tech multiples have been particularly sensitive to interest rates) and a risk-off tone in markets (some tech names are perceived to have resilient earnings and strong balance sheets). Small caps notably underperformed (typically a sign of fading risk appetite and liquidity support), while international indices were lower in response to weakness within the banking sector (the international developed index has a higher weighting to financials that U.S. indices).
- Bond Yields Plunge: Bond yields dropped sharply across the curve in response to financial market distress, lower inflation and growth expectations, more dovish expectations about the path forward for Fed policy, and a flight-to-safety. The yield curve re-steepened materially as short rates fell more than long rates. Note this re-steepening of the yield curve has preceded recessions in prior cycles.
- Oil Plunged: Crude oil fell sharply on the week to a new year-to-date low. Derivates markets were blamed for the downside volatility (the unwinding of positions is thought to have contributed to weakness), while the U.S. signaled that it was not in a hurry to replenish the Strategic Petroleum Reserve (the administration had previously signaled that it would begin buying below $70/barrel).
- Gold and Bitcoin Surged: Gold jumped in a flight-to-safety, as well as a beneficiary of the drop in real yields. Bitcoin surged higher, possibly on bets that the Fed would be forced to become more supportive of liquidity conditions in the future if financial conditions worsened with banking stress. There were also sharp inflows into speculative growth/innovation stocks on bets for more accommodative liquidity.
- Banking Stresses Continued: Late-Sunday the Fed announced its plan to backstop 100% of Silicon Valley Bank and Signature Bank’s deposits, post both banks falling into FDIC receivership, along with funding facilities to support other banks that were experiencing deposit flight and had unrealized losses on their balance sheets. The Fed’s Discount Window was used a record pace, with borrowing reaching an all-time high of $152 billion vs. $111 billion in 2008. Another regional bank, First Republic, faced challenges during the week, which ended with eleven banks pumping $30 billion of deposits into First Republic in order to stabilize it. Across the pond in Europe, Credit Suisse shares plummeted and its credit default swaps skyrocketed, with the Swiss National Bank ultimately announcing a liquidity injection into the troubled institution.
- ECB Raises 50 bps: The European Central Bank (ECB) announced another jumbo-rate hike of 50 bps this week, despite the current turbulence in the financial markets. The decision was taken as somewhat dovish given the bank stressed “data dependence” and did not commit to further rate hikes at future meetings.
- U.S. Inflation Mixed: February consumer inflation (CPI) was in line with expectations (Headline YoY +6%, Core YoY +5.5%), however the Fed’s closely watched “supercore” measure (Services ex- housing, energy, and food) expanded at a faster pace month-over-month in February vs. January. Producer prices (PPI) came in below expectations (Headline YoY +4.6% vs. +5.4% consensus, Core YoY +4.4% vs. +5.2% consensus), driven by lower food prices.
- Jobs Still Tight: Initial jobless claims came in below expectations again (192k vs. 205k consensus) and dropped the most week over week since July of 2022. Continuing claims were also subdued at 1.684 million vs. 1.723 million consensus.
- Still Growing: The Atlanta Fed GDPNow index for real-time GDP growth was revised up to 3.2% for 1Q23, reflecting an economy that is still expanding, despite ongoing recession fears.
- All Eyes on the Fed Next Week: The Federal Open Market Committee (FOMC) meets next week, with a rate decision to be announced on Wednesday. The market is pricing just a 50-50 chance that the Fed raises 25 bps next week (compared to two weeks ago when the market priced a >60% chance that the Fed would raise 50 bps). Expect comments from the Fed about how they will balance financial stability as they continue to try to restrict policy enough to fight inflation. We are listening for comments about how “systemic” or “idiosyncratic” the Fed considers recent banking troubles.
IMPORTANT DISCLOSURES
Abbreviations:
Core CPI: measures the changes in the price of goods and services, excluding food and energy; Core PPI: measures the change in the selling price of goods and services sold by producers, excluding food and energy; CPI: Consumer Price Index; EBITDA: earnings before interest, taxes, depreciation, and amortization; ECB: European Central Bank; Fed Fund futures are a direct reflection of collective marketplace insight regarding the future course of the Federal Reserve’s monetary policy; FDIC: Federal Deposit Insurance Corporation; FOMC: Federal Open Market Committee; PPI: Producer Price Index.
Index Information: All returns represent total return for stated period. S&P 500 is a total return index that reflects both changes in the prices of stocks in the S&P 500 Index as well as the reinvestment of the dividend income from its underlying stocks. Dow Jones Industrial Average (DJ Industrial Average) is a price-weighted average of 30 actively traded blue-chip stocks trading New York Stock Exchange and Nasdaq. The NASDAQ Composite Index measures all NASDAQ domestic and international based common type stocks listed on the Nasdaq Stock Market. Russell 2000 is an index that measures the performance of the small-cap segment of the U.S. equity universe. MSCI International Developed measures equity market performance of large, developed markets not including the U.S. MSCI Emerging Markets (MSCI Emerging Mkts) measures equity market performance of emerging markets. Russell 1000 Growth Index measures the performance of the large- cap growth segment of the US equity universe. It includes those Russell 1000 companies with relatively higher price-to-book ratios, higher I/B/E/S forecast medium term (2 year) growth and higher sales per share historical growth (5 years). The Russell 1000 Value Index measures the performance of the large cap value segment of the US equity universe. It includes those Russell 1000 companies with relatively lower price-to-book ratios, lower I/B/E/S forecast medium term (2 year) growth and lower sales per share historical growth (5 years). The BBB IG Spread is the Bloomberg Baa Corporate Index that measures the spread of BBB/Baa U.S. corporate bond yields over Treasuries. The HY OAS is the High Yield Option Adjusted Spread index measuring the spread of high yield bonds over Treasuries. Atlanta Fed GDPNow index is a “nowcast” of real GDP growth based on available economic data for the current measured quarter.
The views and opinions included in these materials belong to their author and do not necessarily reflect the views and opinions of NewEdge Capital Group, LLC.
This information is general in nature and has been prepared solely for informational and educational purposes and does not constitute an offer or a recommendation to buy or sell any particular security or to adopt any specific investment strategy.
NewEdge and its affiliates do not render advice on legal, tax and/or tax accounting matters. You should consult your personal tax and/or legal advisor to learn about any potential tax or other implications that may result from acting on a particular recommendation.
The trademarks and service marks contained herein are the property of their respective owners. Unless otherwise specifically indicated, all information with respect to any third party not affiliated with NewEdge has been provided by, and is the sole responsibility of, such third party and has not been independently verified by NewEdge, its affiliates or any other independent third party. No representation is given with respect to its accuracy or completeness, and such information and opinions may change without notice.
Investing involves risk, including possible loss of principal. Past performance is no guarantee of future results.
Any forward-looking statements or forecasts are based on assumptions and actual results are expected to vary from any such statements or forecasts. No assurance can be given that investment objectives or target returns will be achieved. Future returns may be higher or lower than the estimates presented herein.
An investment cannot be made directly in an index. Indices are unmanaged and have no fees or expenses. You can obtain information about many indices online at a variety of sources including: https://www.sec.gov/answers/indices.htm.
All data is subject to change without notice.
© 2026 NewEdge Capital Group, LLC
