


Kansas’ 1976 signature song “Carry on My Wayward Son” alluding to perseverance and uncertainty, is a fitting analogy for the upcoming earnings season, which kicked off yesterday with reports from economic bellwethers J.P. Morgan, Wells Fargo, and United Healthcare. Initial results were slightly better than expected but a common theme across all three companies was decelerating revenue growth from the prior quarter and expectations for rising cost pressures in 2024.
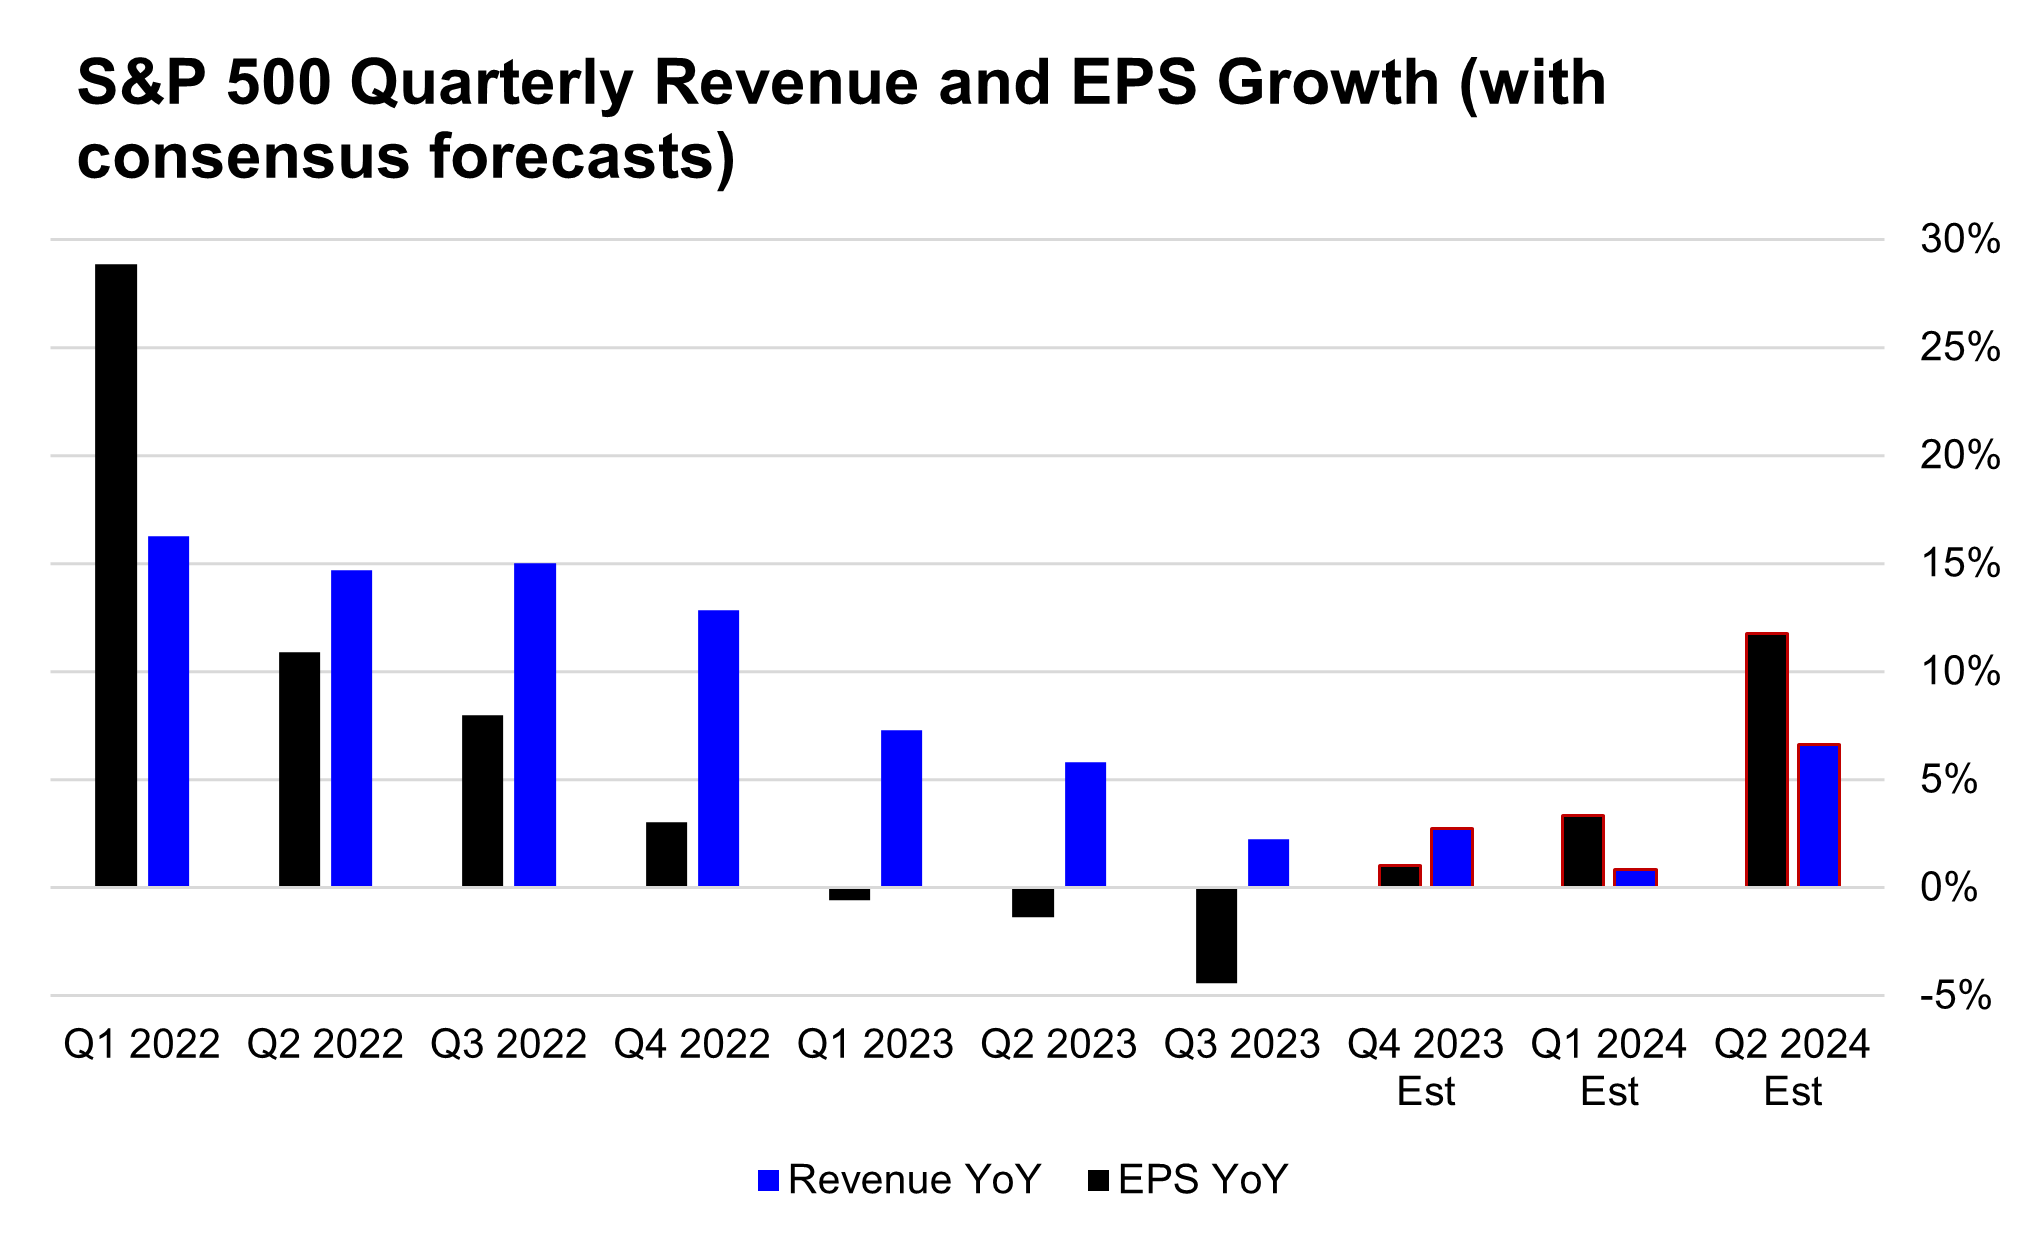
While the fourth quarter is expected to see a second consecutive quarter of positive YoY earnings growth for the S&P500 Index, it is likely to illustrate a sequential decline from the 4% EPS growth rate we saw in the third quarter and be characterized by renewed pressures on corporate profitability and wide earnings dispersion among sectors.
The extent that management teams can navigate margin pressures this quarter will be key if the market is to build on its recent strong performance and support today’s above average valuations. Any further deterioration in profitability or weaker guidance trends would throw cold water on the recent optimism around a soft landing in 2024 and make full year EPS growth of 11% more difficult to achieve, while upside surprises to margins, like we saw in the third quarter, would be a welcome jolt to the sluggish start to the year thus far in equities.
The Headlines
- Earnings in Low Gear: Positive YoY earnings growth for the second consecutive quarter is a step in the right direction, but slower sequential growth and renewed pressures on profit margins illustrate the continued difficult operating environment.
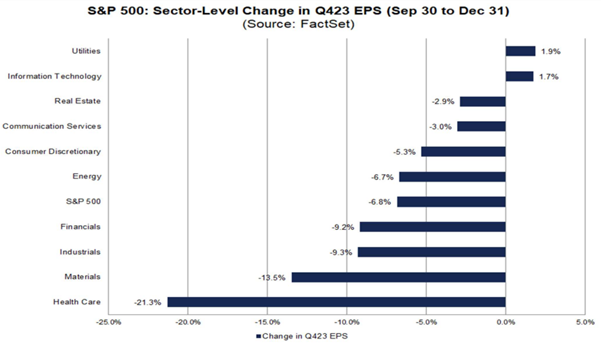
- Expectations are Modest: The last three months have seen a substantial reset in Q4 earnings expectations, which have declined from an expected +8% YoY growth at the start of the quarter to just +1% today. These negative revisions are more than double the historical average negative revision, which indicates analysts had been too optimistic at the outset of the quarter, but also creates a lower bar for earnings beats. Expectations for revenue growth at 3% YoY have remained unchanged and suggest margin pressures are the primary culprit behind lowered earnings outlook, primarily in the energy and discretionary sectors.
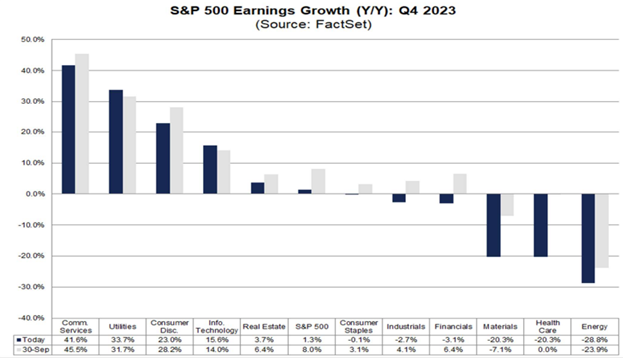
- Overall Expect Mixed Results & Wide Dispersion: 5 of 11 sectors are expected to post positive YoY earnings growth, down from 7 of 11 sectors last quarter. Earnings growth is likely to be led by Communications Services at +42% YoY and Utilities at +34% YoY. The Energy, Materials, and Healthcare sectors are expected to be among the weakest performers, all posting earnings declines of more than -20% YoY.
Revenues & Earnings: Modest Expectations but Positive Momentum
The current fourth quarter bottom-up Bloomberg consensus estimates call for 1% EPS growth and 3% revenue growth YoY, which are relatively modest expectations despite the solid 4Q23 economic activity, seasonal consumption trends, and the easing of financial conditions we saw during the quarter. This uptick in economic activity is partly why analysts are expecting to see revenue growth accelerate from 2.0% last quarter, although YoY revenue growth remains well below the double-digit growth rates, we saw in 2022.
An important factor for this earnings season has been the resetting of expectations as 9 of 11 sectors have seen negative earnings revisions over the past three months. These downward revisions have been most pronounced in the Healthcare and Materials sectors, while the Technology and Utilities sectors have seen modest positive revisions, which can often correlate to forward price performance.
Overall, these low expectations combined with above average downward earnings revisions create a low bar for earnings beats. Ultimately, we expect forward guidance and commentary around the operating environment to be key drivers of share price performance, while management teams that are adept at efficient capital allocation and cost management may be this quarter’s winners.
Profit Margins: Under Pressure
Renewed pressures on operating profitability are likely to be another key theme this earnings season, meaning the trends around profit margins and forward guidance will be highly scrutinized.
Overall index level operating margins are expected to decline 40bps from last quarter to 14.6% this quarter. This is also a decline from 14.9% a year ago and would mark the second lowest quarter for operating margins since the fourth quarter of 2020.
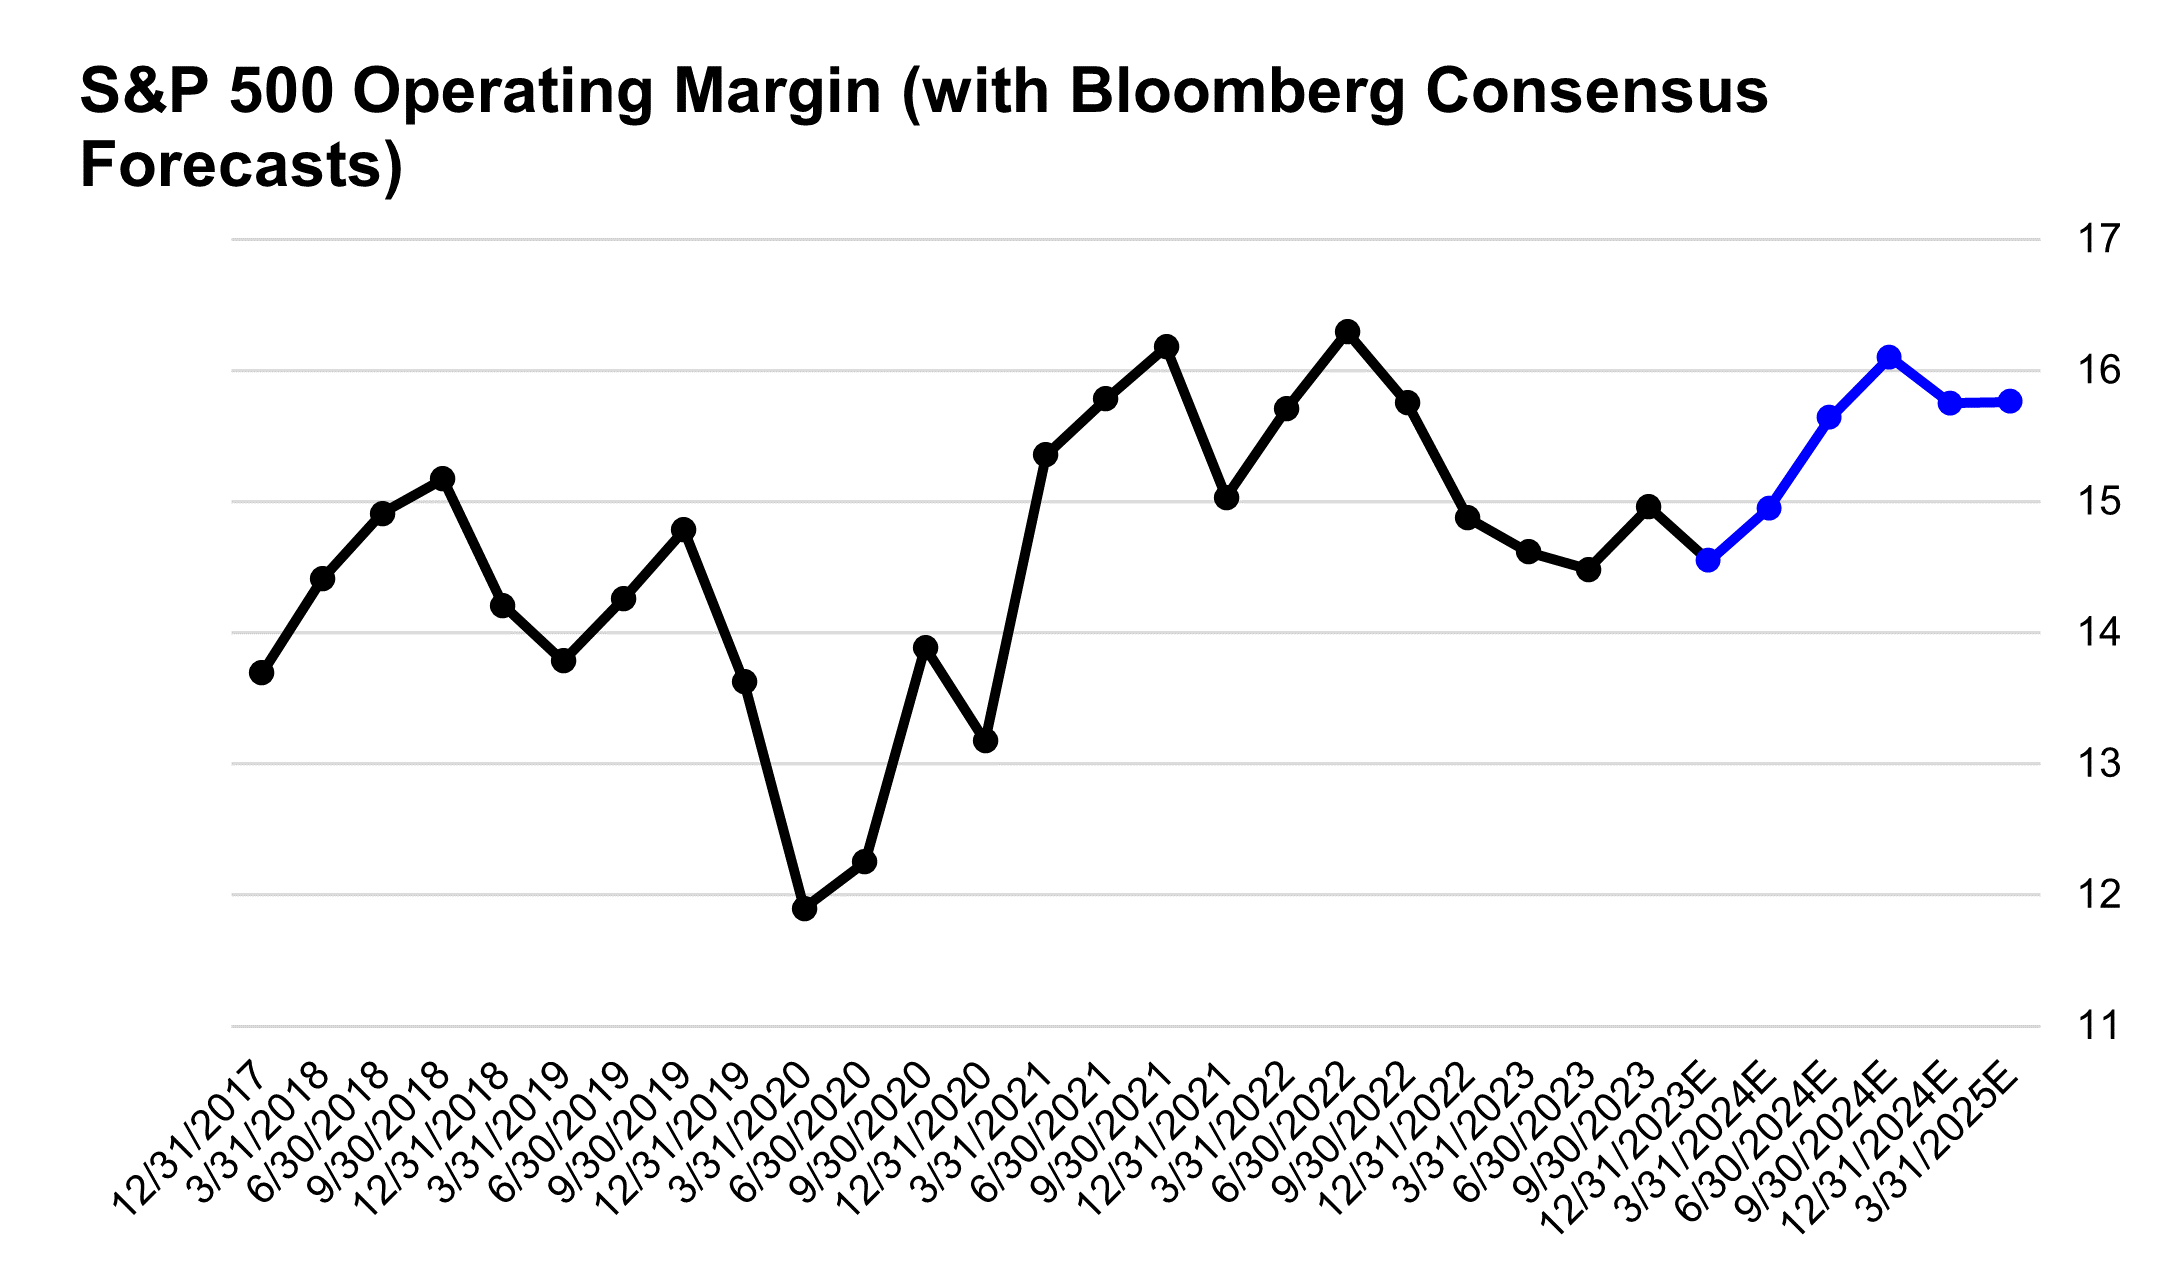
The slide in profit margins is expected to be broad based with 7 of 9 sectors reporting sequential declines, led by the Consumer Discretionary sector. While Amazon has an outsized influence on the sector’s profitability, the broader retail and consumer services industries continue to navigate a challenging operating environment. Overall, we attribute index level pressures on profitability to the combination of fading pricing power from more cost-conscious consumers and ebbing inflation, lower commodity prices, and increased labor costs due to the persistently tight labor market. Last year, companies that were able to cut costs and maintain top line growth were dramatic outperformers and we would expect similar trends to continue in 2024.
Below the Surface: Sector Level Trends
The largest contributors to index level earnings growth in the fourth quarter are expected to be the sectors that led from a performance standpoint in 2023.
For 4Q23, analysts expect YoY EPS growth of 42% for the Communications sector, 23% for the Consumer Discretionary sector, and 16% for the Technology sector. These sectors comprise 48% of the S&P 500, while the majority of this growth can be attributed to a handful of the largest companies in the index. Of these three sectors, Technology is the lone member expected to post a sequential increase in earnings growth mainly due to easier comparisons vs. the prior quarter and boosted by a 36% YoY increase in semiconductor EPS growth, an industry that is slowly emerging from a recent cyclical downturn.
Similar to last quarter, the Energy, Materials, and Healthcare sectors are expected to be a meaningful drag on index level EPS growth, all three of which are expected to post earnings declines greater than -20% YoY. While the Energy sector is expected to produce the weakest YoY EPS growth for the third consecutive quarter, surprisingly it has the second largest sequential improvement of any sector, and its drag on overall index EPS continues to fade. This comes despite a roughly 8% slide in the average quarterly price of WTI over the past year and reflects a renewed focus on operational efficiency among many large energy companies.
Turning to the Healthcare sector, analysts expect earnings declines of -20% YoY, marking the fifth consecutive quarter of falling profits, and given the sector’s 13% index weight, will likely be the largest drag on S&P 500 earnings growth for the quarter. The sector has historically produced relatively stable margins and consistent earnings growth, yet over the past 15 months the sector has been impacted by a combination of a post covid sales hangover, elevated wage and R&D costs, and sluggish top line growth. This quarter is expected to mark the trough in operating margins for the Healthcare sector, and turning to 2024, the sector is expected to post the second largest recovery in margins while generating index leading EPS growth of 17% for the full year. It is clear that the return to profit growth of this sector over the next few quarters will be key if the S&P 500 is to meet full year EPS growth estimates.
Checking in on the Magnificent Seven
The Magnificent Seven stocks (Microsoft, Apple, Amazon, Nvidia, Alphabet, Meta, and Tesla) are, as a group, once again expected to generate robust YoY quarterly results. The growth of this small number of large stocks will heavily influence S&P 500 index level growth rates given their near 30% cumulative weight in the index.
The average GAAP earnings growth rate for the group for Q4 is expected to be 150% YoY, primarily due to colossal EPS growth in Amazon and Nvidia. Excluding those two names the average EPS growth rate for the group is still expected to be 45% YoY, with Telsa being the only member expected to post a YoY earnings decline of -42%.
The eye-popping profit growth in this group of stocks and the enthusiasm around the monetization of AI technology were key factors behind the strong performance of the group in 2023, which also helped mitigate a deeper earnings recession at the broader index level. However, as the rate of growth normalizes for this group, due to tougher year-over-year comparisons in the coming quarters and the need to dig deeper to find incremental operational efficiency, the earnings growth contribution of the Magnificent Seven will likely fall. As a result, we will need to see the remaining 493 companies in the index carry more of the earnings burden in 2024 if expectations are to be realized.
Closing Thoughts: Investors zero in on the fundamentals
This will be one of the more important earnings seasons in recent memory given the convergence of market factors including – indices near record levels, increased expectations of an economic soft landing, and elevated valuations which are banking on the support from both fundamental earnings growth and easier monetary policy. While earnings expectations have been reset lower in recent months, we believe earnings beats may be met with more skepticism than usual, as investors will be more focused on progress towards margin improvement as well as constructive guidance around business activity in 2024.
Top Points of the Week
By Austin Capasso and Ben Lope
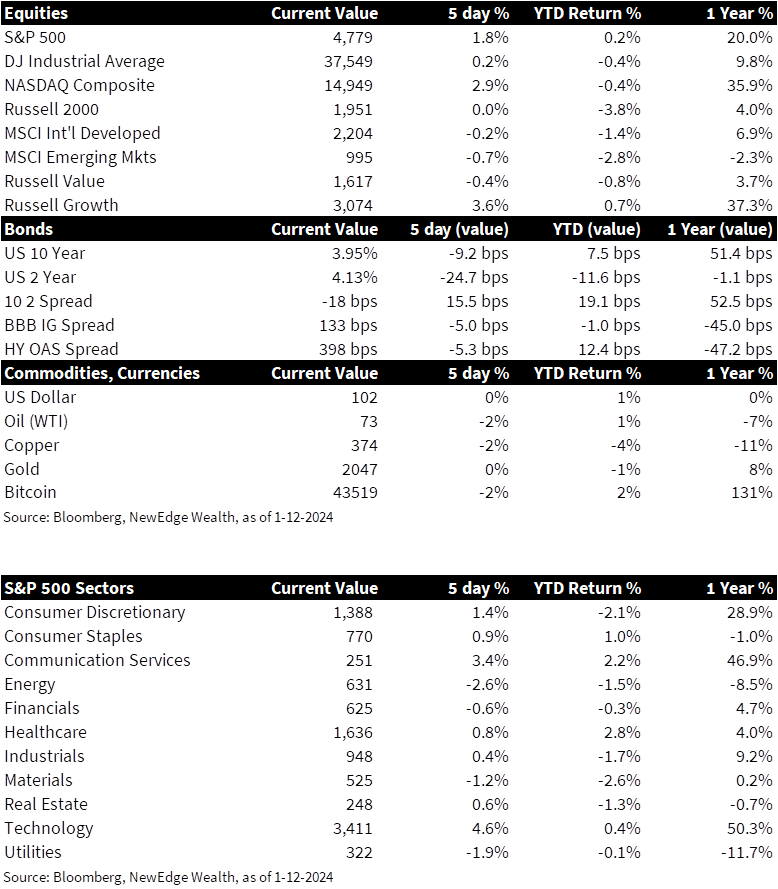
1. Equities: Mixed Bag for Week Two of 2024 – After a down week to start the year, most major US equity indices are in the black for week two of 2024. The tech-heavy NASDAQ composite was up approximately 3%, leading US indices. International equities, as measured by the MSCI Developed Markets and MSCI Emerging Markets indices were down slightly, continuing their negative start to the year.
2. Yield Curve Moves Closer to Flat – The2 -10 yearTreasury bond yield curve became significantly less inverted this week as long rates declined much less than short rates, resulting in the yield curve moving as close to flat as it has been in about two months. Yields on 2 year Treasury bonds declined by approximately 25bps while yields on 10 year Treasury bonds declined by approximately 10bps.
3. Oil Flat Despite Military Actions in Red Sea – Despite a spike in the price per barrel of Brent crude oil on Friday that briefly placed the commodity above $80, crude prices retraced all their Friday gains to end the week about flat. The spike in oil prices was attributed to news that the U.S. and some of its allies commenced targeted strikes on the Houthi rebel group in Yemen in response to attacks by the group on commercial and trade ships in the Red Sea. Houthi rebels, part of a broader Iran-backed “axis of resistance” that seeks the destruction of Israel, began targeting ships that they believe to be coming from or going to Israel following the onset of the Israel-Hamas war.
4. US CPI in December Comes in Above Expectations – The consumer price index (CPI), which measures inflation in consumer prices, came in hotter than expected. Headline CPI increased 0.3% on a monthly basis and 3.4% on an annual basis, compared with respective estimates of 0.2% and 3.2%. Core CPI, excluding volatile food and energy prices, rose 0.3% on the month and 3.9% from a year ago, compared with respective estimates of 0.3% and 3.8%. The rent component of CPI was the real contributor to the increase. The higher result caught investors by surprise and caused yields to initially drop. This outcome points to the continued resilience of the US consumer and economy.
5. Fed Speak This Week – This week saw an abundant number of Fed speakers, all expressing their views on the current stance of Fed policy going forward. Raphael Bostic, President of the Federal Reserve Bank of Atlanta, was in the camp of cutting rates twice this year but starting the process later in the third quarter of 2024. Michelle Bowman, a historically hawkish member of the Board of Governors, kept the idea of a rate hike on the table depending on incoming economic data. John Wiliams, President of the Federal Reserve Bank of NY, expressed that it is paramount to see inflation move back down to their 2% target. He is willing to keep rates higher until disinflation is certain. Our in-house view remains that the Fed will not cut rates in March unless there is a big downside surprise in inflation.
6. Drop in Jobless Claims – This week,US jobless claims dropped to 202k versus 210k expected, the lowest level since October. Continuous claims came in at 8.3M and have fallen 90k since the end of November last year. These results underscore the acceleration of the economy in December and limits yields to the downside, which ultimately creates an obstacle for bonds to rally. Jobless claims at these low levels point to an imbalance between supply and demand dynamics in the jobs market. We will be watching jobless claims closely for any indications of a slowdown.
7. House Speaker Johnson Stands by Spending Deal – As pressure from the right flank of the Republican party mounts on House Speaker Mike Johnson to abandon the government spending agreement he has negotiated with House Democrats, theSpeaker remained firm in his commitment to standing by the currently proposed deal. This proposed deal sets the total amount of government spending at $1.66 trillion in 2024, in line with the spending bill crafted by former Speaker McCarthy in 2023, but still far above what further right Freedom Caucus members want to see from their Majority Leader. A vote on the deal is expected to occur in the coming days to avoid a January 19th partial government shutdown.
8. Development of Spot-based Bitcoin ETFs – This proved to be a historic week for cryptocurrency, where the SEC approved trading for spot-based Bitcoin ETFs. Eleven different spot Bitcoin ETFs, including well known issuers like Blackrock, 21 Shares/Ark, and Fidelity, will now be listed on various exchanges so that investors can gain exposure to Bitcoin through an ETF product. Prior to this week’s approval, the SEC had rejected previous applications of a spot-based Bitcoin ETF on the grounds that the asset class is unregulated and volatile in nature.
9. 4Q 2023 Earnings Season is Upon Us – Fourth quarter earnings season kicked off this morning and the road ahead looks bumpy with low expectations. Big banks like JPMorgan (JPM) and Wells Fargo (WFC) showed weaker than expected broader results. Companies across the financials industry have been forced to pay up for deposits as customers shift from cash to higher yielding instruments, which are squeezing their margins. Healthcare powerhouse UnitedHealth Group (UNH) reported higher medical costs and pressures on profitability across the healthcare industry.
10. The Week Ahead – The MLK Day federal holiday will have markets closed on Monday, but a smattering of economic data will be released in the shortened trading week, namely December Retail Sales, the Fed’s Beige Book, and December Existing Home Sales. Q4 earnings season will heat up but continue to skew towards announcements from companies in the Financials sector such as Goldman Sachs (GS), Charles Schwab (SCHW), and Comerica (CMA).
IMPORTANT DISCLOSURES
Abbreviations/Definitions: Beige Book: Summary of Commentary on Current Economic Conditions by Federal Reserve District is a report is published eight times per year, where each Federal Reserve Bank summarizes anecdotal information on current economic conditions in its District; Brent blend: a blend of crude oil extracted from oilfields in the North Sea between the United Kingdom and Norway. It is an industry standard because it is “light,” meaning not overly dense, and “sweet,” meaning it’s low in sulfur content; Core CPI: measures the changes in the price of goods and services, excluding food and energy; CPI: Consumer Price Index; EPS: earnings per share; Fed speak: refers to speeches about monetary policy given by members of the U.S. Federal Reserve Bord of Governors; Headline CPI: the raw inflation figure reported through CPI that calculates the cost to purchase a fixed basket of goods to determine how much inflation is occurring in the broad economy; West Texas Intermediate (WTI) Crude: refers to a grade or a mix of crude oil, and/or the spot price, the futures price, or the assessed price for that oil; colloquially WTI usually refers to the price of the New York Mercantile Exchange WTI Crude Oil futures contract or the contract itself.
Index Information: All returns represent total return for stated period. S&P 500 is a total return index that reflects both changes in the prices of stocks in the S&P 500 Index as well as the reinvestment of the dividend income from its underlying stocks. Dow Jones Industrial Average (DJ Industrial Average) is a price-weighted average of 30 actively traded blue-chip stocks trading New York Stock Exchange and Nasdaq. The NASDAQ Composite Index measures all NASDAQ domestic and international based common type stocks listed on the Nasdaq Stock Market. Russell 2000 is an index that measures the performance of the small-cap segment of the U.S. equity universe. MSCI International Developed measures equity market performance of large, developed markets not including the U.S. MSCI Emerging Markets (MSCI Emerging Mkts) measures equity market performance of emerging markets. Russell 1000 Growth Index measures the performance of the large- cap growth segment of the US equity universe. It includes those Russell 1000 companies with relatively higher price-to-book ratios, higher I/B/E/S forecast medium term (2 year) growth and higher sales per share historical growth (5 years). The Russell 1000 Value Index measures the performance of the large cap value segment of the US equity universe. It includes those Russell 1000 companies with relatively lower price-to-book ratios, lower I/B/E/S forecast medium term (2 year) growth and lower sales per share historical growth (5 years). The BBB IG Spread is the Bloomberg Baa Corporate Index that measures the spread of BBB/Baa U.S. corporate bond yields over Treasuries. The HY OAS is the High Yield Option Adjusted Spread index measuring the spread of high yield bonds over Treasuries.
Sector Returns: Sectors are based on the GICS methodology. Returns are cumulative total return for stated period, including reinvestment of dividends.
The views and opinions included in these materials belong to their author and do not necessarily reflect the views and opinions of NewEdge Capital Group, LLC.
This information is general in nature and has been prepared solely for informational and educational purposes and does not constitute an offer or a recommendation to buy or sell any particular security or to adopt any specific investment strategy.
NewEdge and its affiliates do not render advice on legal, tax and/or tax accounting matters. You should consult your personal tax and/or legal advisor to learn about any potential tax or other implications that may result from acting on a particular recommendation.
The trademarks and service marks contained herein are the property of their respective owners. Unless otherwise specifically indicated, all information with respect to any third party not affiliated with NewEdge has been provided by, and is the sole responsibility of, such third party and has not been independently verified by NewEdge, its affiliates or any other independent third party. No representation is given with respect to its accuracy or completeness, and such information and opinions may change without notice.
Investing involves risk, including possible loss of principal. Past performance is no guarantee of future results.
Any forward-looking statements or forecasts are based on assumptions and actual results are expected to vary from any such statements or forecasts. No assurance can be given that investment objectives or target returns will be achieved. Future returns may be higher or lower than the estimates presented herein.
An investment cannot be made directly in an index. Indices are unmanaged and have no fees or expenses. You can obtain information about many indices online at a variety of sources including: https://www.sec.gov/answers/indices.htm.
All data is subject to change without notice.
© 2026 NewEdge Capital Group, LLC
