


“You Can’t Start the Fire without a Spark”
Bruce Springsteen, Dancing in the Dark
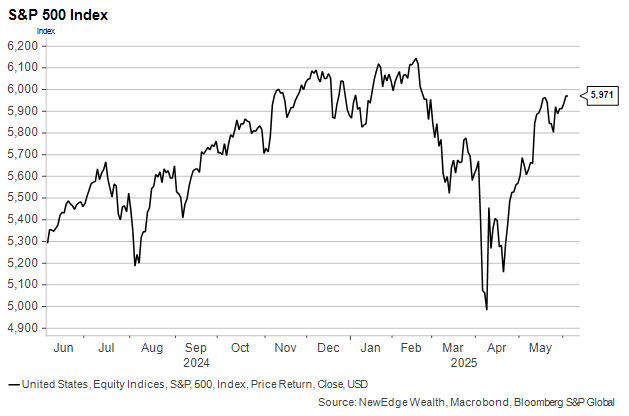
U.S. equity markets churned this week but ultimately closed higher once again, as the S&P 500 rose 1.5% and closed just 2% below its February all-time highs, continuing to build on what has been a historic recovery from the April 9th lows.
While this recovery has been met with healthy skepticism, especially on the part of many institutional investors who entered the month of May with some of the lightest positioning on record, equity markets have proven to be resilient, continuing to climb the wall of trade and economic worry, and, thus far, rewarding investors who have remained invested or put capital to work amidst recent volatility.
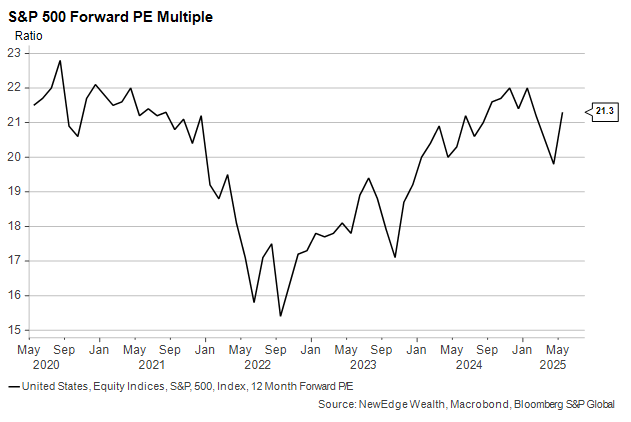
In our view, there is some fundamental support behind recent gains, specifically the robust first quarter earnings results, which delivered 13.3% growth compared to the 7.2% expected prior to the reporting season (FactSet). Equity market investors will certainly need to see this continue given lofty valuations at 21.7x next twelve months (NTM) earnings and likely downward pressure on real economic growth in the coming months.
Macro headwinds, which include upward pressure on interest rates and continued policy uncertainty, could keep the earnings environment challenging and uncertain for most corporations, as many noted in their commentary and guidance. However, we believe there remains opportunity for companies that are adept at capital allocation, and those that can continue to drive profitability through pricing power or operational efficiency to continue to be rewarded. The best companies can ultimately rise to the surface even in a muddy and uncertain environment, and, as Springsteen sang, “dance in the dark”.
Can’t Start the Fire without a Spark – Q1 Earnings Recap
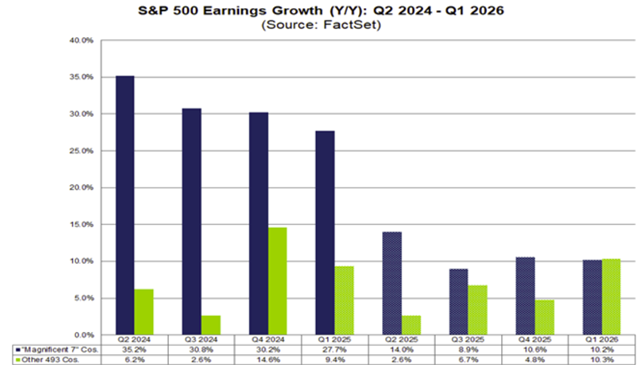
While the initial bounce of the April 9th lows was driven by a delay and ultimately by walking back of the Liberation Day tariff announcements, in our view, the fundamental spark behind this recent rally in the S&P500 was a better-than-expected earnings season, which has been further fueled by a positioning chase back into equities. In aggregate, the S&P 500 notched YoY EPS growth of 13% in Q1, nearly double the expectations entering the quarter, and the second straight quarter of double-digit growth. Results were once again led by the Magnificent 7 segment, which as a group posted YoY EPS growth of 28%, vastly exceeding the 16% EPS growth expected at the start of the quarter, largely driven by robust demand for AI infrastructure and products, and operating margin expansion (averaging +4% YoY for the group ex-TSLA).
At the same time, we also saw healthy results from the other 493 constituents, which posted aggregate YoY EPS growth of 9%, almost double the 5% YoY EPS growth expected at the start of the quarter. We expect this earnings spread between the Magnificent 7 segment and the other 493 to narrow as the year progresses. However, given the Mag 7’s earnings power and index dominance, along with diverging analyst EPS revisions for 2025 and 2025 (growth estimates largely holding steady and value estimates falling), we believe investors may continue to gravitate towards these large secular growers in the near-term.
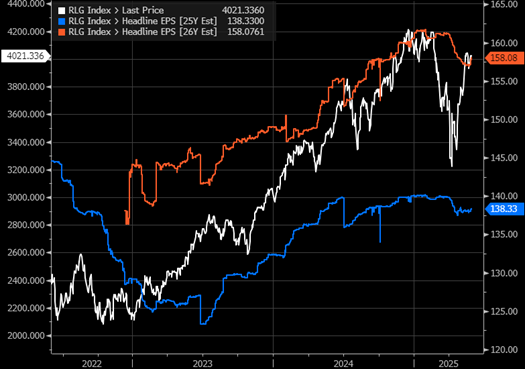
Russell 1000 Value EPS Estimates 2025 & 2026
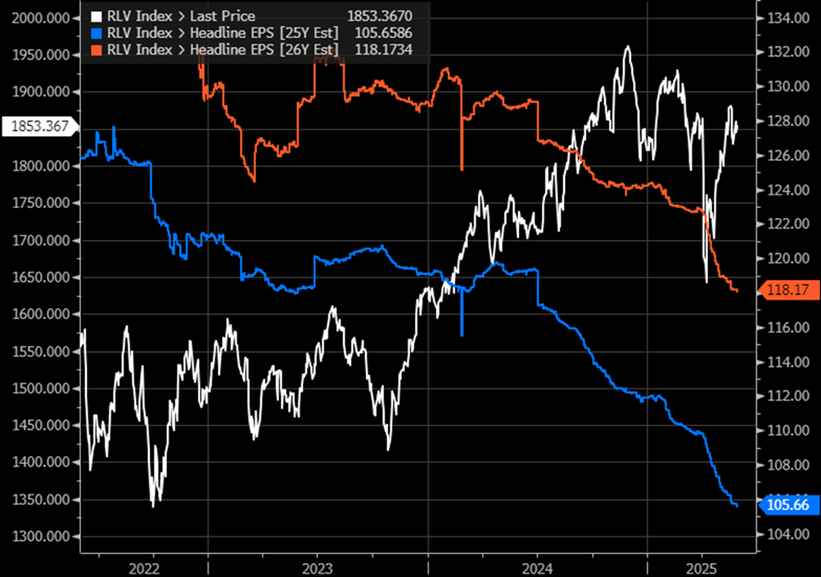
Russell 1000 Growth EPS Estimates 2025 & 2026
From a revenue standpoint, results were more in line with expectations. In aggregate, S&P 500 companies posted YoY revenue growth of 5% in Q1, slightly below the 5-year average revenue growth rate, and about 1% above expectations entering the quarter. This illustrates a point that we outlined at the start of the year, that in a challenging environment for revenue growth, lofty earnings estimates would be difficult to achieve without substantial margin improvement. Thus far, we can say that corporate profitability is trending better than expected, boosted by operational efficiency and some easing labor market pressures.
Net profit margins for the S&P 500 rose to 13.5% in Q1, up from 12.4% a year ago, registering the highest level of profitability since mid-2021. The contribution was also broader than expected, with 7 of 11 sectors posting increased profitability year over year. Margins are currently expected to remain above 13% for the remainder of the year, and it will be crucial for companies to meet or exceed these expectations in the coming quarters if full-year EPS estimates are to be achieved.
Overall, these better-than-expected results suggest that analyst expectations may have been overly pessimistic entering the quarter and that many corporations are proving to be surprisingly adept at navigating the precarious macro environment. This will become increasingly difficult as the impacts of trade policy begin to weigh on the overall economy, and it will likely become more challenging for companies to find incremental operational efficiency, given the amount of corporate belt tightening that has already taken place.
Dancing In the Dark – Guidance & Commentary in an Uncertain Environment
While first-quarter results were encouraging, they are a reflection of the past environment, and going forward, investor focus will ultimately zero in on expectations and guidance for the coming quarters.
At this point, a little more than half of S&P 500 constituents have provided full-year guidance, and of this group, 54% of companies have lowered their outlooks. This is surprisingly in line with long-term averages, however we have seen a wide range of guidance strategies so far, with many companies opting to remove guidance, provide guidance with and without tariffs, or reiterate guidance but ignore the impact of tariffs altogether, creating a cloudy picture and leaving more questions than answers for investors.
In addition, we have also seen analysts reduce their expectations for Q2 YoY EPS growth to 5%, nearly halving the growth expectations that were in place for the coming quarter over the past few months. While this does set a lower bar, this combination of complicated guidance and downward revisions may act as a headwind to equity markets until quarterly results are delivered in the coming months.
There’s Somethin’ Happenin’ Somewhere – Trends Below the Surface
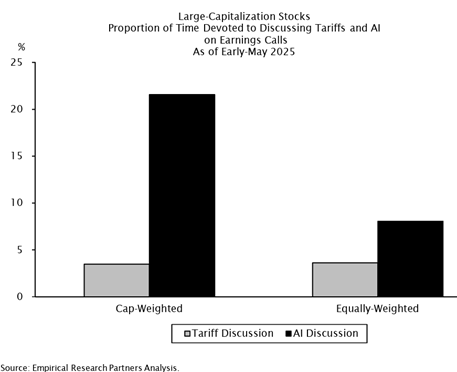
This season’s earning calls started what is likely to be a common trend for the coming quarters, as the two most commonly discussed topics by corporate management teams were around tariffs and artificial intelligence. Tariffs were mentioned on a record 91% of S&P 500 earnings calls, while AI was mentioned on 40% of earnings calls (also the highest level on record, led by Meta and Nvidia, both of which mentioned AI over 80 times).
What we find more surprising is that on a cap-weighted basis, management teams devoted 5x as much time to discussing AI as they did tariffs (source: Empirical Research). While some of this could be calculated, as CEO’s know investors and analysts tend to celebrate positive commentary, it could illustrate that AI is becoming a greater long-term priority at many companies, and tariffs may be viewed more of a short-term disturbance.
Coincidentally, the U.S. equity market seems to have recognized this divergence as well, as over the past two months, the market has become less sensitive to tariff announcements, while performance has once again gravitated around the secular theme of AI and those companies that appear well positioned to benefit. While we appreciate that the Mag 7 is a higher beta segment, which saw nearly 2x the drawdown of the average stock earlier this year, since the April lows, the Mag 7 segment has returned over 28%, while the average S&P 500 stock is up just 16%.
Ultimately, we believe tariff announcements and policy uncertainty will continue to garner the most headlines, but the long-term impact may be less severe than expected and could be offset by better-than-expected revenue and productivity gains from AI products and platforms.
Illustrating this point, thus far, just 11% of S&P 500 companies have disclosed an explicit tariff impact on their business. At the same time, AI adoption rates across business segments continue to accelerate (expected to reach 11% in aggregate by Q3 2025), and a recent McKinsey survey covering 1,500 companies around the world found that half of all respondents noted some positive benefit from AI.
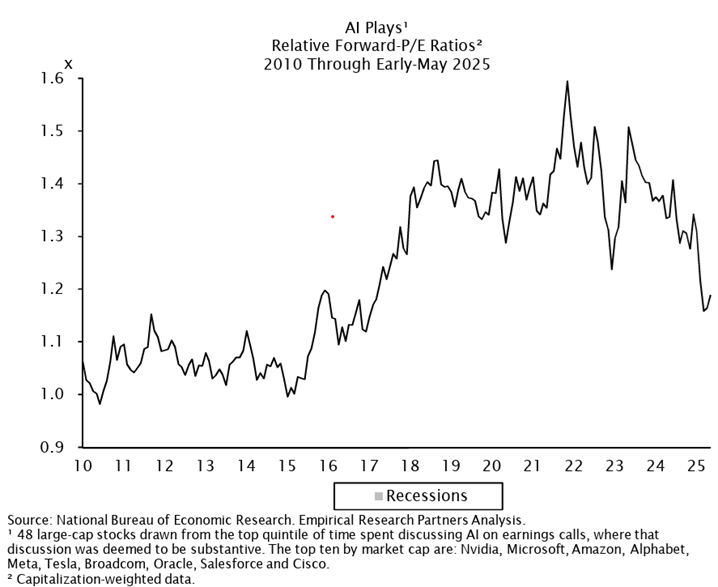
While in the near-term investors will need to parse through economic data, policy headlines, and their impact on equity markets, longer-term we may find that management teams are not as “in the dark” as clouded guidance would lead us to believe, and that that AI tailwinds and the “AI Plays” (which as a group are more reasonably valued today relative to recent history) could help equity markets weather the current environment and continue their positive momentum.
IMPORTANT DISCLOSURES
All data is as of June 6, 2025, unless otherwise noted.
The views and opinions included in these materials belong to their author and do not necessarily reflect the views and opinions of NewEdge Capital Group, LLC.
This information is general in nature and has been prepared solely for informational and educational purposes and does not constitute an offer or a recommendation to buy or sell any particular security or to adopt any specific investment strategy.
NewEdge and its affiliates do not render advice on legal, tax and/or tax accounting matters. You should consult your personal tax and/or legal advisor to learn about any potential tax or other implications that may result from acting on a particular recommendation.
The trademarks and service marks contained herein are the property of their respective owners. Unless otherwise specifically indicated, all information with respect to any third party not affiliated with NewEdge has been provided by, and is the sole responsibility of, such third party and has not been independently verified by NewEdge, its affiliates or any other independent third party. No representation is given with respect to its accuracy or completeness, and such information and opinions may change without notice.
Investing involves risk, including possible loss of principal. Past performance is no guarantee of future results.
Any forward-looking statements or forecasts are based on assumptions and actual results are expected to vary from any such statements or forecasts. No assurance can be given that investment objectives or target returns will be achieved. Future returns may be higher or lower than the estimates presented herein.
An investment cannot be made directly in an index. Indices are unmanaged and have no fees or expenses. You can obtain information about many indices online at a variety of sources including: https://www.sec.gov/answers/indices.htm.
All data is subject to change without notice.
© 2026 NewEdge Capital Group, LLC

