


Why International Equities?
For a considerable time, international stocks have been kicked to the side by the market’s infatuation with U.S. large-cap technology companies. International markets represent 194 countries, are responsible for over 84% of global GDP, comprise over 95% of the world’s population, and account for roughly 40% of the world equity market capitalization. Yet these markets are inherently less efficient than their U.S. counterparts due to lower investor participation, reduced analyst coverage, and less fluid information distribution. There are over 6,500 listed international stocks, more than double the number of companies listed in the U.S. Over the past ten years, 64% of the top 100 performing global companies each year have been located outside the U.S. Though we have been cautious on these markets for some time, international equities have experienced a degree of underperformance and valuation discounts that has spurred us to take a deeper look at the potential long-term attractiveness of these left-behind indices.
Mid-Year Summary
With all the events that have occurred in the past twelve months, including war, supply chain issues, inflationary pressures, bank failures, the rise of Artificial Intelligence (AI), data breaches, and debt ceiling negotiations – The continued rally in foreign equities over the trailing one year may have gotten lost in the noise. We’re more than halfway through the year and as of month-end (7/31/23), the MSCI ACWI Ex-U.S. posted +14% versus that of S&P 500 +20% where performance has been partly driven by the narrow strength in U.S. mega-cap tech stocks. However, on the trailing one-year, non-U.S. equities continue to outperform the U.S. S&P 500 by 160bps. Part of this dynamic can be explained by several developments: such as the value of the U.S. dollar continuing to decline compared to the Euro, Yen, and other major currencies. The Eurozone was also pleasantly surprised with the strength that came from a better-than-expected winter that reduced any sort of energy disruption from the war. Apart from the Credit Suisse and UBS merger, which was directed by European regulators in March, the impact of banking issues on foreign markets has been minimal in part to tighter foreign regulations. On the flip side, non-U.S. equities have also had some challenges year-to-date, with weak PMI (Purchasing Manufacturing Index) data coming out of Europe and China’s reopening continuing to disappoint with weakness in economic activity.
A Trip Around the World
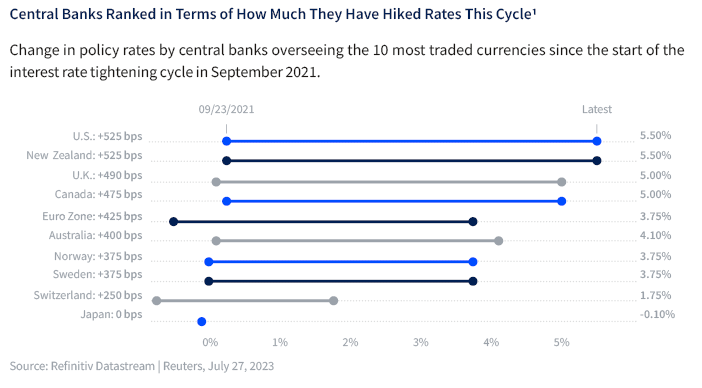
From monetary policy implementation, we continue to see central banks hiking interest rates. As of June 22nd, nine developed economies have raised rates by a total of 3,740 basis points combined.1 The European Central Bank (ECB) raised interest rates by half a point as planned during their July meeting to 3.75% and hinted that they’re keeping their options open about future hikes amid weakness in the region’s economy. The United Kingdom, which has experienced a smaller post-pandemic rebound in labor market participation compared to the U.S. and Eurozone, continues to have persistent inflation. This has forced the Bank of England (BoE) to have a hawkish stance, with the base rate lifted to 5.0% in June. When we look at the Bank of Japan (BOJ), it is the holdout dove even as inflation and wages continue to creep up domestically. In recent weeks, the Bank of Japan did “tweak” its yield curve control policy by raising the peak rate that it would tolerate on the Japanese 10-year bond (JGB) from 0.5% to 1.0%, but also allowed itself to make “discretionary” purchases of bonds below 1%. This policy move allowed the BOJ to maintain maximum flexibility while also potentially easing pressure on its currency.
Meanwhile, China, which reopened the doors to its economy post-COVID-19 lockdowns late last year, saw an initial boost to economic activity that has largely faded away due to weak balance sheets and limited policy support. Although uncertainty remains around China’s influence on global growth and the future of their recovery, we believe international developed countries should benefit from a recovering China. Countries worldwide, particularly in Europe, have been adapting their economies to address the ongoing supply chain repercussions of the COVID-19 pandemic, Ukraine conflict, and geopolitical tensions. Because of these disruptions, many countries had no other choice but to develop alternative resource markets, which resulted in more resilient, efficient, and reliable supply chain relationships. Data from the Global Supply Chain Pressure Index in January 2023 indicates a significant decline of 66% in supply chain pressure since the disruption first emerged in April 2022 and nearly 80% since the peak disruption caused by COVID-19 in December 2021. Such reduction in pressure doesn’t imply that China will be wiped out as the world’s largest manufacturing base, but that many countries have diversified their operations to include additional solutions elsewhere. This sort of transition can be a positive catalyst to developed market equities where local consumption would be stimulated if demand rises, creating a new avenue for goods at a lower price.
The Impact of USD on International Equities
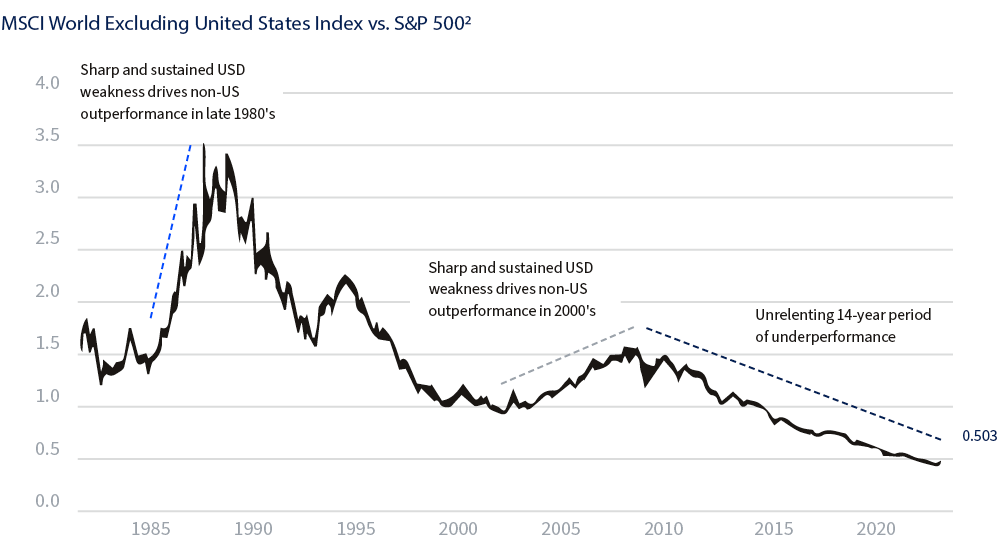
The USD has long played a critical role in the performance of non-U.S. stocks, with periods of USD weakness associated with outperformance of international stocks vs. the U.S. and USD strength associated with underperformance of international stocks vs. the U.S.
The dollar tends to move in big cycles, with large upcycles typically followed by sharp downcycles. Looking at the history of the USD cycles, we can observe that the only periods of sustained, multi-year outperformance of non-U.S. stocks over the U.S. have coincided with large USD bear markets, such as in the late 1980s and 2000s2. Since reaching its peak in late September 2022, the dollar has declined about 10%. However, it remains unclear if we are yet in a period of pronounced and sustained USD weakness, and like the late 1980s and early 2000s, we think rate cuts from the Fed could be an important catalyst for a potential USD bear market.
The notion that non-U.S. equities can benefit from a weaker USD can be explained by foreign consumers around the world having more purchasing power to spend from local consumers overseas and less of a strain on emerging market economies, which in many cases carry substantial external debt denominated in USD. An additional factor observed is the trend of capital flows, which can amplify the moves in non-U.S. markets and create this sort of feedback loop. The more international equities strengthen, the more money flows out of the U.S. and into the rest of the world, which then exacerbates USD weakness and enhances international equity strength.
A weaker USD year-to-date can be explained by the downward pressure from monetary policy. U.S. traders have been pricing in a shift to easier, more accommodative Fed policy in the U.S. while at the same time pricing in the potential for a tighter European Central Bank and even a policy shift from the Bank of Japan. At the margin, if the Fed is incrementally easier than the ECB, BOJ, or other central banks that will further spur a retreat in the USD. To help monitor moves in the USD, an important item we watch is futures positioning, as it’s a contrarian driver for the USD. When traders have been aggressively long (betting on a rise in the USD), we have seen peaks in the USD Index, and when traders have been light/short (betting on a fall in the USD), we have seen troughs preceded by big moves higher in the USD Index. Today, USD futures long positioning is shrinking, reflecting expectations of continued declines in the USD, but has not quite reached the contrarian territory where short positioning could support a move higher.
International Developed Versus U.S.
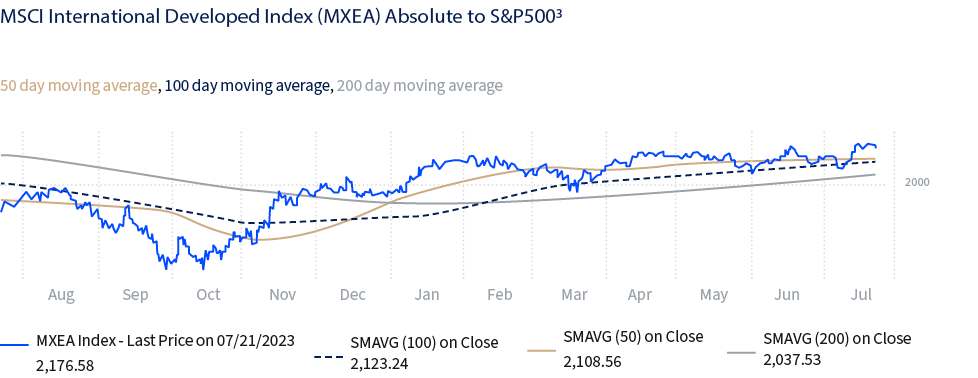
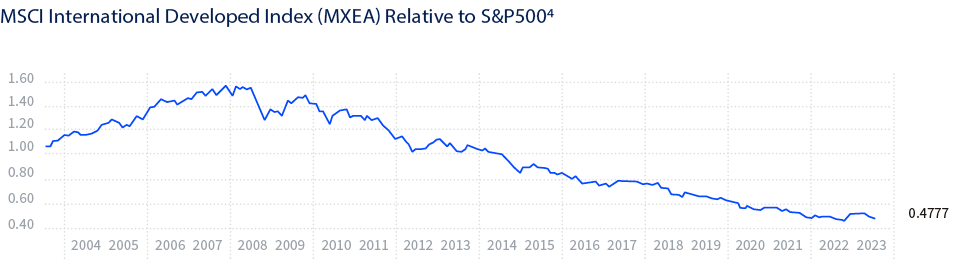
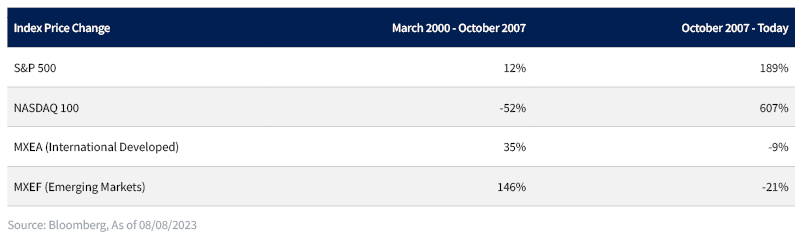
Absolute performance only paints half the picture if we look at the last 15 years of underperformance versus the U.S. If we zoom in more closely and look at the last three quarters, we begin to see some trend improvements on an absolute basis (top chart)3. The International Developed Index (MXEA) rallied sharply off its October lows and continues to trade above its 200-day moving average, posting slightly better performance versus the U.S. S&P 500 over the same period. However, international equities are nowhere near their 2007 highs on an absolute basis and have significantly underperformed U.S. large-cap benchmarks since that time (bottom chart)4.
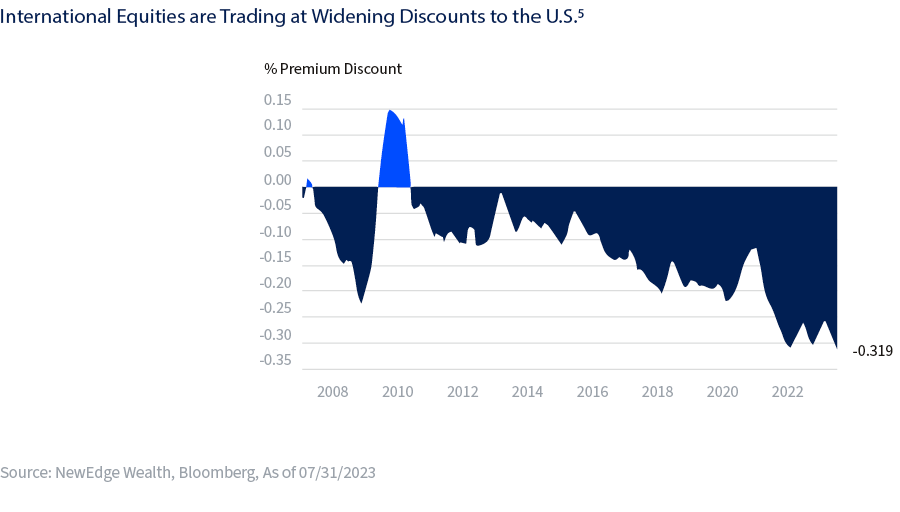
Performance of international equities has been consistently overshadowed by the remarkable success of the U.S. equity market. U.S. equity dominance was fueled by superior earnings growth and historically low interest rates, which led to high valuations for many Growth and technology stocks. However, it’s important to note a key distinction between the composition of U.S. equity markets and developed international. The S&P 500 has a higher concentration of Growth stocks (nearly 27% in technology sectors). In contrast, the MSCI International Developed Index (MXEA) has a greater representation of traditional Value sectors, like financials (18%) and industrials (16%), and only roughly 8% in technology. Unlike Growth, these Value companies are more sensitive to global growth statistics and less sensitive to fluctuations in long-term discount rates, so in a cycle where global growth was a lackluster and long-term interest rates marched lower, valuations on international stocks fell to massive discounts of about 30% to the U.S.5
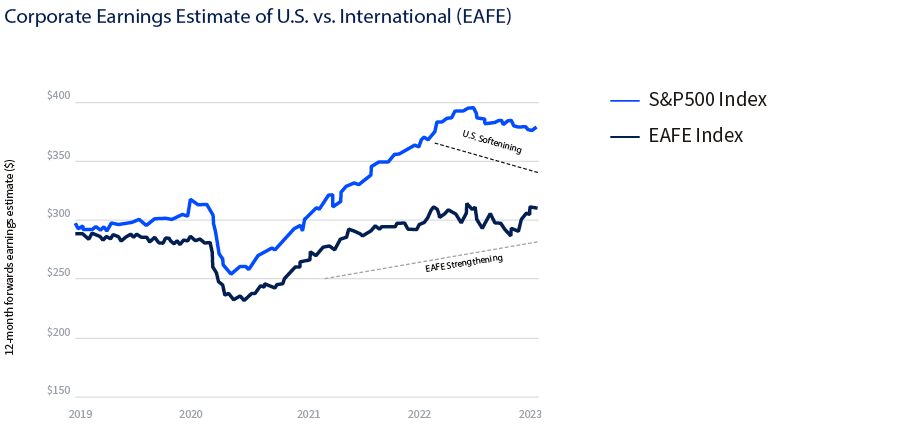
Although appealing, cheaper valuations are not the only driver of relative performance for markets. Since the great financial crisis EAFE Index has been trading at a discount, this discount has been both warranted and unrelenting due to the weak relative earnings growth of international indices. The EAFE Index saw its earnings stagnate since its peak in 2008; EPS has declined from $175/share to $157/share in 2022 (-11%). In comparison, the S&P 500 has seen earnings grow from $100/share to $220/share (+120%) over the same time. This explains why “the cheap got cheaper” as international equities could not keep pace with the healthy growth in the U.S. over the past cycle.
The other important distinction is that part of U.S. equity outperformance from the 2007 pre-Global Financial Crisis (GFC) peak to today was a function of underperformance in the 2000-2007 cycle. Following the tech bubble bursting and boosted by a weak USD, China’s industrialization, and other drivers, non-U.S. stocks significantly outperformed U.S. stocks until the 2007 peak. This non-U.S. outperformance created bubble-like conditions for many emerging markets (unsustainably high valuations and earnings inflated by over-investment), which helps to explain the lost decade and a half of weak performance for emerging markets since the 2007 peak.
Is now the time to give International its chance?
Besides the diversification benefit of owning stocks with different end-market exposures, many investors question the purpose of owning international equities in their portfolios. The reality is that non-U.S. stocks have been effectively dead money for over a decade, unable to make new highs beyond their 2007 peak and underperforming the U.S. significantly. However, as long-term investors, we must continuously assess if the trends of the last 15 years will continue, meaning the U.S. is the dominant equity market by a long shot, or if we will see a rotation in leadership away from the U.S. to other parts of the world.
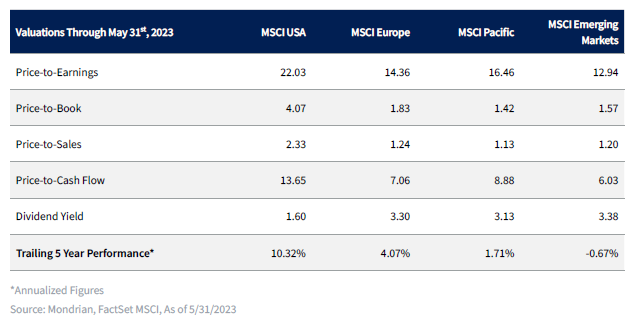
- Absolute and relative valuations continue to be favorable across international equities. As we learned in 2022 (which was a market driven by multiple compression), these lower valuations have made it so that international stocks have “less room to fall” as central banks tighten and put downward pressure on price-to-earnings (P/E) multiples. The table below shows that as of May 31, 2023, the U.S. remains the most expensive market through every valuation metric. Though valuations are not a catalyst for better forward returns, the starting point of lower valuations in non-U.S. equities has helped performance in 2022 and 2023.
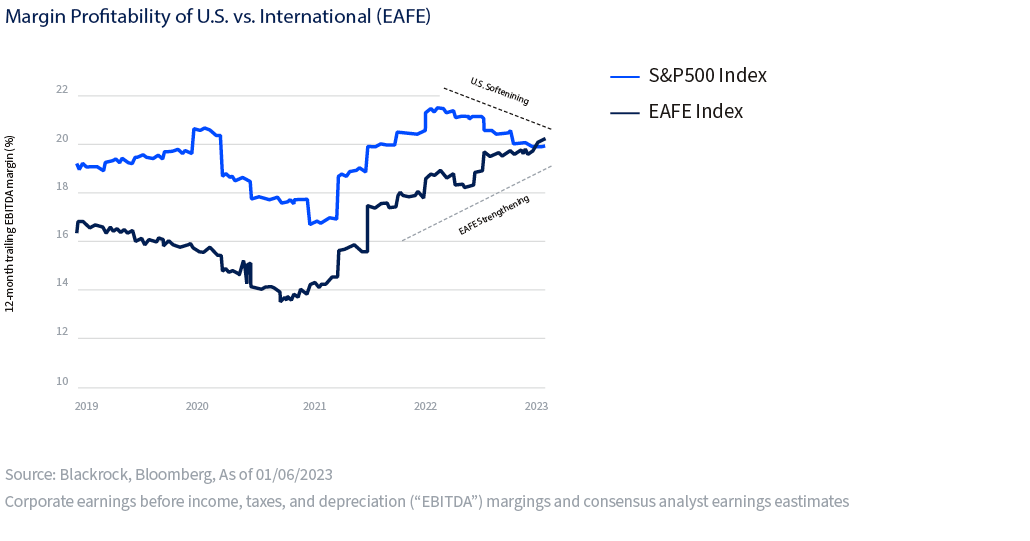
- While there is generally a discount between U.S. equities and those overseas, the narrative has evolved beyond valuations. Earnings Per Share (EPS) estimates have been more resilient in non-U.S. markets. Year-to-date Europe is the only global region with earnings revisions that are not negative. Relative to the U.S., international return-on-equity (ROEs) and margin profitability have been improving. Some of the most prosperous multinational corporations have demonstrated remarkable skills in capitalizing on external revenue streams spanning all over the world. However, selectivity will be important as profit margin pressures and tighter financial conditions may cause performance divergences across industries and sectors.
- Another argument supporting a new era of international outperformance lies in the structural changes within the macroeconomic landscape, favoring precisely the kind of companies found overseas. The past decade has been marked by low inflation and near-zero or negative interest rates. As we look ahead, these inflationary pressures most likely will diminish and we may not necessarily see all the central banks tightening’s be reversed. It’s anticipated that we’re entering a period of sustained higher rates, signaling the end of a free money cycle. With this macroeconomic backdrop, value sectors, such as industrials, financials, materials, and energy, may be favored overgrowth, and market leadership may start to broaden out. Using 2000 – 2007 as an example, which was followed by the great financial crash, both value and international companies outperformed those Growth and U.S. names. International outperformance has usually been associated with value style outperformance, and in a world of regime changes, we could see a shift in potential market leadership.
Current Positioning
In our strategic allocations, we have long been cautious on international and emerging markets, remaining underweight these indices versus the MSCI ACWI (All Country World Index) as we continued to observe the headwinds around earnings, currency, and more that have persistently led to underperformance vs. the U.S.
Last year, we turned slightly more constructive on international and emerging markets compared to our previously cautious stance. At the end of 2022, we took our underweight to international Equities up to neutral in our strategic asset allocations. Though we moved the strategic allocation to neutral, we are also conscious that investing in foreign markets comes with structural challenges such as governance, local economic weakness, debt levels, and much more, all of which likely require a higher degree of selectivity within indices.
Within international, equities we prefer developed over emerging markets. Emerging markets tend to reflect lower quality, riskier exposure, and higher economic sensitivity, which could underperform in a period of weaker global growth. We continue to prioritize high-quality businesses across international developed markets that can benefit from their valuation discount versus their U.S. peers and a weakening USD. Within international (both developed and emerging), a weaker USD is supportive of the asset class and commodity prices. Higher commodity prices tend to benefit non-U.S. indices more than U.S. indices, given the higher non-U.S. weighting to commodity-sensitive sectors like Industrials, Energy, and Materials. Even if meaningful tailwinds emerge, we expect volatility to remain elevated in emerging markets given geopolitical tensions and China uncertainty.
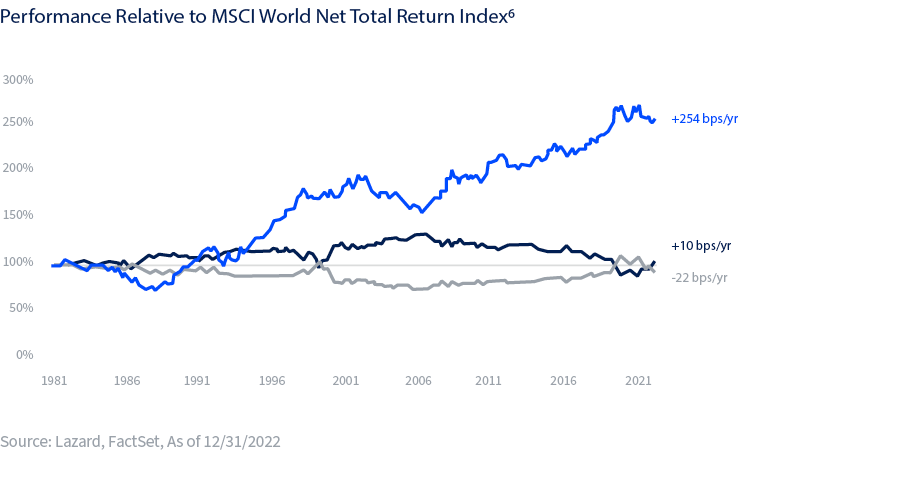
Like U.S. equities, we continue to prioritize quality across the international developed space. In fact, we believe quality may be even more important in non-U.S. investing as it allows long-term investors to stay invested and compound through cycles participating on the upside while protecting on the downside. Data has shown that overtime, quality has outperformed the market with lower levels of volatility6. When evaluating Growth vs. Value within international, we are neutral, balancing elevated valuations for Growth-oriented companies and potential headwinds for cyclical Value companies.
Conclusion
Overall, we characterize our long-term view on non-U.S. equities as “cautious optimism.” As detailed above, non-U.S. indices have been alarming underperformers versus the U.S. over the last cycle. This underperformance has led many investors to “give up” on the asset class, while valuations compared to the U.S. are now at notable discounts. These cheap valuations alone are not enough to drive better performance of non-U.S. stocks, but as we experienced in 2022, lower valuations create less room to fall in weak markets. For upside catalysts, we look to drivers like a weaker USD, monetary policy changes, and improving profitability as a source of better returns for international equities. We think cautious optimism instructs investors to be risk-sensitive and selective when getting exposure to international markets, remaining focused on high-quality companies within the indices.
SOURCES
1 Reuters
2 NewEdge Wealth, Bloomberg
3 NewEdge Wealth, Bloomberg
4 NewEdge Wealth, Bloomberg
6 Lazard
Federal Reserve Bank of New York, JPMorgan Chase & Co, Russell Investments, Mondrian Investment Partners
IMPORTANT DISCLOSURES
The views and opinions included in these materials belong to their author and do not necessarily reflect the views and opinions of NewEdge Capital Group, LLC.
This information is general in nature and has been prepared solely for informational and educational purposes and does not constitute an offer or a recommendation to buy or sell any particular security or to adopt any specific investment strategy.
NewEdge and its affiliates do not render advice on legal, tax and/or tax accounting matters. You should consult your personal tax and/or legal advisor to learn about any potential tax or other implications that may result from acting on a particular recommendation.
The trademarks and service marks contained herein are the property of their respective owners. Unless otherwise specifically indicated, all information with respect to any third party not affiliated with NewEdge has been provided by, and is the sole responsibility of, such third party and has not been independently verified by NewEdge, its affiliates or any other independent third party. No representation is given with respect to its accuracy or completeness, and such information and opinions may change without notice.
Investing involves risk, including possible loss of principal. Past performance is no guarantee of future results.
Any forward-looking statements or forecasts are based on assumptions and actual results are expected to vary from any such statements or forecasts. No assurance can be given that investment objectives or target returns will be achieved. Future returns may be higher or lower than the estimates presented herein.
An investment cannot be made directly in an index. Indices are unmanaged and have no fees or expenses. You can obtain information about many indices online at a variety of sources including: https://www.sec.gov/answers/indices.htm.
All data is subject to change without notice.
© 2026 NewEdge Capital Group, LLC

