


I’m a shooting star leaping through the sky like a tiger
Defying the laws of gravity
I’m a racing car passing by like Lady Godiva
I’m gonna go, go, go, there’s no stopping me
“Don’t Stop Me Now” – Queen
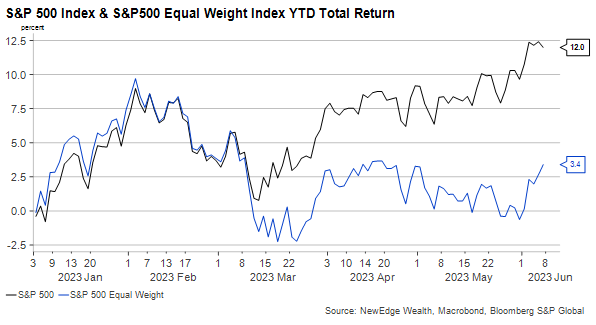
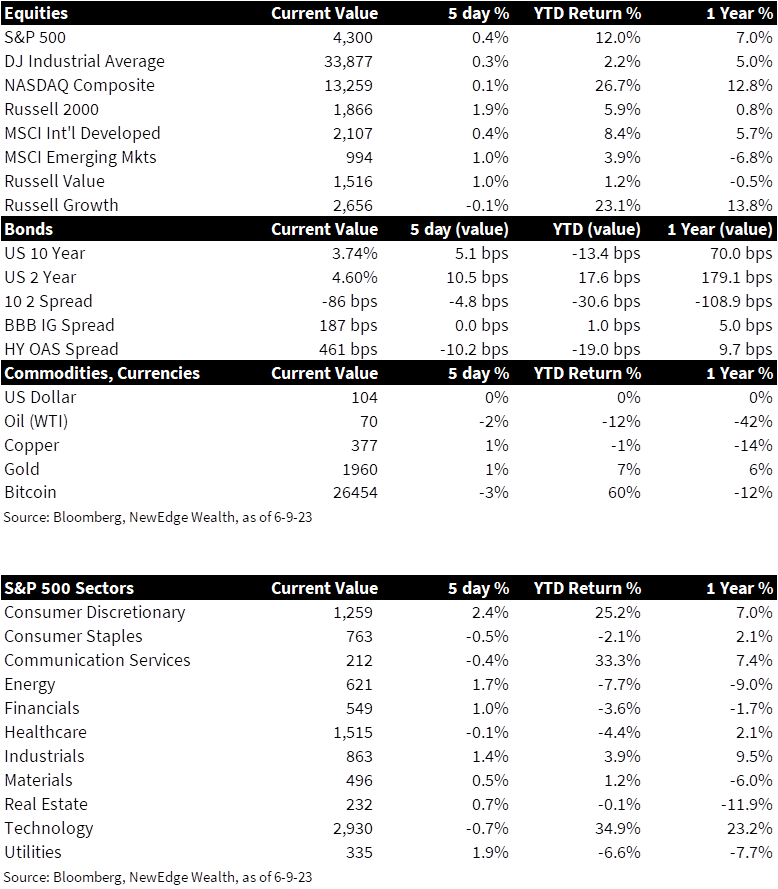
This week we are taking stock of the year-to-date performance of the U.S. equity market, which could be adequately summarized by Queen’s 1979 song, “Don’t Stop Me Now”, especially in the context of the recent 11% surge from the mid-March lows. As of June 8th, the S&P500 Index total year-to-date return stood at 12%, seemingly defying the laws of gravity amidst the downward pull of recessionary fears, tightening monetary policy and continued pressures on profit margins.
While this index level performance suggests a market that seems immune to macro headwinds, dissecting the returns tells a much different story. In fact, the seven largest index constituents (Apple, Microsoft, Amazon, Nvidia, Alphabet, Berkshire Hathaway, and Tesla) have returned an average of 60% year-to-date, accounting for nearly all of the S&P500 index returns, while the remaining 493 companies in the index have returned an average of 0%. Going one step further, three companies that are viewed as the leading beneficiaries of the AI revolution (Nvidia, Alphabet, and Microsoft) have returned an average of 79% year-to-date, and combined these three companies account for over 90% of the S&P500 index return according to Goldman Sachs.
While a handful of companies are feeling like Mr. Fahrenheit and seemingly moving at the speed of light this year, the rest of the market is clearly telling a different story, with performance reflecting the ongoing headwinds of slowing economic activity, margin pressures, and rising costs of capital. In aggregate only 56% of companies in the index have generated positive performance this year according to Bloomberg, and if we equal weight the S&P500 constituents the total return amounts to just 3.4%. A recent J.P. Morgan report also notes that 2023 has thus far produced the narrowest market leadership in over 20 years, while measures of market breath are among the weakest on record.
The narrow concentration of index returns this year could be explained by several factors, notably the more defensive characteristics of large cap companies relative to small caps, the more sustainable revenue growth of technology companies, and the inherent pricing power and competitive advantages concentrated among a handful of industry leaders. Narrowing leadership is also indicative of a slowing economic cycle and likely reflects the expectations of a recession in the next 12 months, which currently stand at a 60% probability according to Bloomberg.
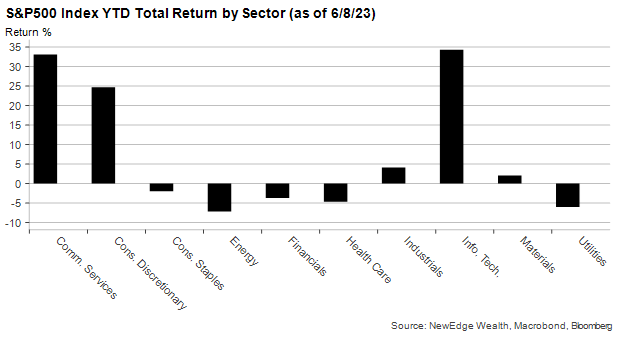
The returns of the individual S&P500 sectors this year also illustrate concerns about an economic deceleration, as more economically sensitive sectors like materials, energy, and financials are among the notable laggards, while sectors that are generally more services oriented like technology, communications, and consumer discretionary have led. The technology sector, which offers investors a combination of sustainable and more globally diversified revenue growth, has been the top performer this year, rising 33%, which is the best start to the year for the sector on record using data going back over 30 years.
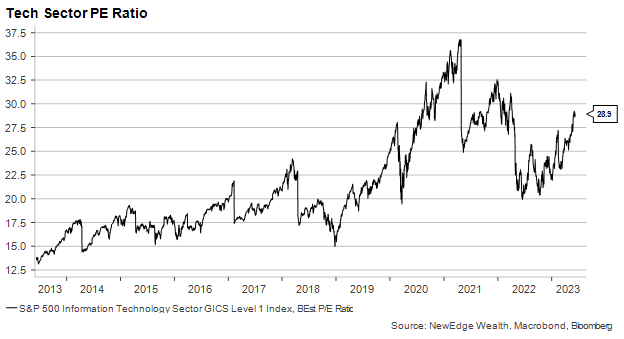
Returns for the technology sector have been almost entirely driven by multiple expansion however, which has pushed the sector’s valuation to over 28x next year’s earnings. This valuation now exceeds pre-Covid peak levels and represents a 30% premium to the 10-year average. While mega cap technology companies like Apple and Microsoft and Nvidia have certainly contributed to elevated valuations, with average multiple expansion of 40% this year, the remainder of the sector measured by the equal weight technology index has contributed as well, as multiples in this index have expanded by 24%, and are now at a 25% premium to the 10-year average.
With elevated valuations across most industries, the ability to generate earnings growth to justify these valuations will become even more paramount for the remainder of this year and in the years to come. While we are nearing a potential trough in the earnings cycle, we are not quite out of the woods yet. Current second quarter earnings expectations call for a -7.3% decline year-over-year, which would represent the third consecutive quarterly decline in earnings growth. Seven of eleven S&P500 sectors are expected to post year-over-year declines in earnings, with the largest declines expected in the energy and materials sectors. The communications services sector is the only sector expected to post healthy earnings growth, currently at 12% year-over-year.
Turning to top line growth, current expectations call for just 0.3% revenue growth year-over-year, which represents the lowest quarterly revenue growth rate since Q3 2020, and a substantial decline from the first quarter revenue growth of 5.3% year-over-year. Stalling revenue growth is in part due to tough year-over-year comparisons, as revenues were up 13% in Q2 of 2022, but also reflects softening demand and weaker pricing power as consumers have grown weary of elevated prices. On the bright side this quarter may represent the ultimate trough in the S&P500 earnings cycle as expectations for subsequent quarters indicate a gradual return to mid-single digit top and bottom-line growth, driven by easing year-over-year comparisons
Finally, this week we wanted to provide some high-level thoughts around artificial intelligence (AI) and its potential impact on corporate earnings power. In attempting to define AI and its impact on the global economy, we decided a fitting way would be to let AI answer for itself, and ChatGPT provided the below response:
“AI and large language models (LLMs) will change the world economy by automating tasks and making businesses more efficient by reducing costs and boosting productivity. AI can help in training people for new types of work by providing customized, efficient learning. AI doesn’t just take over tasks – it can help humans to do their jobs better. In healthcare, AI can analyze a lot of data to help doctors make decisions. In creative fields, AI can do the routine tasks, leaving people free to do the more interesting work. While it’s true some jobs may be automated, new ones will be created, possibly leading to more jobs overall. So, with the right focus on education and training, AI can help move the workforce into the digital age, make businesses more productive, and create new types of jobs.”
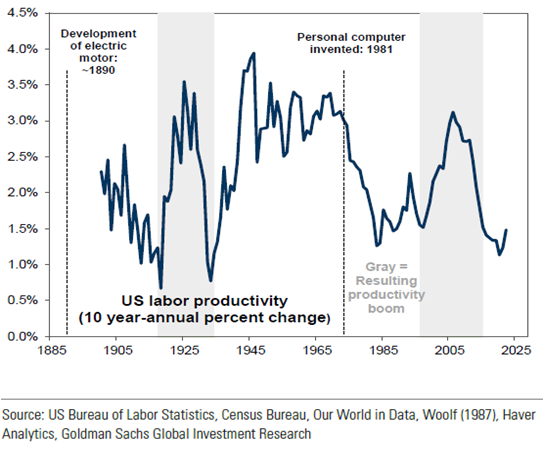
In our view, aspects of AI will contribute to overall productivity levels and boost corporate profits in the years to come, however uncertainty around the timing and pace of adoption across industries makes it challenging to quantify. In their base case scenario, Goldman Sachs estimates it may take 10 years for AI to be fully adopted, but the resulting productivity boom could amount to a boost of 1.5% annually to U.S. labor force productivity over the subsequent 10 years. This represents a doubling of current productivity levels and is similar to the boom that followed the development of the electric motor in the late 1800s and the personal computer in the 1980s. This potential productivity boom could boost annual GDP growth by 1.1% over the subsequent 10-year period, and in Goldman’s base case scenario, this would add 0.5% to the overall S&P500 CAGR of earnings per share over the next 20 years.
US Labor Force Productivity & Technological Milestones
While momentum and exuberance around the potential long-term benefits of AI on corporate revenue growth and profitability justifies some of the valuation expansion we have experienced this year, the timing of its eventual impact remains difficult to predict. Given this uncertainty and combined with elevated valuations in growth stocks and risks of an economic contraction to cyclical stocks, we continue to recommend investors maintain a balanced approach to U.S. equities. In short, in today’s environment we are favoring the center of the fairway, remaining diversified while prioritizing high quality companies that can offer reduced economic and earnings sensitivity, resilient profit margins, attractive relative valuations, and elevated levels of free cash flow.
Top Points of the Week
By Ben Lope
1. Equities – Small caps and value-oriented indices took the lead for US equities this week, while growth and tech-oriented indices surrendered their recent run of market leadership but still notched slight gains. International equities were mostly higher and were led by Latin America, Chinese, and Emerging Markets indices.
2. VIX lowers to pre-pandemic levels – The VIX, a measure of stock market volatility sometimes referred to as the “fear index,” dropped below 14 for the first time since February 2020. The VIX’s move ~50% off its year-to-date highs recorded in March coincides with an equity market rally that has the S&P 500 ~20% higher than its October 2022 lows, prompting many pronouncements that equities have entered a new bull market.
3. Yields – Despite yields beginning the week with a movement lower as the bond market absorbed weaker than expected initial jobless claims data, yields ended the week at similar levels to where they began. The yield curve measured by the spread between 2-Year and 10-Year yields became slightly less inverted, but remains in the 80-85bps range ahead of next week’s FOMC meeting.
4. Saudi Arabia cuts oil production – In a move that surprised many commodity investors, Saudi Arabia decided on Sunday to cut their oil production by one million barrels per day. Other OPEC+ members kept their production levels unchanged. Despite Saud Arabia’s position as the world’s top oil exporter, the kingdom’s decision to cut production had little effect on oil prices, which ended the week only slightly lower.
5. ISM May Services PMI disappoints but remains expansionary – The Institute for Supply Management released May Services PMI figures on Monday that came in lower than expected and sent interest rates lower to start the week. Analysts expected a reading of 51.8, but the actual reading came in at 50.3, just above the 50 mark that separates expansion from contraction. One positive that came from the ISM’s report was a notable monthly drop in the Prices Paid Index, which, if durable, bodes well for the Fed’s battle against inflation.
6. Weekly jobless claims highest since October 2021 – US weekly jobless claims totaled 261,000 last week, an uptick of 28,000 from the previous week and well above consensus expectations for 235,000 initial claims. Weekly claims have not been this high since October 2021; however, economists have noted that the week covered by this release includes Memorial Day, which is a seasonal factor that could warp the reading relative to more standard weeks. Stronger than expected employment data throughout the Fed’s tightening cycle has contributed to a serial repricing of eventual rate cuts farther and farther into the future.
7. US Treasury expected to ramp up debt issuance – Following the resolution of the debt ceiling debacle, the Treasury plans on issuing government debt to replenish the Treasury General Account it was forced to spend down during legislative negotiations. The issuance of government debt effectively takes money out of the economy, reducing financial market liquidity. The impact of heightened bond issuance on overall yields will largely be determined by actions of money market funds, which could absorb much of the new debt issuance by shifting their allocations away from the Fed’s reverse repo facility. However, demand from money market funds is no guarantee, particularly if the Fed continues hiking rates, the target range of which uses the rate on reserve repos as a floor.
8. China’s May Export figures much lower than expected – Export data released by China showed that May exports decreased by 7.5% year-over-year, notching a significantly worse reading than economist expectations of a 0.4% decline. May’s disappointing reading reverses the 8.5% increase in exports recorded in April and further adds to recent negative economic readings for China, namely the second straight month of manufacturing contraction that was announced last week.
9. Canadian and Australian central banks enact surprise rate hikes – The central banks of Canada and Australia both surprised markets this week by hiking key interest rates. The Reserve Bank of Australia’s second consecutive hike comes amid stubborn inflation that has caused the bank to take a more hawkish stance than April’s pause suggested. In January the Bank of Canada became the first developed market central bank to announce a pause in rate hikes. The reversal in their policy course and the stubbornness of global inflation has called into question how long a potential pause by the US Federal Reserve could be sustained.
10. Fed expected to pause hikes at next week’s meeting – The most important event occurring next week is the FOMC meeting, for which the fixed income market has assigned a near 70% probability that the Fed will temporarily pause rate hikes before resuming with a 25bps hike in July. Outside of the Fed’s two-day meeting that begins on Tuesday, important economic announcements include Tuesday’s release of May CPI figures, PPI figures released on Wednesday, retail sales, manufacturing, and trade data on Thursday, and consumer sentiment figures on Friday.
IMPORTANT DISCLOSURES
Abbreviations: AI: artificial intelligence; CAGR: compound annual growth rate; CPI: Consumer Price Index; FOMC: Federal Open Market Committee; OPEC+: a group of 23 oil-exporting countries which meets regularly to decide how much crude oil to sell on the world market; PPI: Producer Price Index; Treasury General Account (TGA): Treausry’s cash balance held at the Fed.
Index Information: All returns represent total return for stated period. S&P 500 is a total return index that reflects both changes in the prices of stocks in the S&P 500 Index as well as the reinvestment of the dividend income from its underlying stocks. Dow Jones Industrial Average (DJ Industrial Average) is a price-weighted average of 30 actively traded blue-chip stocks trading New York Stock Exchange and Nasdaq. The NASDAQ Composite Index measures all NASDAQ domestic and international based common type stocks listed on the Nasdaq Stock Market. Russell 2000 is an index that measures the performance of the small-cap segment of the U.S. equity universe. MSCI International Developed measures equity market performance of large, developed markets not including the U.S. MSCI Emerging Markets (MSCI Emerging Mkts) measures equity market performance of emerging markets. Russell 1000 Growth Index measures the performance of the large- cap growth segment of the US equity universe. It includes those Russell 1000 companies with relatively higher price-to-book ratios, higher I/B/E/S forecast medium term (2 year) growth and higher sales per share historical growth (5 years). The Russell 1000 Value Index measures the performance of the large cap value segment of the US equity universe. It includes those Russell 1000 companies with relatively lower price-to-book ratios, lower I/B/E/S forecast medium term (2 year) growth and lower sales per share historical growth (5 years). The BBB IG Spread is the Bloomberg Baa Corporate Index that measures the spread of BBB/Baa U.S. corporate bond yields over Treasuries. The HY OAS is the High Yield Option Adjusted Spread index measuring the spread of high yield bonds over Treasuries. VIX is the ticker symbol for the Chicago Board Options Exchange’s CBOE Volatility Index, a popular measure of the stock market’s expectation of volatility based on S&P 500 index options. ISM manufacturing prices paid is a diffusion index of ISM Manufacturing PMI calculated by adding the percent of responses indicating they paid more for inputs plus one-half of those responding that they paid the same for inputs. The Services ISM Report on Business is based on data compiled from purchasing and supply executives nationwide. Membership of the Services Business Survey is diversified by NAICS, based on each industry’s contribution to gross domestic product (GDP).
Sector Returns: Sectors are based on the GICS methodology. Returns are cumulative total return for stated period, including reinvestment of dividends.
The views and opinions included in these materials belong to their author and do not necessarily reflect the views and opinions of NewEdge Capital Group, LLC.
This information is general in nature and has been prepared solely for informational and educational purposes and does not constitute an offer or a recommendation to buy or sell any particular security or to adopt any specific investment strategy.
NewEdge and its affiliates do not render advice on legal, tax and/or tax accounting matters. You should consult your personal tax and/or legal advisor to learn about any potential tax or other implications that may result from acting on a particular recommendation.
The trademarks and service marks contained herein are the property of their respective owners. Unless otherwise specifically indicated, all information with respect to any third party not affiliated with NewEdge has been provided by, and is the sole responsibility of, such third party and has not been independently verified by NewEdge, its affiliates or any other independent third party. No representation is given with respect to its accuracy or completeness, and such information and opinions may change without notice.
Investing involves risk, including possible loss of principal. Past performance is no guarantee of future results.
Any forward-looking statements or forecasts are based on assumptions and actual results are expected to vary from any such statements or forecasts. No assurance can be given that investment objectives or target returns will be achieved. Future returns may be higher or lower than the estimates presented herein.
An investment cannot be made directly in an index. Indices are unmanaged and have no fees or expenses. You can obtain information about many indices online at a variety of sources including: https://www.sec.gov/answers/indices.htm.
All data is subject to change without notice.
© 2026 NewEdge Capital Group, LLC
