


You do what you do, you say what you say
You try to be everything to everyone
You know all the right people
You play all the right games
“Everything to Everyone”, Everclear
Just as you would have had to live under a rock in the late-1990s to miss Everclear’s epic run of catchy alt-rock hits, you would have to be living under a rock today to miss the AI Capex theme and its beyond epic run of earnings growth and price returns.
Though our favorite Everclear song might be “Santa Monica” (who isn’t occasionally “lonely and dreaming of the west coast”?), “Everything to Everyone” is the Everclear hit that captures just how powerful the AI Capex theme has become for equity markets, bond markets, and economies around the globe.
This AI Capex theme is not just driving the returns of indices you would most expect, like the Russell 1000 Growth Index or the Nasdaq, but it has now become a dominant driver of indices that you might not expect, such as the Russell 1000 Value, the Dow Jones Industrial Average, and the MSCI Emerging Markets Index.
This week’s Weekly Edge will begin by defining the major buckets of the AI trade, then looking at how this “Everything to Everyone” AI infrastructure trade has become pervasive throughout major global indices. We will also check in on the S&P 500’s poor breadth and how the index’s profitability has been driven by the unprecedented surge in semiconductor margins.
“Yeah, You Jump Through The Big Hoop”: Defining the AI Trade
Before we show the proliferation of this theme into other indices, it is worth defining the AI trade into its major components so we can speak clearly about the theme’s impact. There are two main buckets: those doing the spending on AI Capex and those receiving the Capex dollars to build out the AI infrastructure.
• AI Capex Spenders: The companies that are using their balance sheets (cash and increasingly debt) in order to build out AI computing capacity. These are primarily the Magnificent 7 hyperscaler companies that are building data centers to run AI processes for themselves and for others. These are the companies that have seen their free cash flow generation plummet due to the heavy Capex spending. These companies are buying equipment and services from the AI Capex Recipients. Companies include names like GOOG/GOOGL, MSFT, AMZN, META, and ORCL.
• AI Capex Recipients: The companies that are receiving the Capex dollars from the hyperscalers by providing the components needed to build out high-capacity AI data centers, including components like semiconductors, networking equipment, HVAC cooling equipment, electrical equipment, and the power generation capacity needed to keep all the machines whirring. These companies have seen their free cash flow generation soar thanks to a huge jump in revenues from the unprecedented demand from the Capex spenders. As mentioned above, there are many different components of the AI Capex trade, including the direct technology equipment, semiconductors/memory/tech hardware companies (e.g., NVDA, AVGO, MU, SNDK, CSCO) and the non-tech AI infrastructure companies (e.g., CAT, ETN, VRT).
• Semiconductors: Semis have become the largest industry group in the S&P 500 at an 18.4% weight, more than double the peak weight in 2000 and up from just a 2% weight in 2014. The US equity market has never been more exposed to the path of semiconductor stock returns.
• Non-Tech AI Infrastructure: Renmac estimates that this second cohort of non-tech AI infrastructure companies makes up $2 trillion of S&P 500 market cap with direct exposure/high correlation to AI Capex.
“You Know All the Right People”: The AI Trade is Everywhere
With the definition of the AI-trade set, with both capex spenders and recipients, we can now look into indices to see just how powerful and pervasive this AI Capex theme has become in most major indices.
• Dow Jones Industrial Average: Caterpillar (CAT), the industrial sector darling of the AI trade thanks to its gas-powered Solar Turbine business, is the second largest weight in the index at 11.3%.
• Russell 1000 Value Index: Alphabet (GOOG/GOOGL) is the largest weight in the index at 4.5%, while Micron (MU) is the third largest weight at 2.6% and Amazon is the fifth largest at 2.1%. Other names like Intel (INTC), Cisco (CSCO), and Caterpillar (CAT) add another 4% in total. Looking at returns in 2026, the top 10 AI-related stocks in this index have generated 61% of the index’s return this year.
• Russell 2500 SMID Cap Index: The largest weight in the index is Sandisk (SNDK) at a 2.5% weight. SNDK has quickly gone from a market cap of $34B to over $200B in 2026, making it the 62nd largest stock in the Russell 1000 and far too big to be included in the Russell 2500 (the 2500 smallest stocks in the market) going forward (the Russell rebalance is scheduled for June 26, with changes announced May 22). The top 10 contributors to Russell 2500 performance are all AI infrastructure beneficiaries, accounting for 31% of the total return of the index YTD (these names are up an average of 105% over the past 6 weeks!).
• MSCI Emerging Markets Index: Three semiconductor stocks (Taiwan Semiconductor Manufacturing, SK Hynix, and Samsung) account for 24% of the emerging markets index. For those that have been excited about strong EM outperformance as a sign of robust global growth or a cyclical reacceleration, the chart from Alpine Macro below shows how all of the gains in the index since in the end of 2025 are thanks to these three AI-driven stocks.
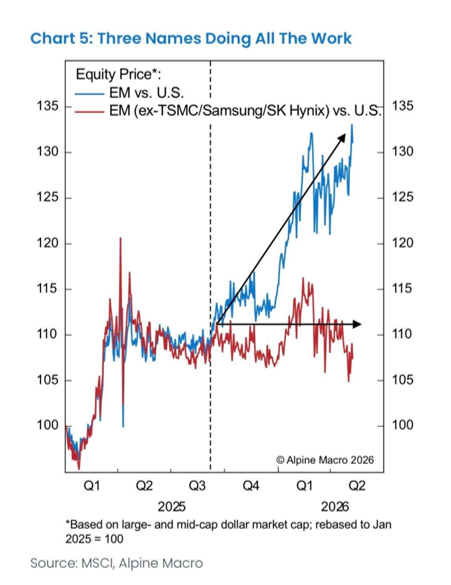
As of 5-14-26
We must note that even though the presence of these AI trades in less-expected indices is eyebrow-raising, the degree of concentration in the Growth and Nasdaq 100 in the AI trade is far more significant.
• Russell 1000 Growth: 9 of the top 10 names are Mag 7/AI names, accounting for 60% of the index in just these top names (the broader AI weight is even larger). NVDA is the largest weight at a whopping 15%.
• Nasdaq 100: all of the top 10 names in the Nasdaq 100 are Mag 7/AI names, making up 60% of the index.
Source: Bloomberg, NewEdge Wealth, as of 5-15-26
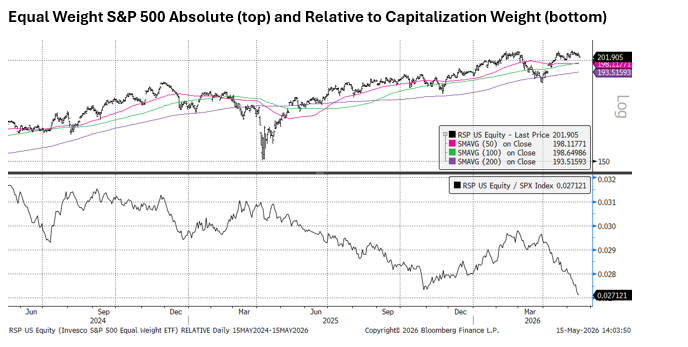
The S&P 500’s breadth, or ways to measure how many stocks are participating in the rally, has been anemic at best over the last 6 weeks due to the powerful but concentrated gains in this AI Capex theme.
Chris Verrone of Strategas flagged on Friday that just 52% of stocks are in an uptrend in the S&P 500, despite the all-time highs, but noted that it could get worse: at the peak in 2000 (which subsequently took 14 years to overtake), just 27% of stocks were in an uptrend.
“The Hand You Hold is The Hand That Holds You Down”: Semiconductors and Margins
We also must note how powerful the AI Capex trend has become for overall S&P 500 profitability statistics and how if/when these margins normalize, we could see downward pressure on the index’s margins even if AI productivity begins to benefit broader margins.
The chart below compares the operating margins for the S&P 500, the Equal Weight S&P 500, and the SOX Semiconductor Index.
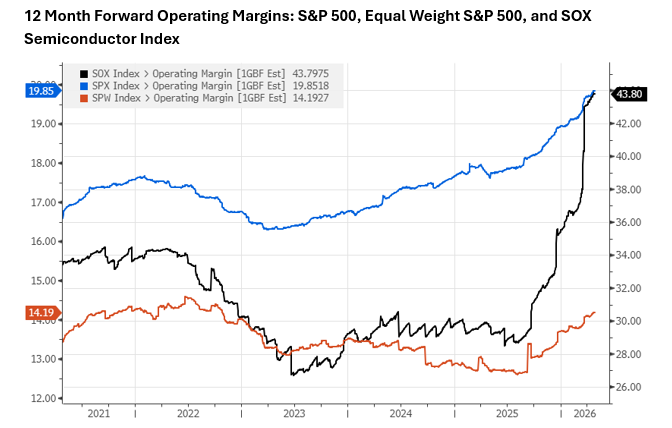
Source: Bloomberg, NewEdge Wealth, as of 5-15-26
The new record margins for the S&P 500 are not being enjoyed by the Equal Weight Index, which still has margins below its 2022 peak. The reason for the margin expansion in the capitalization weighted index is thanks to truly unprecedented margin expansion for the Semiconductor industry group (remember it is the largest weighted group at 18.4%), which has seen its 12-month forward margin surge to 44% from ~30% in the last 9 months. Note this surge in semiconductor margins is not because of AI productivity; it is simply huge operating leverage from surging sales growth. This is why we have been arguing that we are not in a productivity boom, but an operating leverage boom.
Semiconductors have a long history of mean-reverting margins, and though there is likely some structural margin expansion that persists even as the cycle eventually slows (thanks to more capital-light business models), it is reasonable to assume that margins will eventually see downward pressure as sales growth naturally moderates.
“Yeah, You Do it Again”: AI’s Impact on GDP
At the start of this piece, we also mentioned AI Capex’s impact on the economy, so we must note how 1Q26 GDP showed how tech spending contributed as much to GDP growth as the entirety of the US consumer. Importantly, the chart below shows a narrower definition of tech spending, but when you include activities like data center construction, the contribution to overall growth is estimated to reach as high as 1.6% (of the total 2.0% GDP growth in the quarter).
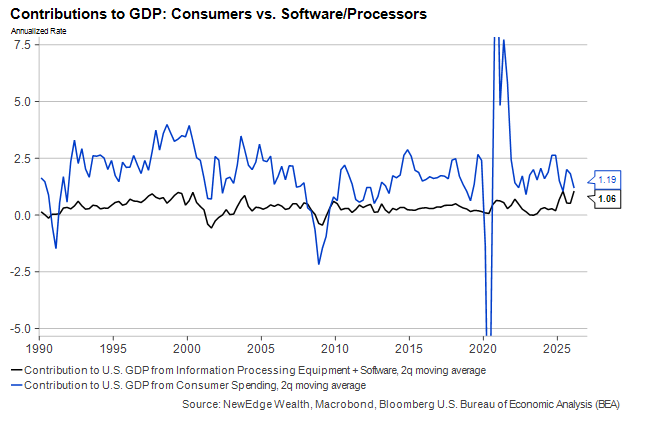
As of 5-15-26
“I Say They Taught You How to Buy and Sell”: Conclusion
The point of this analysis is not to argue that the AI Capex trade is over (though these very overbought semiconductor stocks experienced outsized volatility during Friday’s risk-off move, which is not at all surprising given the rapidity of the advance).
Instead, the goal is to highlight how thoughtful investors who may be looking to diversify exposure away from this one theme may struggle to do so by using non-Growth indices, like Value, SMID cap, and Emerging Markets, that have themselves become dominated by this powerful AI Capex theme. Further, this analysis highlights just how impactful the AI Capex surge has been to measures like US GDP and overall S&P 500 margins.
Of course, we will continue to have to monitor the durability of AI Capex spending growth (given the plummeting free cash flow generation of those doing the spending) and the durability of AI Capex beneficiary profitability to determine when this currently beneficial “Everything to Everyone” AI Capex theme may become a challenge for markets and the economy.
IMPORTANT DISCLOSURES
The views and opinions included in these materials belong to their author and do not necessarily reflect the views and opinions of NewEdge Capital Group, LLC.
This information is general in nature and has been prepared solely for informational and educational purposes and does not constitute an offer or a recommendation to buy or sell any particular security or to adopt any specific investment strategy.
NewEdge and its affiliates do not render advice on legal, tax and/or tax accounting matters. You should consult your personal tax and/or legal advisor to learn about any potential tax or other implications that may result from acting on a particular recommendation.
The trademarks and service marks contained herein are the property of their respective owners. Unless otherwise specifically indicated, all information with respect to any third party not affiliated with NewEdge has been provided by, and is the sole responsibility of, such third party and has not been independently verified by NewEdge, its affiliates or any other independent third party. No representation is given with respect to its accuracy or completeness, and such information and opinions may change without notice.
Investing involves risk, including possible loss of principal. Past performance is no guarantee of future results.
Any forward-looking statements or forecasts are based on assumptions and actual results are expected to vary from any such statements or forecasts. No assurance can be given that investment objectives or target returns will be achieved. Future returns may be higher or lower than the estimates presented herein.
An investment cannot be made directly in an index. Indices are unmanaged and have no fees or expenses. You can obtain information about many indices online at a variety of sources including: https://www.sec.gov/answers/indices.htm.
All data is subject to change without notice.
© 2026 NewEdge Capital Group, LLC
