
Click Here to Listen to the Audio Version
If I could be who you wanted, all the time…
“Fake Plastic Trees”, Radiohead
One of the most devastatingly pining lyrics in 90’s alt music is the last utterances in Radiohead’s 1995 “Fake Plastic Trees”, where a worn out Thom Yorke wilts: “If I could be who you wanted, all the time…” (it is so devastating that 1995’s Clueless has Cher react in disgust to the song saying, “Yuck! The maudlin music of the university station. Wah, wah, wah.”).
But to be desired, to be cherished, to be wanted and have that pining go unfulfilled is not just a sentiment for those listening to Radiohead in a dark room this Valentine’s Day, but it is how large portions of this market have likely felt in recent years, at least until the start of 2026.
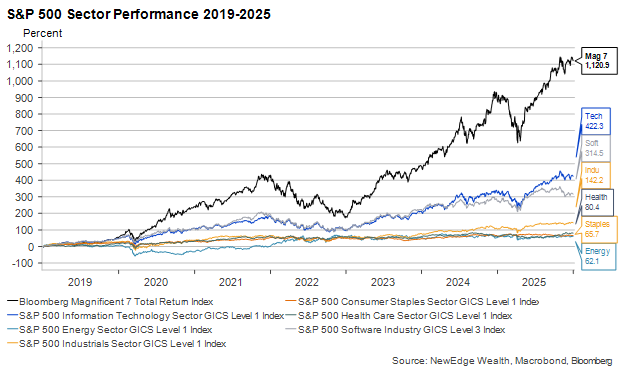
The chart below shows the degree of unrequited love that everything but the Magnificent 7 and the technology sector experienced from 2019-2025 (we choose 2019 because it was after the “Powell Pivot” of late 2018 that saw a drop in real yields that sparked a massive re-rating in Growth stocks). Over that six-year period, the Magnificent 7 outperformed non-tech sectors by over 1000%!
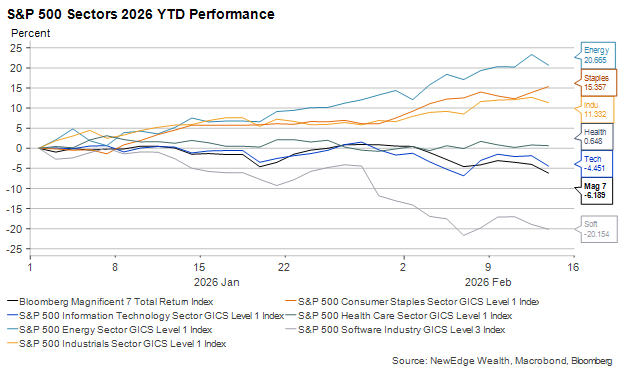
But this “Lonely Hearts Club” for non-tech sectors has disbanded to start 2026, with huge outperformance by non-tech sectors and huge underperformance by tech areas (the broad tech sector, Mag 7, and, most painfully, software). The chart below shows how the best performing sector, Energy, is outperforming the Mag 7 by 27% and the software industry by 40% YTD!
Dmaj9/F#: Happy and Sad
The questions that this YTD rotational performance raises (and what Radiohead listeners often find themselves asking as well) are: What does this mean? What message does this send?
The message is clear, though panicked and feverish, about AI-disruption hitting software and the growing list of disrupted industries (data providers, legal services wealth management, truck brokerage, and more). Each trading day looks like the popular meme of the grim reaper knocking on doors.
But how do we interpret coincident rallies in risk-on, pro-cyclical areas like Industrials, Materials and Energy, while also seeing rallies is prototypical risk-off, defensive areas like Consumer Staples? Is the market sending a message about growth acceleration (the most popular narrative currently)? Or is the market sending a message about consumer spending and growth fears (a development that would be unwelcome for risk assets)?
This cyclical and defensive dual rally makes Radiohead’s “Fake Plastic Trees” even more appropriate for this Weekly’s assessment, as the song contains a “mysterious, ambiguous” chord, as delightfully described and illustrated by David Chisolm. The song’s D major 9 with an F# (Dmaj9/F#) sounds like both a major and a minor chord, or as Chisolm puts it, “it sounds both happy and sad”, just like the leadership of markets in 2026.
“A Cracked Polystyrene Man”: Positioning Drivers
In making sense of this happy and sad mix of discordant leadership in equity markets, it is right to be wary of ascribing too much narrative to price action (remembering what Le Shrub would say, “Once you realize it’s nonsense, it makes sense.”).
Notably, this is likely the same advice Thom Yorke would give to Radiohead interpreters, such as how he described the “Fake Plastic Trees” lyrics saying, “I wrote those words and laughed. I thought they were really funny, especially that bit about polystyrene.”
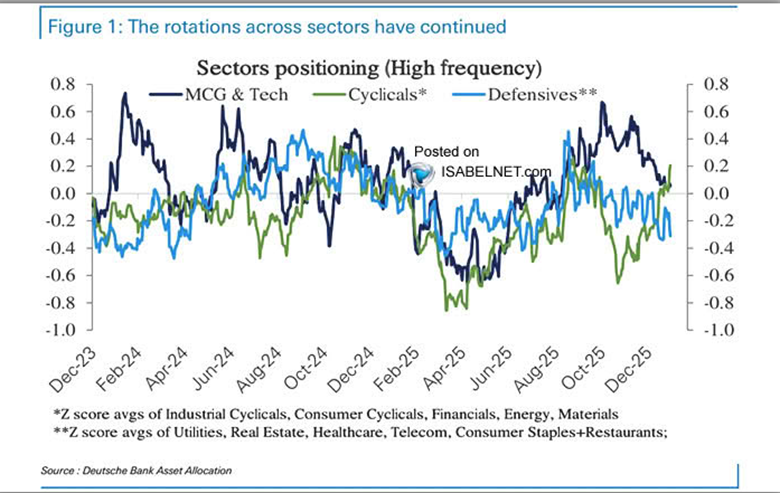
By cautioning that we should not ascribe too much narrative to price action, we are arguing that positioning has played a large role in driving the price performance of sectors recently, and the narratives (i.e., “cyclical reacceleration”) have simply followed. The chart from Deutsche Bank below shows how there has been a massive positioning component to recent rotations. At the peak of the Tech/Growth/Mag 7 trade back in October 2025, the market was max overweight these darling areas and max underweight Cyclicals (including Industrials, Materials, Energy, and more).
“I Could Blow Through the Ceiling”: Contrasting Staples and Energy
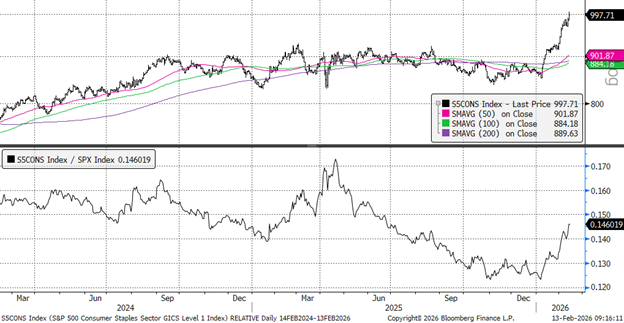
This argument that these shifts have been largely positioning can be seen by noting the similarities in the charts for the Consumer Staples and Energy sectors, two sectors that have been weak absolute and relative performers in recent years but have soared higher (“blown through the ceiling”) to start 2026.
S&P 500 Energy Sector Absolute and Relative
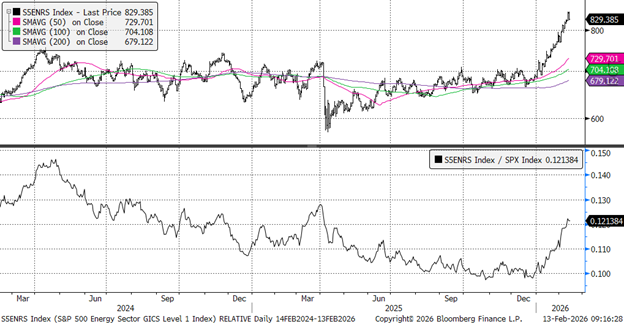
S&P 500 Energy Sector Absolute and Relative
The narrative that is accompanying this rapid rise in Staples and Energy shares is that traders are looking for shelter in what cannot be disrupted by AI. The argument goes that there is safety from AI in the “real economy” versus the disrupt-able “services economy”. It should be noted, then, that the U.S. economy and job market is estimated to be 70-80% driven by services (of course, not all susceptible to AI’s scythe), which is likely why this article from Matt Shumer caused such a stir this week (80M views and counting), as it hit home with 80% of U.S. workers.
But we cannot ignore the positioning, “the last shall be first” nature of this rotation, where the two worst performers from 2019-2025 have become the two best to start 2026.
The question is whether these rotations are the start of a bigger tectonic shift, or just an ephemeral countertrend move where underperformance and positioning is simply snapping back from an extreme positioning. Before looking at the fundamentals, we must flag that many of these rotational trades now find themselves in the 99th percentile of relative performance (long semis vs. short software, value vs. growth, etc.), meaning the rapidity and magnitude of the rotations has been so extreme that we should not be surprised to see recent moves consolidate.
“She Lives With a Broken Man”: The Fundamentals of This Rotation
Just as narrative follows price, we have to appreciate that price leads data (which is why Sir John Templeton’s aphorism continues to hold: “Bull markets are born on pessimism, grow on skepticism, mature on optimism and die on euphoria.”), but it should be noted that these rotations have been almost entirely driven by valuation changes, with no major (or even minor!) shifts to the trajectories of earnings.
Here we will break down the price action of sectors between valuations and earnings on a 12-month forward basis.
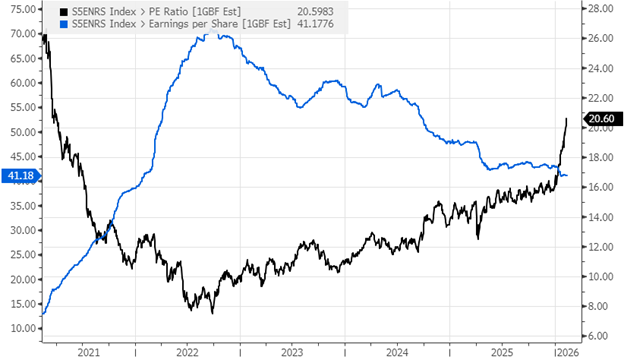
First, look at the Energy sector. Energy typically trades with a counter-cyclical multiple, meaning the market assigns the lowest valuation to the highest earnings (expecting earnings to fall in the future) and the highest valuation to the lowest earnings (expecting earnings to rise in the future). Here you can see that earnings estimates are still falling for Energy, but that the PE multiple is soaring higher.
Energy Sector 12 Month Forward PE Multiple and EPS
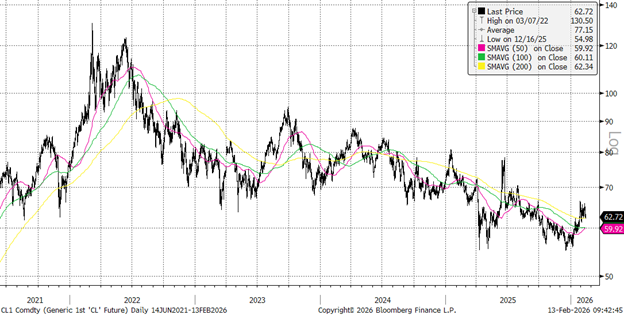
If Energy valuations are anticipating a turn in earnings, it better materialize, so we must monitor the path of oil prices. As seen in the chart below, oil prices have bounced to start 2026 but remain in a distinct downtrend that began with the 2022 peak in prices. The fact that Energy stocks are leading the market YTD, all the while oil prices remain in a downtrend (and bond market inflation breakeven’s remain contained), suggest that this move higher in Energy is largely positioning and could be short-lived.
WTI Oil
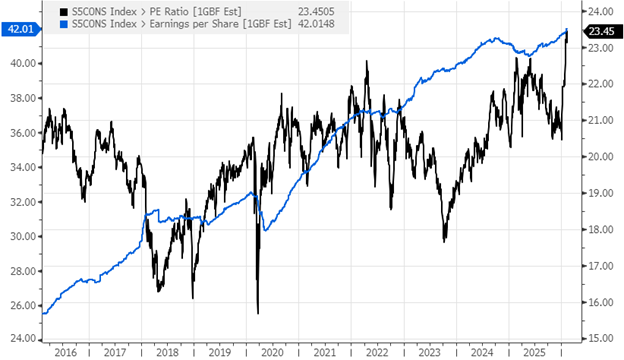
Turning our eye to Consumer Staples, we can see a healthy uptrend in earnings, but that the move higher YTD has been completely driven by PE multiple expansion. In fact, valuation swings have been the key driver of Staples stocks in recent years, as the perceived safety, but lack of growth, has fallen in and out of demand. Notably, Staples now trade at 23x forward, their highest valuation since 1999! This high valuation is thanks in part to the two largest weights in the Staples index, WMT and COST, trading at a whopping 45x and 47x, respectively.
Consumer Staples Sector 12 Month Forward PE Multiple and EPS
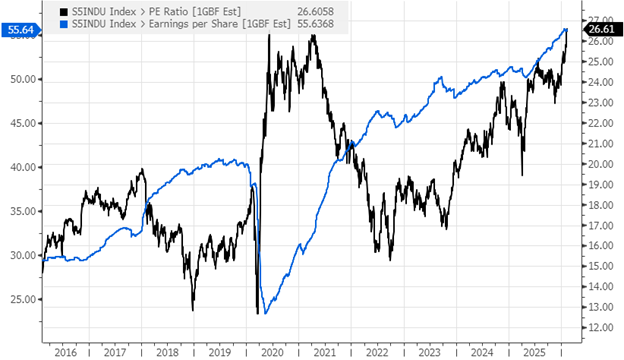
We can also see a fascinating story with Industrials, given this pro-cyclical, pro-growth sector is trading at nearly 27x forward. Industrials are similar to Energy, as they trade with a counter-cyclical valuation, making this 27x look even more egregious. The last time Industrials traded with this valuation, earnings had fallen by nearly 50% during COVID. The high valuation anticipated a rebound in earnings, which is exactly what the sector delivered, doubling earnings off of the 2020 lows over the next two years. Today, sector earnings are at an all-time high, so it is difficult to argue that a “trough” multiple should be applied to today’s record earnings.
Industrials Sector 12 Month Forward PE Multiple and EPS
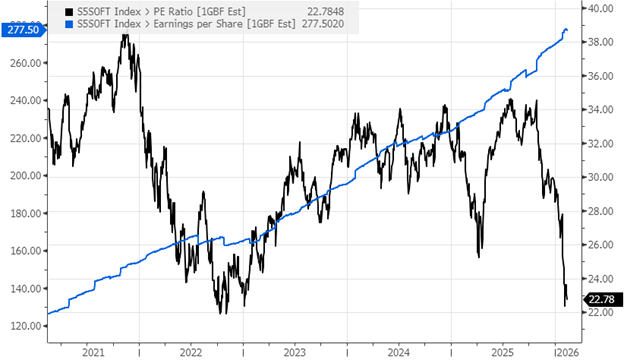
Lastly, let’s look at the recent rotation’s loser with Tech, and specifically Software. The chart below shows how the recent pronounced weakness in Software has been entirely driven by valuation compression, even as 12-month forward earnings estimates have been revised higher. This reflects market consternation about the long-term value of these businesses as today’s earnings power could get heavily disrupted by AI. Software stocks have the substantial burden of having to “disprove a negative” in the near term, as pointing to stable near-term earnings likely is not enough to allay these long-term disruption fears.
Software Industry 12 Month Forward PE Multiple and EPS
All in, it is not surprising to see prices move before earnings or data, this is normal, but eventually we will need to see fundamentals confirm/justify these rotations in order to make them sustainable.
“But I Can’t Help the Feeling”: So, Which is It? Growth Acceleration or Growth Scare?
So, which is it? Is the equity market sending a pro-cyclical, risk-on message given the rallies in Industrials, Materials, and Energy? Or is the equity market sending a defensive, risk-off message with the rallies in Staples and Utilities?
We’ll start with the gloom (as is standard for Radiohead fans) and then get to the better news.
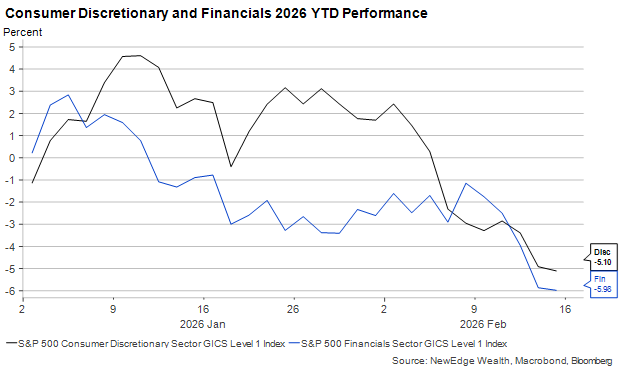
The softer YTD performance of other risk-on sectors like Financials and Consumer Discretionary suggest some wariness about an unabashed “growth reacceleration” risk-on narrative.
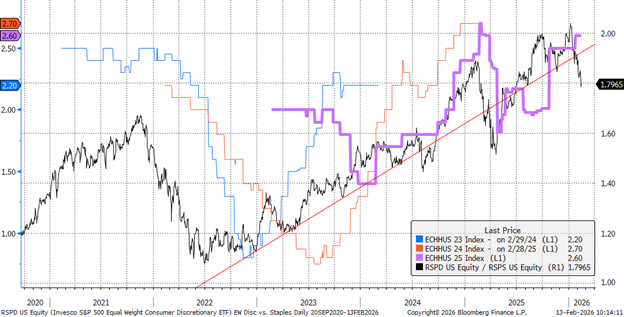
Relatedly, our must-watch, favorite ratio of Equal Weight Consumer Discretionary vs. Consumer Staples is also sending early signals of potential wariness about growth, primarily for the consumer. If this ratio begins to break down further, making lower highs and lower lows, we could grow increasingly concerned about the outlook for the U.S. consumer, U.S. economy and U.S. risk assets.
Equal Weigh Discretionary vs. Staples and Household Consumption Forecasts
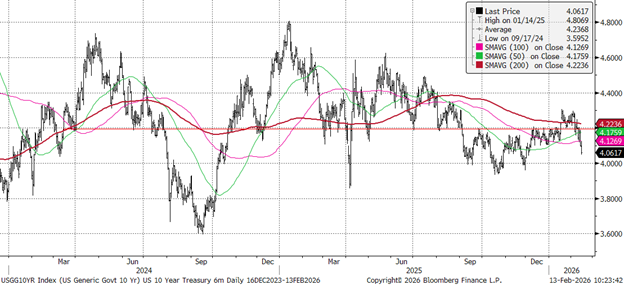
Lastly, with long-term bond yields falling (bond markets rallying) and strong demand in recent auctions for long-term debt, it appears that the bond market does not quite believe the reacceleration narrative either. We would not expect the 10 Year Treasury to trade near 4% (as it is currently) if growth were to accelerate towards 3%.
10 Year Treasury
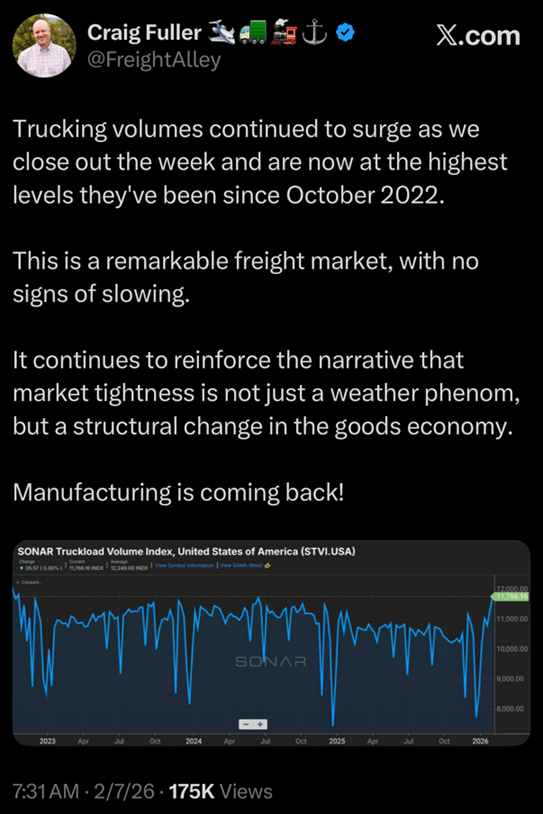
On to the better news, just take a look at Craig Fuller’s Freight Alley X feed, as he has been chronicling the recent tightening in the freight market that is seeing both freight volumes and freight pricing jump higher. Improved freight activity is often seen as an early sign of improved confidence and demand but notably can also be a function of supply disruptions, such as winter weather. For now, the freight market is sending a more optimistic message about growth, that is, of course, if you can avoid having a karaoke machine manufacturer cause a swoon in your stock price.
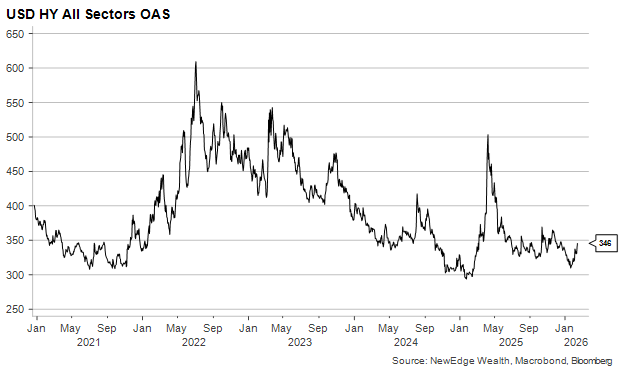
Further raising the mood is the relative calm in credit markets, where High Yield spreads do remain contained. They have risen off of January lows but are still well below levels seen in prior periods of stress and/or growth fears. Note credit spreads are a coincident indicator, meaning they can confirm or deny growth fears and market weakness, but will not predict it. Also note, that the High Yield index has just a 3% weight to software, in contrast to estimates for private credit and BDCs at more than 20% weights to software.
“But Gravity Always Wins”: Conclusion
We often say that the hardest element of market assessment is that, at the start, countertrend, “head fake” moves often look just like the beginning of a tectonic shift. Determining the difference between the two is why we call upon the tools we presented above, each part of a subset of Technical Analysis called Intermarket Analysis. Just like the chords in “Fake Plastic Trees”, price action at potential major inflection points can be “mysterious and ambiguous”.
We think this initial powerful rotational move in markets has been driven by positioning, with narratives being used to explain the anticipation of a change in fundamentals, but no evidence of that fundamental change yet (which, again, is normal).
Thom Yorke reminds us that “gravity always wins”, which is a helpful reminder when we look at both record-high valuations and super-normal profits, both of which can fall back to earth. “Gravity always wins” when we consider extreme positioning or periods of pronounced relative performance shifts, meaning do not be surprised if some of the recent rotations reverse once again. How these newly loved sectors react during “consolidations” will be an important determinant if the rotations have further to run.
So, if you are feeling more like Software stocks than Energy stocks this Valentine’s Day, our only piece of advice is to keep the mood light and maybe avoid choosing Radiohead as your karaoke song tonight!
Click Here to Listen to the Audio Version
IMPORTANT DISCLOSURES
The views and opinions included in these materials belong to their author and do not necessarily reflect the views and opinions of NewEdge Capital Group, LLC.
This information is general in nature and has been prepared solely for informational and educational purposes and does not constitute an offer or a recommendation to buy or sell any particular security or to adopt any specific investment strategy.
NewEdge and its affiliates do not render advice on legal, tax and/or tax accounting matters. You should consult your personal tax and/or legal advisor to learn about any potential tax or other implications that may result from acting on a particular recommendation.
The trademarks and service marks contained herein are the property of their respective owners. Unless otherwise specifically indicated, all information with respect to any third party not affiliated with NewEdge has been provided by, and is the sole responsibility of, such third party and has not been independently verified by NewEdge, its affiliates or any other independent third party. No representation is given with respect to its accuracy or completeness, and such information and opinions may change without notice.
Investing involves risk, including possible loss of principal. Past performance is no guarantee of future results.
Any forward-looking statements or forecasts are based on assumptions and actual results are expected to vary from any such statements or forecasts. No assurance can be given that investment objectives or target returns will be achieved. Future returns may be higher or lower than the estimates presented herein.
An investment cannot be made directly in an index. Indices are unmanaged and have no fees or expenses. You can obtain information about many indices online at a variety of sources including: https://www.sec.gov/answers/indices.htm.
All data is subject to change without notice.
© 2026 NewEdge Capital Group, LLC