2022 Outlook
Key Observations:
- Our understanding of consensus expectations includes a 10% correction in U.S. equity averages in Q1 or 1H and S&P 500 returns in the mid-to-high single digits, as well as expectations of a 10-year Treasury yield in the 1.75% to 1.80% range and gradually increasing crude prices into the $70s to low $80s range.
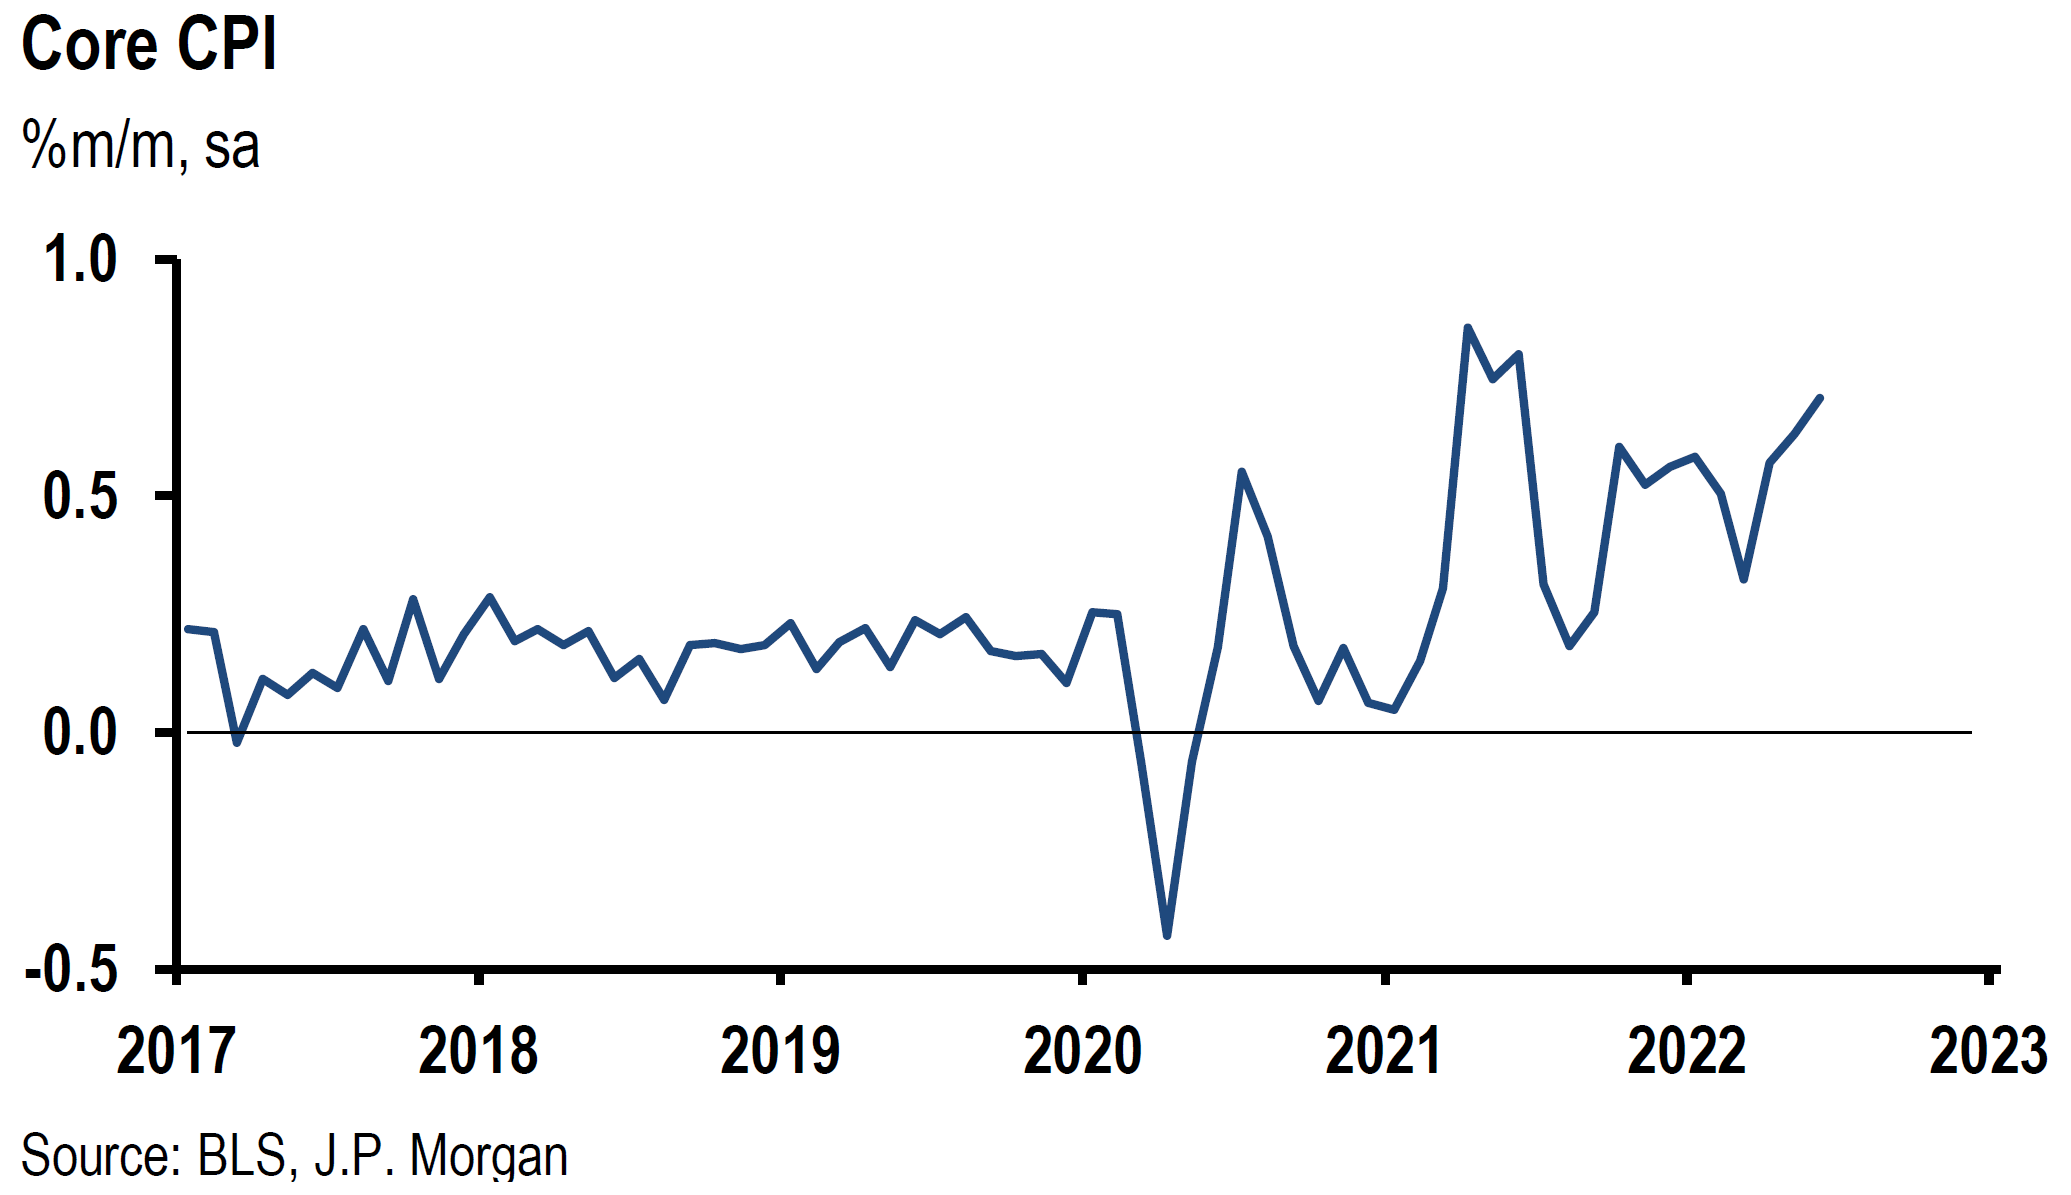
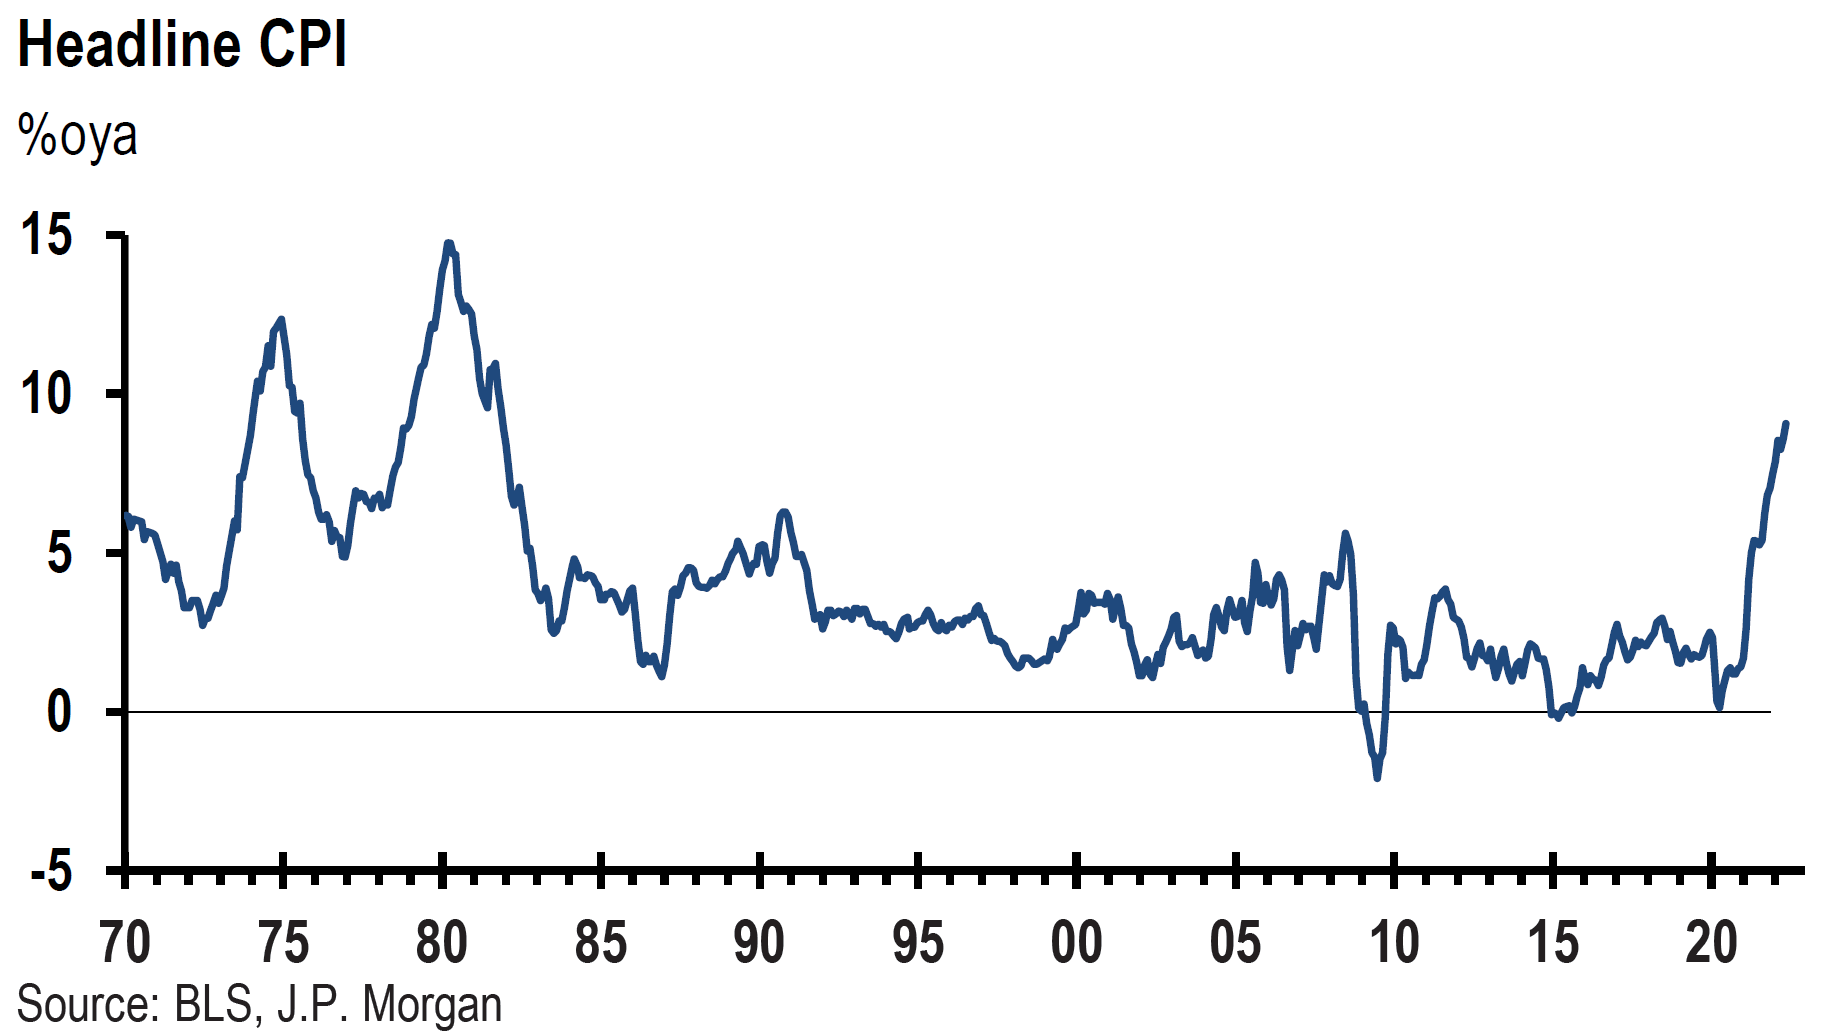
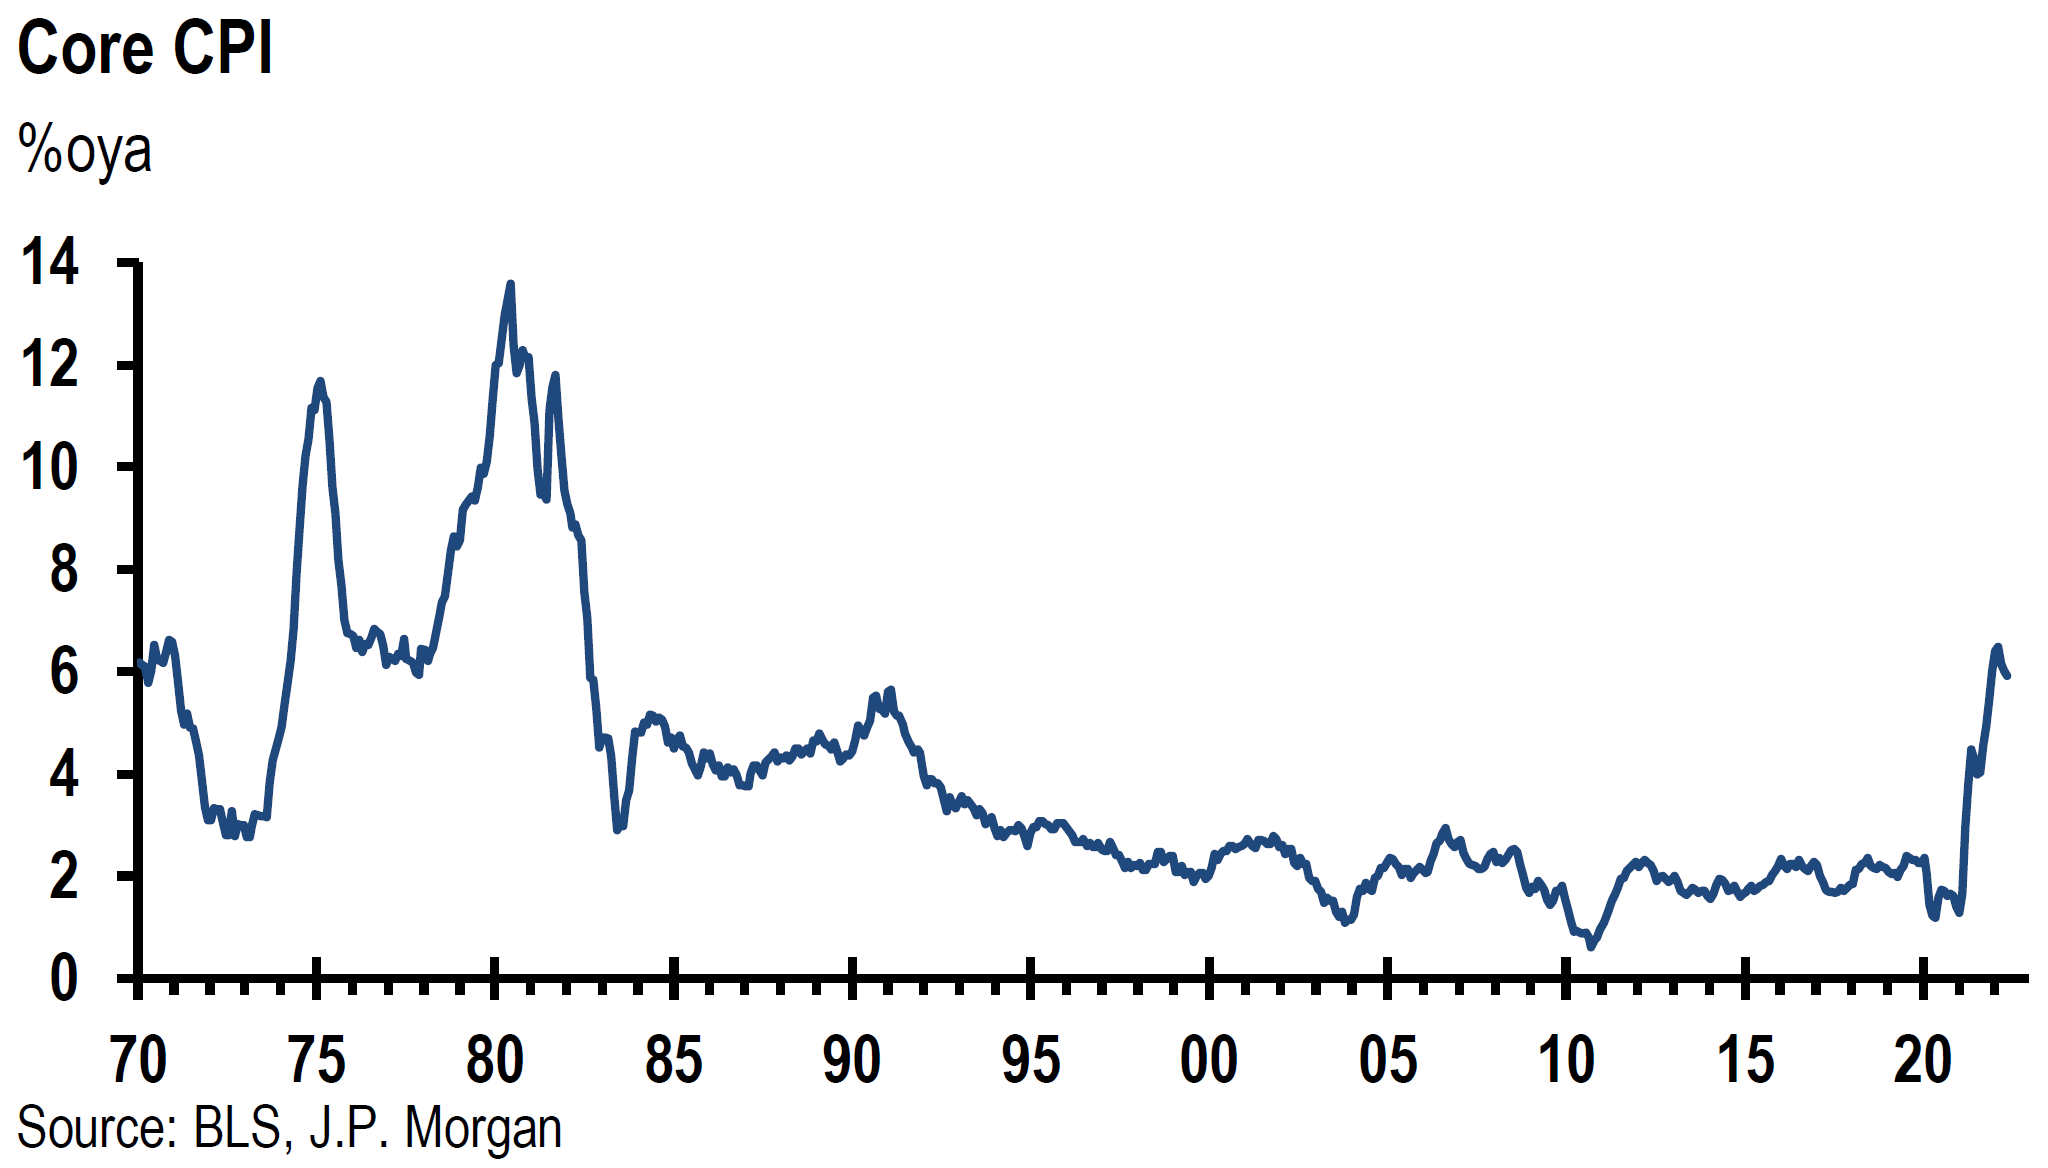
- The Fed expects real U.S. GDP growth of 4.0% for 2022 compared to Evercore ISI’s forecast of 4.5%. The Fed projects personal consumption expenditure (PCE) inflation to drop from 5.3% at year-end 2021 to 2.6% by the end of 2022. Evercore expects the Consumer Price Index (CPI) to come down from 7.0% to 3.5% over the same time frame. Our 2022 expectations exceed these projections.
- Year-ahead forecasts should be subject to change at a moment’s notice. Flexibility is the key to investment survival. Conviction of investment ideas is required for successful investments, while stubbornness will lead to less optimal investment outcomes.
- Some long-term trends were accentuated by the pandemic while others were interrupted. Perhaps the most obvious accentuated trend was the further digitization of economies.
- As always, a consideration of demographics will be a big driver of profitable investments.
The Upshot: We agree with the consensus that selective stock picking will become increasingly important during 2022 to achieve optimal returns. While we also expect volatility, we expect that volatility to occur earlier than consensus. We believe that excess cash at the beginning of this year presents the best risk/reward position to take advantage of the anticipated market declines. We would not be surprised if the market downturn in the S&P 500 exceeded 10% before rebounding to close with single digit returns. We expect the 10-year Treasury yield to exceed consensus expectations. Furthermore, we also expect oil prices, economic growth rates and inflation rates to all exceed consensus estimates. Additionally, we anticipate that the U.S. Dollar (USD) will be lower versus consensus of a stronger USD. A lower USD would further add impetus to U.S. inflation rates and it would also enhance investments in foreign securities. We assume that investments in Europe and emerging markets will become increasingly attractive as the global economy expands further. Additionally, we would not be surprised to see the Fed turn even more hawkish in an attempt to rein in inflation. We believe that the Fed might even announce the beginning of a run-off (shrinking) of its balance sheet before market expectations. But in the end, we maintain our opinion that a properly selected equity portfolio should outperform most fixed income alternatives.
What Makes a Forecast?
This is the time of year when investors clamor for projections and forecasts for the upcoming year and beyond. Most firms and analysts have already voiced their forecasts. Of course, we’re all guessing and it is rare that the best forecasters are consistently ranked at the top. When it comes to forecasting, we learned a long time ago that the best axiom is to try to avoid forecasting the level and/or price of something along with the “timing” of when such levels would be achieved. In the beginning of the song “Get Your Lies Straight,” Terry Evans expressed his “appreciation” of this distinction. He was waiting for his woman friend who told him “she would be back by about four, but now it was still four, but it was four the next day.” At this point, he was just waiting for an explanation that would be consistent over time and would not change. We suspect that Mr. Evans probably would be disappointed by most forecasters as their target levels and timing change over time. After all, we are all “data dependent” in the end. To make profitable investments, one must have conviction but also must be willing to change if the facts change. Flexibility is key in analyzing investments. Stubbornness should be avoided at all costs.
Opportune Time for Forecasts
Obviously, to make any investment, one is implicitly forecasting. But what makes forecasting at year end especially treacherous is that it is expected at a particular point in time. We have witnessed some of the world’s best investors and traders get it wrong mostly because it was expected that they should all of a sudden know what to expect over the next year and beyond. In our experience, that’s just not how profitable investing works. We have never been able to predict when we will have “conviction” about any particular idea or investment. We have never hesitated, however, to express our opinion when we do have conviction. In our view, a critical element of having conviction about any idea is to be aware of counterarguments. We also have viewed that getting in at the “right” price is critical to being able to withstand volatility. “Staying power” also makes a big difference. Over time, we have found that the best way to judge the most advantageous entry and exit points of any investment is to constantly try to discern what assumptions are reflected in prices. Do we agree or disagree with these assumptions? How do prices react to news? Does a stock price not go down as expected on bad news? If not, perhaps bad news is already discounted, which would indicate a favorable entry point. Are we relatively certain that there is no more bad news that is possible? If the overall market trades lower, will this shake our positive view? What macro factors could change our views? Do we expect these factors to change, etc.? Have any facts changed to alter our assumptions? Do we have staying power?
Topics Covered
First, we will present our understanding of what we believe are consensus views, where we differ from such views and what we think could be the biggest surprises relative to consensus. We will also present our perception of trends that the pandemic has accentuated and accelerated, as well as which trends the pandemic has interrupted. We will try to identify the types of data on which we will focus. Additionally, we will enumerate which are in our view the most important long-term trends that present investment opportunities – many of which are very obvious and some maybe not so obvious. Also, we will indicate the type of investments which might benefit from such views. However, we admit that much more analysis needs to be done on these longer term ideas. We have attached an Appendix for those interested in a more detailed analysis of noteworthy 2021 financial data.
Consensus Views as We Understand Them
After listening to many news sources and reading many views of analysts, it is our interpretation that the consensus appears to be that equities will have a volatile year, with an S&P 500 correction of as much as 10% occurring in Q1 or 1H 2022. Consensus also expects muted gains in the single digits for 2022. Both Goldman Sachs and Fundstrat currently have S&P 500 targets of 5,100 (+7.0%). J.P. Morgan’s target of 5,050 would produce a 5.96% return and Credit Suisse very recently upgraded its target from 5,100 to 5,200, which translates to a 9.8% gain. Morgan Stanley appears to be an outlier with its base case target of 4,400, which would produce a 7.68% loss. It is our impression that consensus expects a gradual increase in the 10-year Treasury yield in the 1.75% to 1.80% range and for the USD to continue appreciating. Oil prices are generally expected to be in the range of $70s to low $80s for much of 2022.
Volatility Yes, But When?
We are also of the opinion that 2022 will be a very volatile year – even for major equity indexes. Furthermore, compared to many investors who believe that January might provide significantly higher levels to exit trading-oriented positions before any significant downdraft, we believe that there is a significant likelihood that equities start a decline very early in the month of January. Since the consensus is for a correction in the S&P 500 of about 10% in Q1 or 1H, we surmise that many investors might sell at the first sign of equity weakness, thus exacerbating a quick downturn. The consensus appears to be that stock selectivity will be increasingly important in 2022 for generating outsized performance. We agree, and we have been stressing this for months. But sectors will also be important. We still maintain our conviction that Value and Cyclical types of stocks present the best risk/reward opportunities to buy in the beginning of 2022. Those investors who start the year with relatively high cash levels would be better able to take advantage of the expected volatility. Healthcare and technology stocks also continue to present attractive investment opportunities. Stock selectivity will be especially important in these two sectors. Expertise in these two sectors also is critical. We trust that the convergence of the health sciences – especially perhaps biotech – and technology will only accelerate and become more complex.
Economic Growth and Inflation
We postulate that economic growth and inflation will exceed consensus expectations. As we stated in our market commentary of December 20: “The highly transmissible nature and speed of infections of Omicron is what gives us hope that the repercussions from Omicron infections will also dissipate very quickly.” We understand that this has become the consensus view and we expect that most of Omicron’s disruptive effects on supply chains will dissipate very quickly within one to two months at most. Nevertheless, we still expect intermittent supply chain disruptions due to China’s “Zero COVID-19” policies. Sporadic supply disruptions might still be subject to energy shortages and to severe weather caused by climate change. Furthermore, we agree that many supply chain constraints which greatly exacerbated inflation should eventually diminish. But the longer the inflationary factors persist, the higher the probability that inflation expectations will become more “entrenched” in Fed chair Powell’s words. This is something that Powell is determined to avoid.
The virulence of the Omicron variant also is accepted now to be less virulent than other strains of COVID-19. These factors should help accelerate global GDP growth, especially in emerging markets (EM), which have had lower vaccination rates for a myriad of reasons. We assume that Covid-19 will have less of a negative impact on economic growth as infections become less virulent and as the world’s population become less susceptible to severe sickness from COVID-19, through vaccinations and/or through gaining natural immunity by having become infected. In other words, we will all learn to “live with” the virus and become less willing to permit the virus to disrupt our activities.
We trust that services could have very strong rates of increases relative to goods demand in 2022. Since we view airlines as mostly trading vehicles and not as long-term investments, we have focused on them as giving us an indication of investors’ willingness to look past the negative effect of Omicron. In our opinion, airline stock prices appear to have stopped going down on bad news and look poised to trade to the upside. Our optimistic views on strong increases in demand for services would be confirmed to the extent that airline stock prices will rise, as we expect.
To the extent global economic growth rates accelerate relative to the U.S. due to less negative impact from coronavirus infections, we would expect that the USD, as represented by DXY, will begin to depreciate at some point in the first half of 2022. We understand that the consensus view for USD appreciation mostly is due to the Fed’s more hawkish views relative to Europe’s central bank (ECB) and possibly some other developed markets’ (DM) central banks. However, many central banks in emerging markets have started hiking rates already. We believe that accelerating global economic growth rates will overwhelm the positive USD sentiment, which is based mostly on the Fed’s more hawkish stance relative to selected other central banks. It is our belief that factors such as those just mentioned would also enhance the attractiveness of European and emerging market investments.
Demographics – Goods vs. Services
We will continue to focus on trying to comprehend more fully the pull forward of the demand for goods and the pent-up demand for services, such as real experiences and travel. We agree with Fundstrat’s highlighting the importance of demographics in its 2022 Strategy Outlook report dated December 21, 2021. Many trends will become increasingly dependent on the future spending patterns of the millennials – roughly the 28-48 age group. Increasing new household formations will continue to attract attention and should maintain a strong housing market, which is generally very positive for economic growth. Healthcare services should continue to experience solid demand growth as baby boomers continue to grow older. But millennials should also exhibit strong demand for health care so that they will be more fully able to physically experience the activities in which they engage.
Inflation Expectations and Shelter Costs
Although we anticipate that inflation will dissipate to some extent in 2022, our inflation expectations remain above projected consensus levels. As we have written in many of our weekly commentaries, wage increases tend to have a more persistent effect on inflation. As the labor market could remain “tight” for quite some time, we suppose that significant wage increases will continue in 2022, likewise for shelter costs, which should continue to post solid increases. According to an analysis published by Greenmantle on December 31, 2021, the U.S. Bureau of Labor Statistic’s methodology for computing rent and imputed rent incorporates relevant data with a significant lag. Alternative and more up-to-date rental indicators show more substantial increases in recent months. October data compiled by Zillow show increases of 11.2% year over year and Apartment List show 16.9% increases. Shelter accounts for 17% of PCE and 33% of CPI. Elevated inflation expectations are yet another element which can contribute to increased rates of inflation as people change their behaviors accordingly.
More Inflation — Structural Changes
Even though increasing energy prices have less of an impact on the global economies when compared to the 1970s and 1980s, they still matter. As we have observed in our previous commentaries, rising energy prices continue heavily to influence people’s inflation expectations. Higher gasoline prices at the pump each week are very tough to ignore. The transition from fossil-fuel-generated electricity to renewable energy sources will be a messy and expensive process which should increase inflationary pressures. Structural changes that will make supply chains more resilient and perhaps less cost efficient could also be inflationary. Supply chain “just-in-time” inventory policies will probably be replaced with higher inventory levels – again, more inflation at the margin. Higher natural gas prices and food price increases are potentially additional components that could continue pushing inflation higher. As we have previously explained, natural gas is the primary raw material to produce ammonia. About 90% of the world’s ammonia production is used to produce fertilizer. Increased fertilizer prices inevitably lead to higher food prices. We accept that most investors do not fully appreciate the potential structural changes that could lead to higher inflation.
Blockchain technology could become yet another structural change that could impact inflation. Blockchain might have a two-sided effect on inflation. To the extent it makes supply chains more efficient through such avenues as the Internet of Things (IoT) – which could better track and monitor supplies continually, as well as make transactions more efficient and timely – it would tend to diminish inflationary pressures. However, making transactions more efficient tends to increase the velocity of money, which could then increase inflation.
Fossil-Based Energy
The well-known focus on renewable energy sources to the detriment of further investments in fossil-fuels should continue to propel energy prices higher. Continued strong global economic growth will also be very important for energy prices. We expect crude oil prices to trade higher than consensus estimates during 2022. Substantial crude oil price spikes are entirely possible. Natural gas prices in Europe (EU) have already shown a proclivity to price spikes in 2021. Oil and gas exploration stocks should be more sensitive to the change in oil prices providing more “beta.” This would favor the XOP ETF over the XLE ETF, which is more representative of integrated oil companies. Chevron and Exxon dominate this latter ETF.
Money Supply (M2) and Velocity of Money
We are convinced that the surge in the U.S. money supply – as exemplified by M2 – could finally become a factor in increasing inflation. In its January 2, 2022 commentary, Evercore ISI reports that M2 has increased 41% over the past two years, “a record by a very wide margin.” Increases in M2 have been very large since at least the most recent financial crisis more than a decade ago. We recall that many economists were fearful then that M2 increases – partly due to “quantitative easing” by the Fed – would lead to significantly higher levels of inflation. As we now know, inflation remained very low for many years. We have assumed for many years that one of the principal reasons for inflation remaining at low levels was that the velocity of money plummeted. Given the vast amount of M2 in the financial system, we conclude that a substantial increase in the velocity of money could have significant repercussions for increased inflation. The velocity of money increases as the demand to hold money diminishes. That demand typically lessens as people become more optimistic and become more inclined to spend. Banks’ willingness to lend and loan growth expansion should also lead to increased velocity of money. Evercore ISI has highlighted that “bank loans, which have been a laggard, have now clearly started to accelerate, with the last four weeks increasing at +18.1% annual rate.” Bank loans are currently at $10.7 trillion compared to deposits of $18.1 trillion. Most analysts just highlight that increasing bank loans will accelerate economic growth. We obviously agree on this point. But we continue to be surprised that no one seems to recognize that the resulting increase in the velocity of money could also exacerbate inflationary pressures.
Source: Federal Reserve Bank of St. Louis (12/28/21)
10-Year Treasury Yield
We are convinced that the 10-year Treasury yield will surpass consensus expectations during 2022. In our opinion, this yield most likely will exceed 2% sometime in 2022 – even perhaps by a significant margin. Moreover, we think that there is a better-than-even chance that the Fed could become even more hawkish as the year progresses. It would not surprise us if the Fed were to announce that it will begin a “run-off” of its balance sheet before most investors expect. This would begin to reduce liquidity earlier than anticipated. We suspect that the Fed might pause its hawkish approach if equities experience a correction of more than 10%. In December 2018, it took a sell-off of around 20% before the Fed changed its more tightening stance.
Barbell Approaches
At this point, we see still the advantages of maintaining a “barbell” approach – Value and Cyclical type stocks on one side and quality big-cap tech on the other side. We think that another barbell approach could be added in this year (2022) of transition. Companies with steady cash flows and high quality balance sheets, together with a small portion of one’s portfolio — for those investors with a high risk tolerance — for more long-term and more volatile investments that could perhaps benefit from trends with high potential for “excessive” profits. A rather small basket of biotech stocks that could be attractive take-over targets for some big pharma companies might be considered.
Bottom Line
We would like to reiterate our belief that any forecasts have a much better chance of accuracy when they are made at a time when our conviction level is at a very high level and not just because it happens to be year end. Admittedly, some of our expectations have higher conviction levels than others. We have observed over the years that most forecasts are merely extensions of the most recent trends. It is difficult to anticipate inflection points. That is why we always try to maintain a flexible and open mindset to enhance our ability to spot inflection points before they actually occur, or at least very early in the process of any transition. We will not hesitate to change our expectations if changed circumstances, data, or any of our assumptions are called into question. Since we are not comfortable assessing the likelihood of any geopolitical events actually occurring, we have not factored in any repercussions of such events occurring or even as to whether worries over such events might affect financial markets. Despite our expectations of market volatility, rather persistent inflation and better than consensus global economic growth, we still maintain our belief that a portfolio based on a selective stock-picking approach should outperform most fixed income investments.
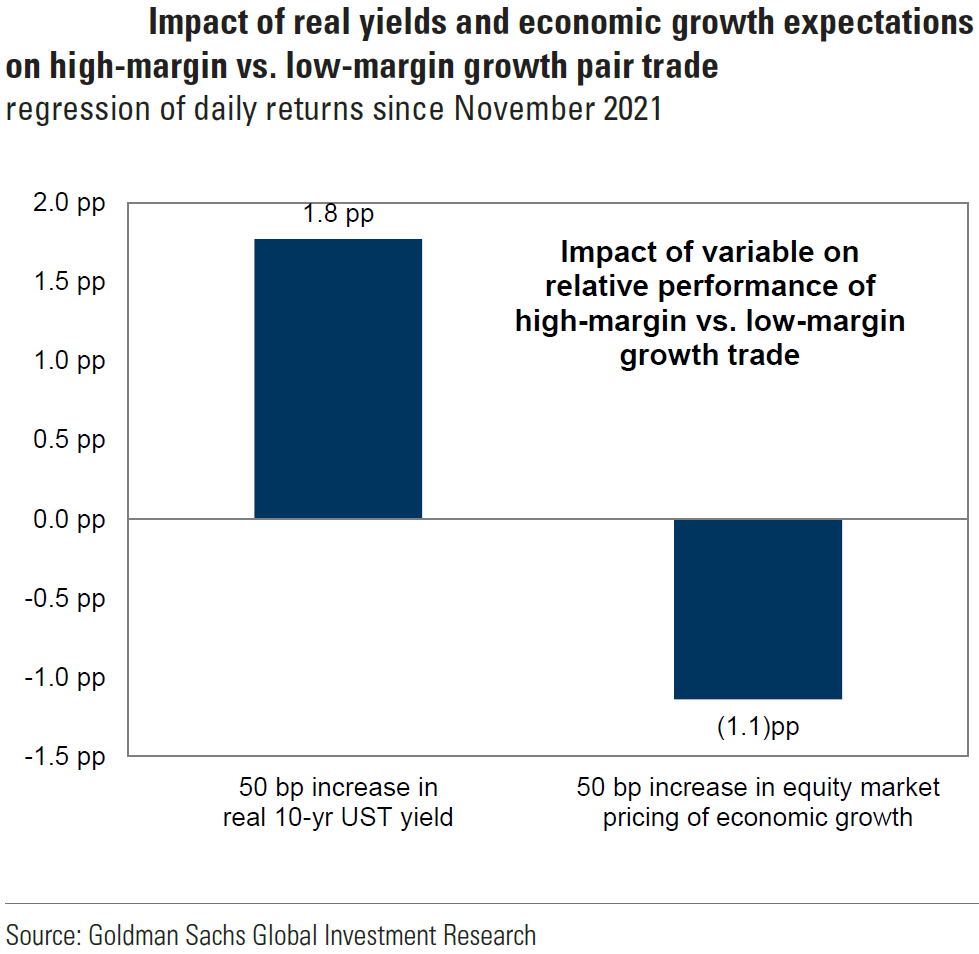
Source: Goldman Sachs, Global Strategy Views: What’s new for 2022? (12/13/2022)
Definitions: Please refer to GICS & MSCI Definitions at the end of this piece.
Noteworthy Trends and Potential Investments Which Warrant Further Consideration and Analysis
ESG and Climate Change
A long-term strategy related to Environmental, Social and Governance (ESG) investments – which focus on climate change, as well as renewable and sustainable energy – could lead to substantial gains. However, these gains would probably be characterized with volatility along the way. Again, an expert understanding of trends and alternatives will be required for a profitable selection of specific companies in these areas. Although the pace of global equity fund flows into ESG investments has dissipated somewhat recently, it is still growing at a very rapid rate. According to Goldman Sachs on December 29, after growing 35% year over year in Q3, trailing three-month ESG flows are down 6% through November. Goldman Sachs further noted that the 2021 year-to-date average of ESG as a percentage of global equity fund flows was 43%, even though only 9% of global fund and exchange-traded fund (ETF) assets under management (AUM) were classified as ESG by Morningstar. Low-carbon funds continued to attract the most inflows but water-linked funds showed the fastest pace of attracting new funds. According to a December 19 report, Goldman Sachs believes that $6 trillion per year in Green Capex is needed in the 2020s to meet Net Zero, Clean Water and Infrastructure goals. This would represent an additional $2.8 trillion per year when compared to 2016-20 average annual Green Capex expenditures.
Selected Green Metals, etc. – An Observation
These trends should favor the long-term price appreciation of “Green” metals such as copper, cobalt, nickel and lithium. Copper is also thought of as an economically sensitive metal, and could be especially sensitive to any slowdown in China’s economy. But over the past month, China’s central bank (PBOC) and the Chinese government have made it clear that they will step in to stabilize China’s economic growth. Over time, we think that uranium could be a profitable investment as nuclear power might become once again a viable non-carbon producing energy alternative that would be considered seriously to reach the global goal of Net-Zero carbon emissions. Obtaining approval to build nuclear facilities, however, is a very lengthy and complicated process. We are not advocating investing in these commodities for our clients. We are merely making an observation of trends which might indicate the progression of renewable energy trends in general.
More Potential Investments to Consider
Other potential investments worthy of further study and analysis that have not been already mentioned include investments related to pure water, farmland, and selected real estate investment trusts (REITs). According to JPM’s October 28 report, REITs tend to outperform most public equities in quarters with above average economic growth and inflation equal to or above 3%. Selected REITs also should benefit from the reopening of economies. We anticipate that capex will continue to grow at a robust pace. As we have previously stressed, investing in the industrial and materials sectors should be especially selective. We have previously highlighted the variability of companies in the industrial sector with respect to maintaining their margins. Our preferences for various materials is identified above. In general, we would avoid companies with a high percentage of wages relative to revenues. Previously cited surveys in our weekly commentaries appear to indicate that we could be fast approaching a limit to certain price increases that customers will be very resistant to accepting. We are probably below consensus as far as assuming that margins will continue to expand.
Source: Goldman Sachs, Global Strategy Views: What’s new for 2022? (12/13/2022)
Trends Accelerated and Interrupted by the Pandemic
Perhaps the most obvious trend accelerated by the pandemic was the more rapid digitization of many of the world’s economies. In our view, one of the primary trends in the pre-pandemic world was the millennials preference for experiences over possessions and the accumulation of goods. The pandemic made people of all generations realize the importance of experiences and human interaction. We thought that the timing of Facebook announcing its name change and its focus to the metaverse and to virtual reality in general was ironic. We fully expect that the need for actual human interaction will be appreciated more fully. Therefore, we remain optimistic that the trend to more city living and moving to areas closer to towns will reassert itself. City living generally means interaction with many types of people. The more remote one’s circumstances, the more likely one will be able to choose interactions with people who are similar to themselves. It becomes easier to develop one’s own “comfort zone” outside of a city atmosphere.
More Divisiveness
Unfortunately, the pandemic seemed to accelerate trends that have continued to increase divisiveness in the U.S., as well as in other counties. Many people simply just don’t want to be told what they should be doing. We suspect that people who have resisted getting vaccines to thwart COVID-19 have become even more hardened in their stance to resist getting a vaccine.
Appendix
A few noteworthy 2021 financial market data.
The S&P 500 closed 2021 at 4,766.18, +26.89%, closed 0.89% off closing high for 2021 and 30.13% above closing low. DOW closed at 36,338.30, +18.73%; 0.93% below high and 21.71% above low. Nasdaq was +21.39% for the year, 3.5% off high, 26.20% above low. Russell 2000 closed up13.70%, 8.69% below high and 16.51% above low. The two top performing S&P 500 sectors were Energy +47.74% and Real Estate +42.50%. The worst performing sector was Utilities at +13.99%. According to Bloomberg, the 10-year Treasury yield increased 60 basis points (bps) to 1.51%. As expressed by DXY, the USD, increased 6.37% to 95.62, its best showing in six years. Its 52 week range was 89.21 (1/6/21)-96.94 (11/24/21).

Source: Bloomberg
MarketWatch observed on January 1, 2022, that the last year when the S&P 500 outperformed both the Dow and the Nasdaq was in 2005, its sixth time to do so. The average returns for the five prior times were +12.6% for the S&P 500, +11% for the Dow and +12.8% for Nasdaq. In the larger sample size when the S&P 500 gained over 20% in one calendar year, the average gain in the following year was 7.7%. In each of the last nine times of at least 20% gains going back to the early 1990s, the S&P 500 was positive in the following year. In the fifteen prior times of 20%+ gains going back to the early 1930’s, the following year showed a negative return seven times.

Source: MarketWatch.com, The S&P 500 beat both Dow, and Nasdaq in 2021 by the widest margin in 24 years. Here’s what history says happens in 2022. (1/1/2022)
A few noteworthy ETF results: XLE +57.85%, XOP +66.73%, XLF +37.77%, KRE +47.07%, XLRE +37.20%.
A few noteworthy foreign equity index 2021 results: Stoxx 600 +22.25%, DAX +15.79%, CAC40 +28.85%, FTSE 100 +14.30%, Nikkei +4.91%, Topix +10.40%, Hang Seng -14.08%, Shanghai Comp +4.80%, MSCI EM index -4.59%, MSCI Asia x Japan -6.36%.
A few noteworthy foreign 10-year sovereign bond yields: Germany +39 bps at close to yield -0.19%, Japan + 5 bps to yield 0.06%, U.K. +78 bps to yield 0.96%, France +54 bps to yield 0.19%, Hong Kong no change to yield 1.22%, Singapore +80 to yield 1.60%, South Korea +53 to yield 2.25%, India +58 to yield 6.45%, New Zealand +140 to yield 2.36%, Australia +66 to yield 1.66%, China down 41.4 bps to yield 2.789%.
In its December 8 report cited previously, JPM listed consensus 2022 earnings for the S&P 500 of $222, +8% year over year compared to its own forecast of $240, + 14% year over year. Based on its own estimates, JPM also projects earnings growth of 20% year over year for the Eurozone and 17% for EMs. Goldman’s 2022 earnings projection is $226 for 2022, which would indicate a price-to-earnings (P/E) ratio of 21.1x at the closing 2021 level for the S&P 500. FactSet’s December 17 publication compared this forward 12 month P/E ratio to the 5 year average of 18.5x and the 10 year average of 16.6x. FactSet noted that its own forecast of 9.2% earnings growth was a sharp deceleration of the 45.1% earnings growth of 2021. Similarly, revenue growth was expected to slow to a 7.5% pace from a 15.8% pace in 2021.
The Federal Reserve’s (Fed) latest real GDP growth forecast for 2022 released at its December 15 meeting was 4.0%, down from 5.5% in 2021. Evercore ISI on January 2, 2022 forecast a nominal U.S. GDP growth of 8.0% for 2022, consisting of 4.5% real GDP growth and 3.5% CPI increases. JPM in its 2022 Year Ahead Outlook piece from December 8 report, projected U.S. real GDP growth of 3.0% for 2022, a global real GDP increase of 3.9%, DM growth of 3.4%, Euro area growth of 4.2%, EM growth of 4.6%, Japan +3.0% and China +5.7%.
The Fed’s PCE inflation expectation on December 15 was 2.6% (2.7% core) for end of 2022 compared to its estimated 5.3% (4.4% core) level for end of 2021. Goldman’s core PCE estimates are 4.5% for end of 2021 and 2.5% for end of 2022, Goldman’s headline CPI for end of 2021 is 7.0% , going down to 3.2% for 2022 year end. Evercore ISI expects a CPI of +3.5% for 2022. Virtually every analyst expects inflation rates to lessen their pace of increase over the next twelve months. The difference is in the magnitude of the declines.
Definitions:
S&P 500 Index – The S&P 500 Index, or the Standard & Poor’s 500 Index, is a market-capitalization-weighted index of the 500 largest publicly-traded companies in the U.S.
DJIA Index – The Dow Jones Industrial Average (DJIA) is a price-weighted index that tracks 30 large, publicly-owned companies trading on the New York Stock Exchange (NYSE) and the Nasdaq.
NASDAQ – The Nasdaq Composite Index is the market capitalization-weighted index of over 2,500 common equities listed on the Nasdaq stock exchange.
Russell 2000 Index – The Russell 2000 Index is a small-cap stock market index that makes up the smallest 2,000 stocks in the Russell 3000 Index.
The STOXX Europe 600 Index – The STOXX Europe 600 Index is derived from the STOXX Europe Total Market Index (TMI) and is a subset of the STOXX Global 1800 Index. With a fixed number of 600 components, the STOXX Europe 600 Index represents large, mid and small capitalization companies across 17 countries of the European region: Austria, Belgium, Denmark, Finland, France, Germany, Ireland, Italy, Luxembourg, the Netherlands, Norway, Poland, Portugal, Spain, Sweden, Switzerland and the United Kingdom.
DAX Index – The DAX is a stock market index consisting of the 40 major German blue-chip companies trading on the Frankfurt Stock Exchange. It is a total return index. Prices are taken from the Xetra trading venue.
CAC 40 Index – The CAC 40 is a benchmark French stock market index. The index represents a capitalization-weighted measure of the 40 most significant stocks among the 100 largest market caps on the Euronext Paris. It is a price return index.
FTSE 100 Index – The FTSE 100 is a market-capitalization weighted index of UK-listed blue-chip companies and is designed to measure the performance of the 100 largest companies traded on the London Stock Exchange that pass screening for size and liquidity.
Nikkei 225 Index – The Nikkei 225 Index is a price-weighted index composed of Japan’s top 225 blue-chip companies traded on the Tokyo Stock Exchange.
Tokyo Price Index (TOPIX) – TOPIX is a capitalization-weighted index that lists all firms in the “first section” of the Tokyo Stock Exchange (TSE), a section that organizes all large firms on the exchange into one group. The second section of the TSE pools all of the smaller remaining companies.
Hang Seng index – The Hang Seng Index or HSI is a free-float market capitalization-weighted index of the sixty largest companies that trade on the Hong Kong Exchange (HKEx).
Shanghai Stock Exchange Composite Index (Shanghai/SSE Composite) – The Shanghai Stock Exchange Composite Index, is a stock market composite made up of all the A-shares and B-shares that trade on the Shanghai Stock Exchange (SSE). The index is calculated by using a base period of 100. The first day of reporting was July 15, 1991.
MSCI Europe Index – The MSCI Europe Index captures large and mid-cap representation across 15 Developed Markets (DM) countries in Europe. With 430 constituents, the index covers approximately 85% of the free float-adjusted market capitalization across the European Developed Markets equity universe.
MSCI Japan Index – The MSCI Japan Index is designed to measure the performance of the large and mid-cap segments of the Japanese market. With 272 constituents, the index covers approximately 85% of the free float-adjusted market capitalization in Japan.
MSCI EM Index – The MSCI Emerging Markets Index captures large and mid-cap representation across 27 Emerging Markets (EM) countries.
MSCI Asia Ex-Japan Index – The MSCI AC Asia ex Japan Index captures large and mid-cap representation across 2 of 3 Developed Markets (DM) countries (excluding Japan) and 9 Emerging Markets (EM) countries in Asia. With 1,212 constituents, the index covers approximately 85% of the free float-adjusted market capitalization in each country.
U.S. Dollar Index (DXY) – The U.S. Dollar Index is an index of the value of the United States dollar relative to a basket of foreign currencies, often referred to as a basket of U.S. trade partners’ currencies. The Index goes up when the U.S. dollar gains “strength” when compared to other currencies.
Global Industry Classification Standard (GICS) – The Global Industry Classification Standard is an industry taxonomy developed in 1999 by MSCI and Standard & Poor’s for use by the global financial community. The GICS structure consists of 11 sectors, 24 industry groups, 69 industries and 158 sub-industries into which S&P has categorized all major public companies.
M2 (Money Supply) – M2 is a calculation of the money supply that includes all elements of M1 as well as “near money.” M1 includes cash and checking deposits, while near money refers to savings deposits, money market securities, and other time deposits (in amounts less than $100k).
Velocity of Money – The velocity of money is a measurement of the rate at which money is exchanged in an economy. It is the number of times that money moves from one entity to another. It also refers to how much a unit of currency is used in a given period of time.
Personal Consumption Expenditures (PCE) – Personal Consumption Expenditures (PCE) refers to a measure of imputed household expenditures defined for a period of time.
Consumer Price Index (CPI) – The Consumer Price Index is a measure of the average change over time in the prices paid by urban consumers for a market basket of consumer goods and services.
Blockchain – A blockchain is a distributed database that is shared among the nodes of a computer network. As a database, a blockchain stores information electronically in digital format. Blockchains are best known for their crucial role in cryptocurrency systems, such as Bitcoin, for maintaining a secure and decentralized record of transactions.
Web 3.0 – A paradigm shift of the internet (or “Web”) characterized by AI-driven services and decentralized (blockchain) data architecture.
Internet of Things (IoT) – The interconnection via the internet of computing devices embedded in everyday objects, enabling them to send and receive data.
Environmental, Social, and Corporate Governance (ESG) – Environmental, Social, and Corporate Governance (ESG) is an evaluation of a firm’s collective conscientiousness for social and environmental factors. It is typically a score that is compiled from data collected surrounding specific metrics related to intangible assets within the enterprise.
Green Metals – “Green metal” refers to a metal with lowest total life cycle carbon (Clc) emissions over its useful period.
Renewable Energy – Energy from a source that is not depleted when used, such as wind or solar power.
IMPORTANT DISCLOSURES
The views and opinions included in these materials belong to their author and do not necessarily reflect the views and opinions of NewEdge Capital Group, LLC.
This information is general in nature and has been prepared solely for informational and educational purposes and does not constitute an offer or a recommendation to buy or sell any particular security or to adopt any specific investment strategy.
NewEdge and its affiliates do not render advice on legal, tax and/or tax accounting matters. You should consult your personal tax and/or legal advisor to learn about any potential tax or other implications that may result from acting on a particular recommendation.
The trademarks and service marks contained herein are the property of their respective owners. Unless otherwise specifically indicated, all information with respect to any third party not affiliated with NewEdge has been provided by, and is the sole responsibility of, such third party and has not been independently verified by NewEdge, its affiliates or any other independent third party. No representation is given with respect to its accuracy or completeness, and such information and opinions may change without notice.
Investing involves risk, including possible loss of principal. Past performance is no guarantee of future results.
Any forward-looking statements or forecasts are based on assumptions and actual results are expected to vary from any such statements or forecasts. No assurance can be given that investment objectives or target returns will be achieved. Future returns may be higher or lower than the estimates presented herein.
An investment cannot be made directly in an index. Indices are unmanaged and have no fees or expenses. You can obtain information about many indices online at a variety of sources including: https://www.sec.gov/answers/indices.htm.
All data is subject to change without notice.
© 2025 NewEdge Capital Group, LLC