


Introduction: What is Gold?
Another week, and another new all-time high. No, not for the S&P 500 (this time), but for gold. The precious metal has been on a tear since late August, easily dwarfing the simultaneous rallies in stocks and bonds. Investment strategists don’t always see these runs coming, but often reward them with white papers after the fact. This is our contribution. The very fact that we’re writing it may, in fact, ensure that gold has finally hit a top.
Gold has relatively few industrial uses, making it almost like a collectible item prone to speculation. It is only worth as much as someone wants to pay for it. But while it’s been decades since gold-backed paper currency and more than a century since it has served as a widespread medium of exchange, gold continues to dominate investor psychology, forcing its way into diversified portfolios.
Thirty years ago, Pierce Brosnan took his inaugural turn as James Bond in GoldenEye. The film is perhaps most notable for its Nintendo 64 video game counterpart, which launched millions of hours of basement and dorm room multiplayer fights. The reliably suggestive dialogue in the film itself (a staple of mid-90s screenplays) makes it too racy to inspire our content today, but we are fortunate to be able to fall back on the excellent lyrics from the legendary Tina Turner’s theme song.
While the Goldeneye film was eclipsed by its theme song and accompanying video game, no asset has managed to eclipse gold so far in 2025. In this piece, we will:
- Identify the drivers of gold
- Examine gold’s performance over time
- Answer the question on investors’ minds: Is it too late to buy some?
“More Than Darkness in the Depths”: What Makes Gold Tick?
It’s difficult to say precisely what drives the price of gold, which is why we often refer to it as a “psychological commodity”, meaning it can benefit from the fear or anticipation of something happening, not necessarily the actual risk coming to fruition. The risks of a U.S. debt default and dollar debasement in 2011 are one such example.
The yellow metal has a reputation for appreciating when investors are nervous or panicking, but the evidence for that is mixed. Gold struggled throughout 2008 and fell sharply – though briefly – during the onset of the COVID pandemic in 2020 as investors liquidated it (figuratively speaking) to build cash reserves. Gold had a longer drawdown during the first nine months of 2022, a time when inflation was spiking and geopolitical risk was close to a full boil.
If we had to identify one variable to which the gold price responds, it would be short-term real interest rates. As these short-term real interest rates, or inflation-adjusted cash yields, move lower, gold tends to move higher as investors look to it – rightly or wrongly – as a store of value, and precisely one that does not pay a yield. Gold has performed best coming out of recessions or crises, when inflation is usually rising but short-term interest rates are low. Similarly, gold performs well amid stagflationary conditions (weak growth with high inflation) and when central banks are seen as less attentive to inflation risks while easing policy to address economic weakness. Both 2024 and 2025 belong in the latter category.
Gold has a mixed track record of performance during recessions. Short-term Treasury rates nearly always fall heading into slowdowns, but inflation expectations are often declining, as well. This leaves the path of real interest rates ambiguous. Indeed, central banks are often fighting against an unwanted rise in short-term real rates as recessions take hold. This chart shows the correlation between gold and the 2-year TIPS yield. When the Fed is encouraging or, at least, tolerating a drop in real interest rates (as it was in 2009, 2019, and 2024), gold has risen by as much as 50% in a 12-month period. Real interest rates are inverted on the graph below, so when the black line is rising, real rates are falling.
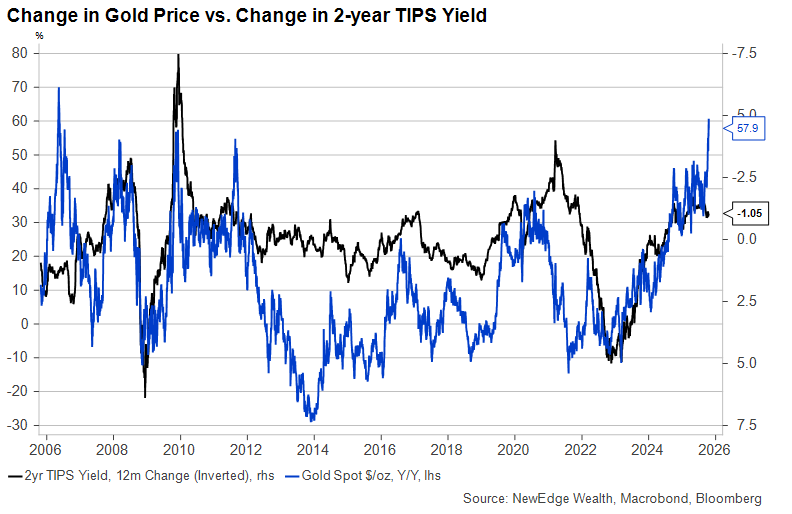
Eagle-eyed readers will note that the very recent lurch higher in gold has not been accompanied by a meaningful decline in real interest rates. We’ll get to that below.
“How it Feels to be the One Who’s Left Behind”: Gold’s Performance Over the Long Term
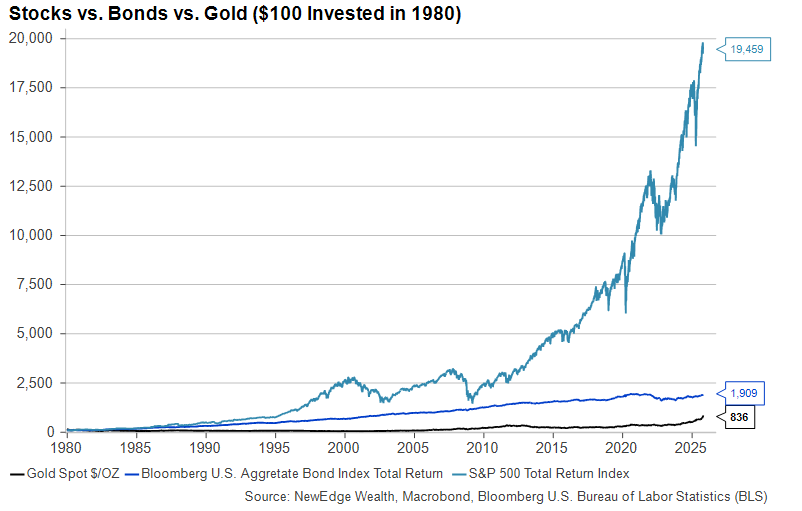
Whether gold has been a valuable addition to a diversified portfolio of stocks and bonds over time depends very much on one’s definition of “over time”. Start the clock in 1980, for example, a time of high inflation just before the Fed seized back its lost credibility, and you’ll see gold being lapped many times over by stocks and being more than doubled up by bonds. Much of this comes from the compounding of interest payments and dividends over time. Gold, notably, has neither.
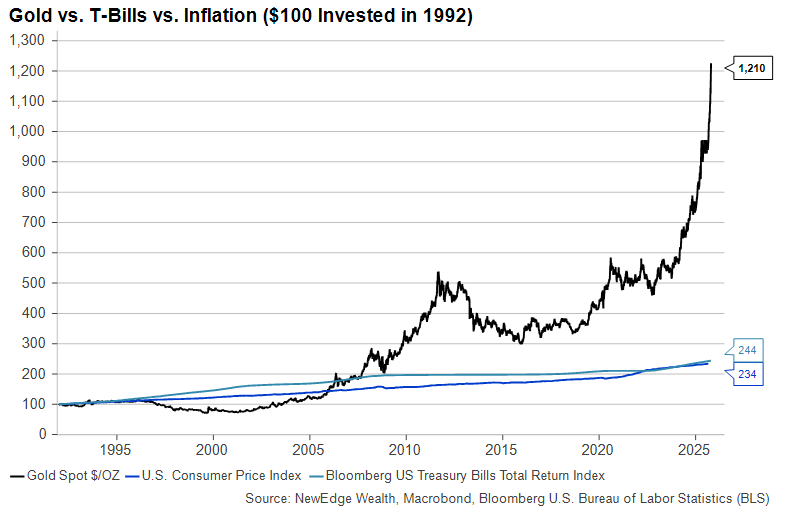
This next graph illustrates one of the common fallacies associated with gold ownership, namely that it is a stable store of value or, relatedly, an inflation hedge. In fact, there has been virtually no relationship between the rate of inflation and the gold price over time. Gold lost substantial value from the mid-1990s to the mid-2000s and again from the early 2010s to the early 2020s despite inflation being positive in all those years.
Of course, on a cumulative basis, gold has far exceeded both the rate of inflation and the return on cash. But that could also be said of corporate bonds and stocks, neither of which are regarded as stable stores of value.
Let’s now address gold’s incredible run this year, specifically its parabolic rise over the past two months. For most of this period, as we showed above, short-term real interest rates have been falling, and real assets of all stripes have posted solid returns:
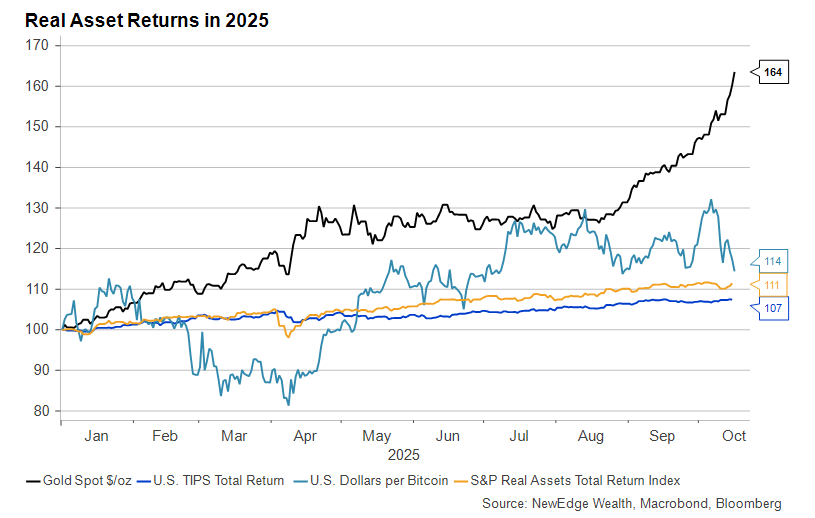
2025 has been notable for the onset of tariffs, economic strife between the U.S. and China, and the passage of a deficit-increasing tax and spending package. All of these have likely contributed in some way to investor demand for gold. The prospect of the U.S. dollar no longer being the dominant global medium of exchange has increased demand for alternative currencies, including non-traditional ones like gold and certain cryptocurrencies.
As the graph above shows, however, the bulk of gold’s rise has occurred in the past two months, during which the U.S. dollar has risen, trade-related uncertainty has waned somewhat, and the U.S. fiscal outlook continues to point to growing debt over all time horizons. The Fed’s pivot to lower inflation rates, despite inflation being still well above its 2% target, is the most likely cause of gold’s late summer surge.
The question investors are grappling with is: has gold’s move properly accounted for the Fed’s dovish turn, or has it dramatically overshot its fair value? That’s the crux of our next section.
“It’s a Gold and Honey Trap”: Is Now a Good Time to Add Gold to Portfolios?
It’s hard to imagine a better scenario for gold than the one that’s unfolded in 2025: high deficits, global political uncertainty, a dovish Fed, a falling USD, and falling real interest rates. The question investors must ask is whether gold’s price already reflects this best-case outcome. Our analysis suggests that gold has run too far, too fast in the near term based on its historical relationship with similar assets like TIPS, but we can also use technical analysis to confirm this.
The chart below shows this “too far, too fast”, or overbought, condition for gold, with the red circle noting the yellow metal’s relative strength index (RSI) flashing “overbought” signs for the last month and a half.
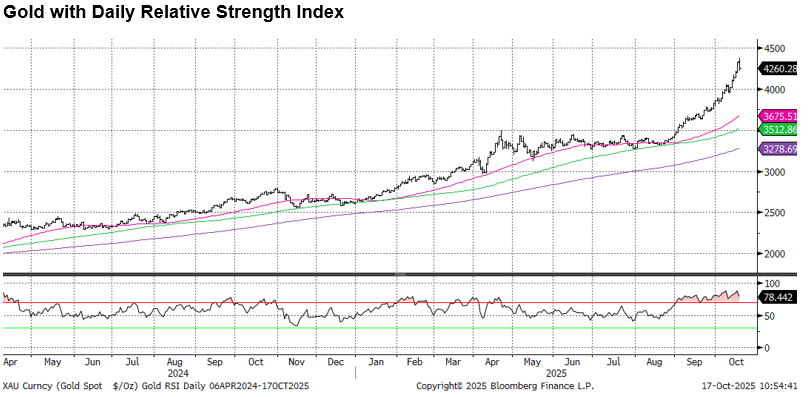
The fact that gold has remained overbought for an extended period of time is a testament to its powerful momentum over the last two months. This powerful momentum has brought gold to a whopping 30% above its 200-day moving average, another way to capture how overbought it is.
We will monitor gold’s momentum closely, as signs of fading momentum could signal a “digestion” of its recent parabolic move higher. For example, simply correcting to its 50-day moving average would represent a nearly 15% correction.
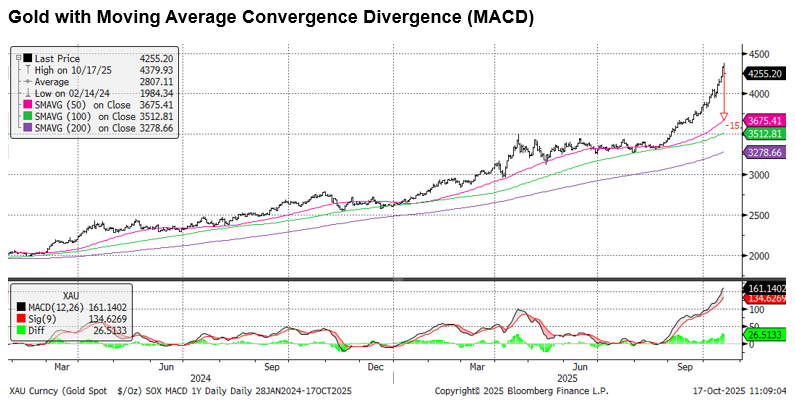
The chart above shows that gold became overbought back in the summer, but this condition was resolved by gold going sideways for a few months, instead of experiencing a sharp correction.
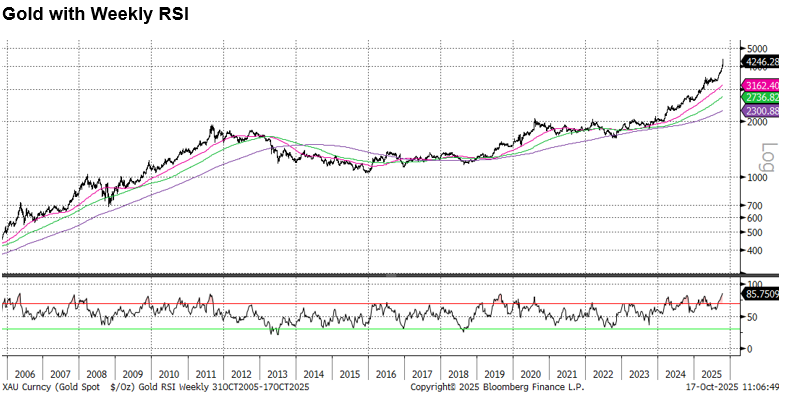
When we measure momentum and trend on a longer-term basis, gold has been overbought for eighteen months yet continues to surge to new highs. The chart below shows a weekly RSI for gold. Note how many times gold has shown an overbought condition, notably in early 2024 and 2025, but still managed to make new highs.
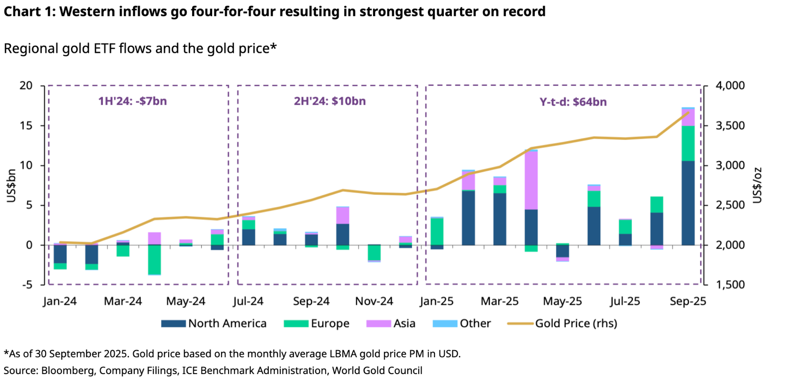
Analysis of positioning and flows shows that retail investors are chasing the gold trade. The sharp flows into gold ETFs help explain why the gold chart resembles many of the speculative stocks that have also gone parabolic since early September. It also provides a hint as to why gold’s recent vertical move higher has decoupled from past macro relationships: the asset is swept up in the recent high-momentum speculative surge. Long-term gold bugs might be joyously singing “I told you so!” right now, but some of this rally could prove ephemeral if momentum fades and retail chasers lose excitement.
The conclusion from the gold technicals is that the metal’s recent parabolic move increases the risk of a correction in the near term, but the longer-term uptrend remains powerful. The vertical move of the last month and a half suggests that gold might be the beneficiary of meme-like speculative momentum flows, which raises the possibility of a near-term correction (never forget the legendary Bob Farrell’s rule: “Exponential rapidly rising or falling markets usually go further than you think, but they do not correct by going sideways.”)
Of course, gold is not the only prominent asset making new all-time highs. The S&P 500 and NASDAQ have been at or near historical peaks for most of the past several months. Even the 10-year U.S. Treasury yield has been approaching a multi-year low. Poor returns do not necessarily follow from all-time highs, of course, and the well-telegraphed drop in cash rates over the next few months could bring more money off the sidelines into any number of assets, including gold.
“It’ll Take Forever to See What I’ve Got”: How Much Gold is the Right Amount?
As we covered above, whether gold has improved a portfolio’s risk-adjusted return depends very much on when the investments were first made. Our NewEdge Wealth Strategic Asset Allocations hold a 5% weight in public (i.e., liquid) real assets, a category that includes gold and other commodities as well as inflation-linked bonds and securities tied to real estate and infrastructure.
The major drawback to having a large gold position in a portfolio is its high volatility, which partly offsets its low correlation to major asset classes. Gold also has a demonstrated track record of losing a substantial percentage of its value over both short- and long-term time horizons, as we showed earlier.
This chart shows the performance since 1990 of two portfolios. The first is a simple 60/40 U.S. Stock/Bond blend. The second includes a 5% gold position carved out of both stocks and bonds. Over the past 35 years, the average annual return on both portfolios has been 8.9%, although the one with gold has exhibited a little less volatility along the way.
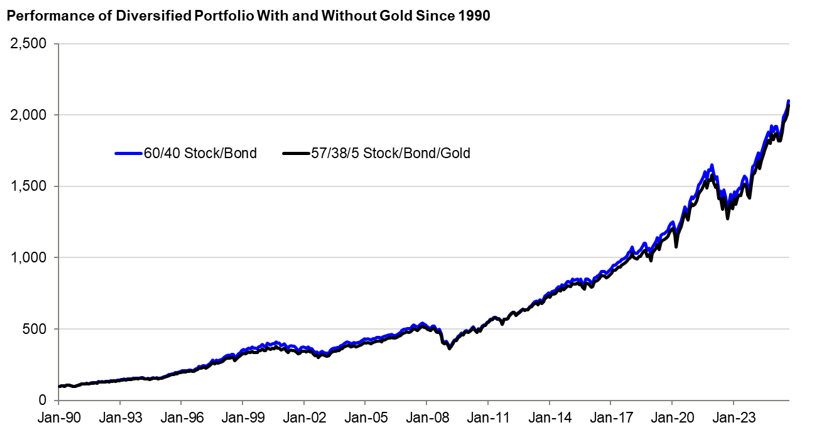
These results might be surprising to anyone who has only been following gold for the past few years. We do not think investors should expect to benefit over the long run from holding large gold positions in their portfolios, but it clearly can add tactical value over short- and medium-term investment horizons. We are, however, concerned that gold could exhibit a higher correlation to other assets in a risk-off market scenario, given how strongly it has rallied and how aggressively investors have poured into it.
Of course, the shorter the investment horizon, the more important it is to time entry points well. As the technicals suggest, gold may need to correct or consolidate before moving significantly higher, even in the current friendly environment. Investors concerned about an overly dovish Federal Reserve or who seek asset classes that would perform well in a prolonged Stagflation Lite environment can consider TIPS or public infrastructure as lower octane real asset classes.
IMPORTANT DISCLOSURES
The views and opinions included in these materials belong to their author and do not necessarily reflect the views and opinions of NewEdge Capital Group, LLC.
This information is general in nature and has been prepared solely for informational and educational purposes and does not constitute an offer or a recommendation to buy or sell any particular security or to adopt any specific investment strategy.
NewEdge and its affiliates do not render advice on legal, tax and/or tax accounting matters. You should consult your personal tax and/or legal advisor to learn about any potential tax or other implications that may result from acting on a particular recommendation.
The trademarks and service marks contained herein are the property of their respective owners. Unless otherwise specifically indicated, all information with respect to any third party not affiliated with NewEdge has been provided by, and is the sole responsibility of, such third party and has not been independently verified by NewEdge, its affiliates or any other independent third party. No representation is given with respect to its accuracy or completeness, and such information and opinions may change without notice.
Investing involves risk, including possible loss of principal. Past performance is no guarantee of future results.
Any forward-looking statements or forecasts are based on assumptions and actual results are expected to vary from any such statements or forecasts. No assurance can be given that investment objectives or target returns will be achieved. Future returns may be higher or lower than the estimates presented herein.
An investment cannot be made directly in an index. Indices are unmanaged and have no fees or expenses. You can obtain information about many indices online at a variety of sources including: https://www.sec.gov/answers/indices.htm.
All data is subject to change without notice.
© 2026 NewEdge Capital Group, LLC


