

Weekly Summary: October 17 – October 21, 2022
Key Observations:
- It appears that many Federal Reserve (Fed) officials are getting a “good feeling” as they express their conviction for an aggressive monetary policy tightening. One of the latest such Fed speakers was the Philadelphia Fed president Patrick Harker, who said this week that he saw a “disappointing lack of progress” in the Fed’s fight against inflation. Harker’s statements echoed the Cleveland Fed’s president Loretta Mester last week who claimed that she saw “no progress on inflation.” Fedspeak seems increasingly to be one voice.
- We were encouraged generally by stock price reactions to “good” Q3 earnings reports. This was especially true for many big cap U.S. bank stocks last week when they extended their gains in spite of last week’s Friday equity declines. Their good price performance continued into this week as well. Energy stocks continued to be top performers this week. Energy stock prices were higher generally even on Tuesday this week, when oil prices were lower. Looks like “bad” news was priced in. Negative stock price reactions to unexpected “bad” news did not seem to spill over into overall equity prices – also encouraging.
- We were impressed by the resilience of U.S. equity prices even as Treasury yields spiked higher. The 10-year Treasury yield on Friday traded over 4.3% before retracing part of its rise in yield. USD also retreated from its highs on Friday when yields lost some of their gains. This was supportive of U.S. equity prices. The 2-year, 10-year Treasury yield curve became less inverted this week as well. We interpret a less inverted yield curve as an indication that if we enter into a recession, that it would be less severe.
- Most of the economic data we analyzed this week indicated a slowing U.S. economy with many business executives becoming more pessimistic on their six-month economic growth outlooks. Higher interest rates appeared to lead to slowing demand in some cases. The Fed’s Beige Book showed a “cooling in labor demand” even as the labor market was still characterized as “tight.” Unfortunately, many surveys indicated that wage growth rates remained elevated, were widespread and were expected to continue to be elevated. The Fed has made clear that the tight labor market and wage gains are their focus on reining in inflation.
The Upshot: Our general investment approach remains the same as depicted in last week’s commentary. We maintain our preference for big cap high quality stocks with good balance sheets, relatively stable cash flows and stable margins. Volatility across sectors continues to be supportive of a diversified portfolio for long term investors.
In our recent commentaries, we have assumed that a 10-year Treasury yield substantially above 4% would be a headwind for stock valuations, and in particular for growth stocks. We viewed the 10-year yield’s rapid ascension to over 4.3% (before retreating somewhat) this week as very problematic for stock valuations. U.S. equities were very resilient in the face of these increased yields. The positive reaction was especially acute when the 10-year yield and USD came off their highs. It appears that, everything else being equal, U.S. equities can appreciate – at least in the short-term – on any indication that we could be close to a top in 10-year Treasury yields and to a top in USD.
We have postulated for quite some time that interest rates and their volatility have been the principal drivers of equities and currencies for most of this year. We have highlighted the relative illiquidity in Treasury markets as an important element in that market’s volatility. On October 21, J.P. Morgan (JPM) remarked on the “poor” liquidity in the Treasury market. “The liquidity in the Treasury market is slightly lower than the prior quarter and overall much worse than Q1 and pre-2022. The average market depth for Q3is $1.67B, down 61% vs 5Y history and 33% vs 1H22.”
We have also noted the importance of earnings and the expected downward revisions of earnings and margins. Again, we are encouraged in general by stock price reactions to already downwardly revised expectations. We interpreted a favorable price reaction to “good” news as a very good indication that earnings were overly pessimistic. In other words, too much pessimism was priced into the stock prices of many companies. Seasonal factors were also very conducive of the U.S. equity rally that began at the opening prices of last week’s Thursday’s trading.
Fed Officials Appear to Have a “Good Feeling”
We realize that this sounds rather odd, but it appears that many Fed officials have a “good feeling” about their current aggressively tightening monetary policies. In this context, we thought of Flo Rida’s song “Good Feeling.” We imagine that a Fed official could be saying “sometimes I get a good feeling … that I never never … had before.” Judging by the recent Fedspeak of this week that we have recounted also in our prior commentaries, many Fed officials seem confident of their current policies. They could be thinking: “Yes I can, doubt better leave, I’m running with this plan … I got a brand new spirit; Speak it and it’s done.” It is this new-found confidence of Fed officials that concerns us. We postulate that many market participants and analysts share our concern. We suppose that this confidence will lead to the Fed tightening more than is “required” to rein in inflation. If this scenario transpires, the chances of a U.S. recession will increase. We believe that the Fed should show more “patience” in letting their prior tightening policies take effect. However, we are not optimistic that they will slow their tightening trajectories. We maintain our conviction that the U.S. economy has showed signs of slowing growth and slowing inflationary trajectories, as summarized in our previous commentaries. We assume that Fedspeak will remain hawkish so that financial conditions will continue to tighten. At the first sign of any inclination to pause in the Fed’s trajectory of interest rate hikes, U.S. equity prices would most likely increase, but interest rates and the U.S. dollar (USD) would fall. The Fed wants to postpone this reaction. We look forward to the day when the Fed could “get a good feeling” when they are able to pause their rate hikes. Perhaps at that point, most investors would be able to share in such a “good feeling” as well.
Mostly Encouraging Stock Price Reaction When “Good” Q3 Earnings Were Announced
We have been encouraged by the reaction of many U.S. stocks when their Q3 earnings, revenues and outlooks exceeded lowered expectations. This was particularly the case on Friday of last week, when many large U.S. banks were still able to maintain their gains on positive financial results – even as major U.S. equity averages sold off. That Friday’s trading was still being affected by turmoil in UK markets and politics that precipitated a rise in U.S. Treasury yields. Prime Minister Liz Truss resigned her position as prime minister on Thursday of this week. However, there was no noticeable spillover effect from the UK this week. U.S. companies that have reported disappointing results this week and last, have seen their stock prices suffer. But disappointing results seemed to be not “market moving.” Instead, it was the rise of Treasury yields that appeared to put pressure on U.S. equity prices. Perhaps most worrisome, was the 10-year Treasury yield rise substantially above 4% to over 4.2% on Thursday and over 4.3% early Friday. We have viewed this 4%-level as a key level for equity valuations, and for growth equities in particular. We were encouraged by the equity markets’ resilience in the face of this surge in yields this week. In our judgement, the inability of USD to exceed last week’s levels – until late this week, before reversing lower — helped maintain the current equity rally through this week. The two-year-to-10-year Treasury yield spread becoming less inverted this week might have helped also to assuage fears of a severe recession. We are still hopeful that Treasury yields and USD are approaching their peaks, at least in the short term. We suppose that positive seasonal factors are helping to propel equity prices higher. Early this week, JPM noted that the amount of “cash on the sidelines” is at a 10-year high. High cash levels and negative sentiment along with “light positioning” also could be playing a positive role.
Deciphering What’s Priced In
As we highlighted in last week’s commentary, “we will continue to monitor financial market reactions to various types of news and changing assumptions in an effort to decipher what’s priced in, so that we could better take advantage of the market’s volatility. It was this approach that led to our high level of conviction that opening prices on Thursday [of last week] presented compelling risk/reward opportunities to purchase selected equities … for at least a significant bear market rally.” The positive stock price reactions to many companies’ “beats” versus lowered expectations supported the notion that excessive pessimism was priced in for selected securities. At this point, we make no assumptions in regard to future financial results.
Empire State Manufacturing Survey
Most of the economic data we analyzed this week was supportive of our hypothesis that the U.S. economy is slowing and that inflationary pressures are beginning to dissipate. The New York Fed’s Empire state manufacturing survey for October showed that business activity declined “modestly” in New York State. The labor market posted a small increase in employment and the workweek. After falling significantly over the prior three months, the prices paid index rose somewhat as prices received were “steady.” These price trends could lead to compressed margins. The index for future business conditions fell into negative territory. Additionally, the index for future new orders and shipments remained depressed. Employment was expected to continue increasing. Supply chain constraints were expected to ease as delivery times were expected to shorten.
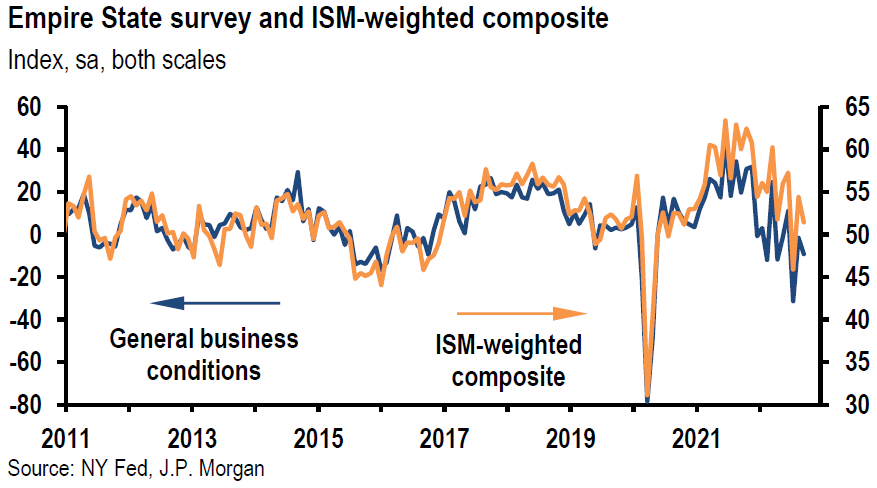
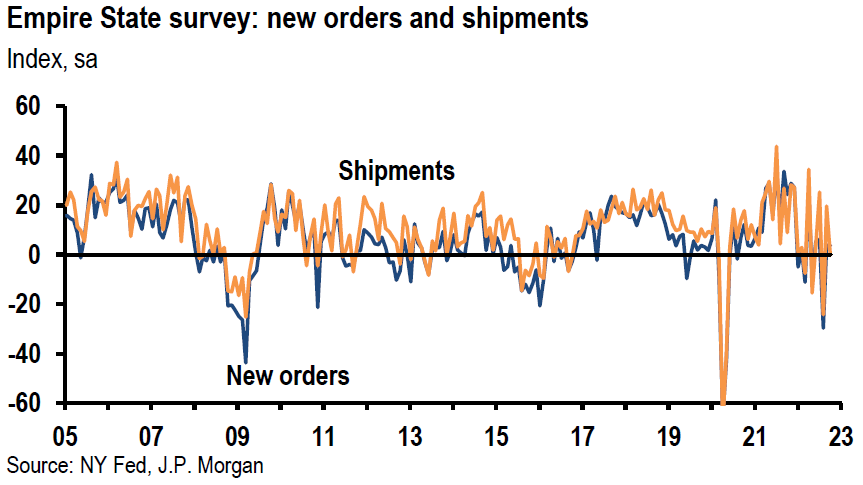
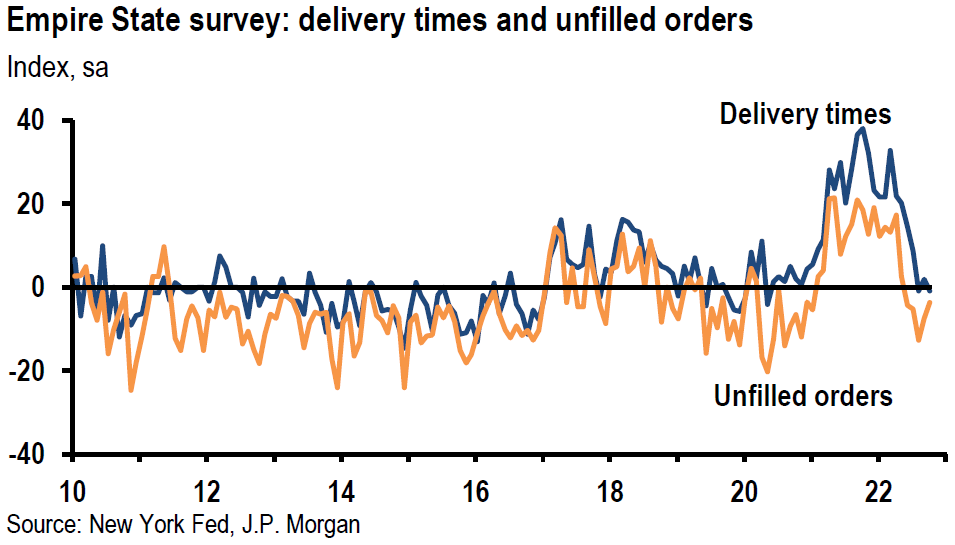
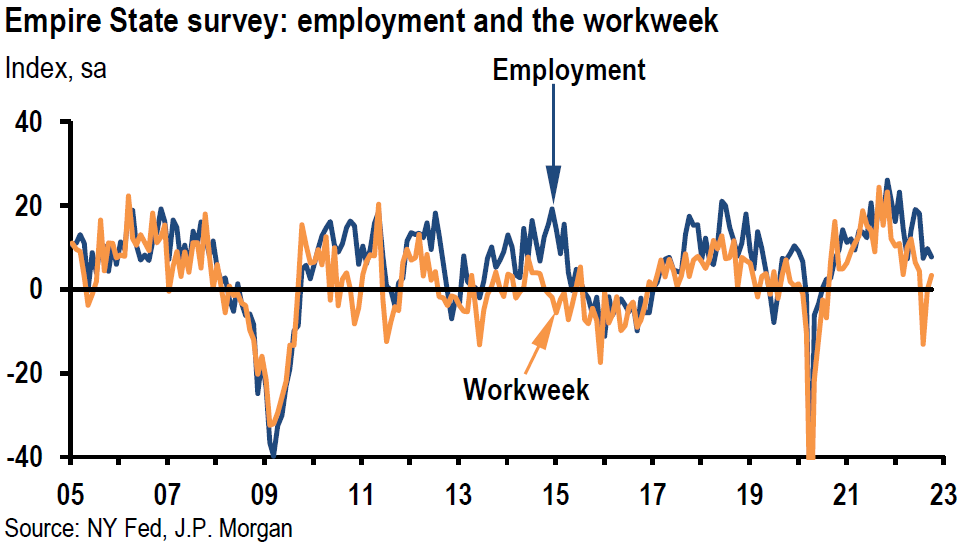
Source: JP Morgan, US: Empire State survey pushes lower in October (10-17-2022)
Business Leaders’ Survey (Service Firms in New York Area)
This October survey was conducted by the New York Fed as well and showed that business activity in the area’s service firms declined as headline business activity fell 21 points into negative territory down to -15.5. This was the lowest level since February 2021. Even as the business climate index fell further into negative territory, employment grew at a faster pace than in September. Wage increases remained widespread. Input prices held steady at elevated levels as prices received dropped somewhat – more margin pressure. The index for future business activity over the next six months fell 24 points to -7.9 and the index for future business climate dropped 27 points to -30.2. This was the first time in nearly two years that both of these measures were in negative territory.
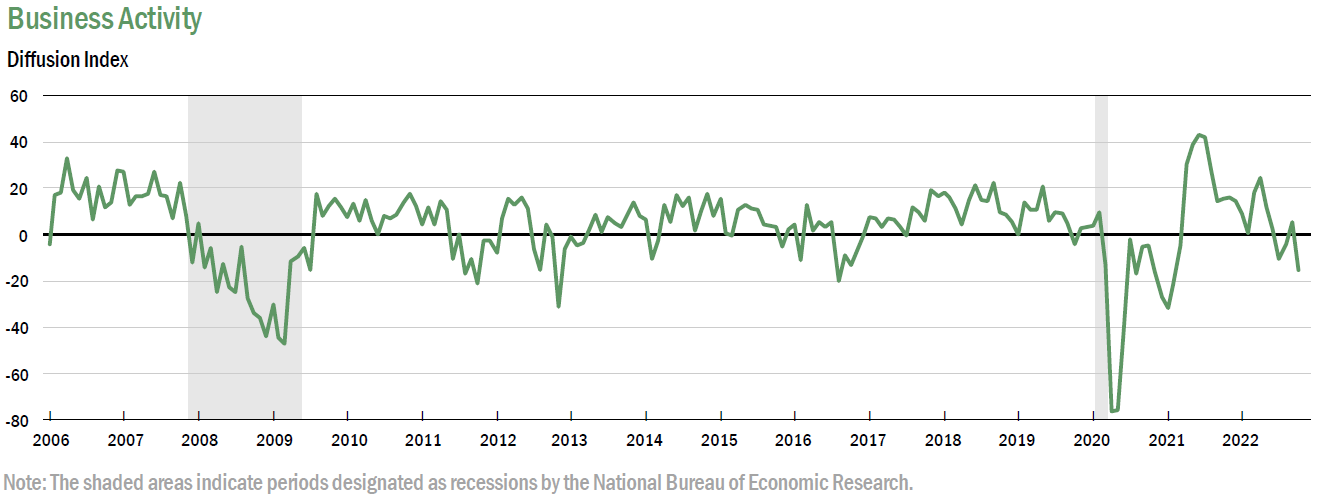
Source: Federal Reserve Bank of NY, October Business Leaders Survey (survey responses collected between 10-3-2022 to 10-11-2022)
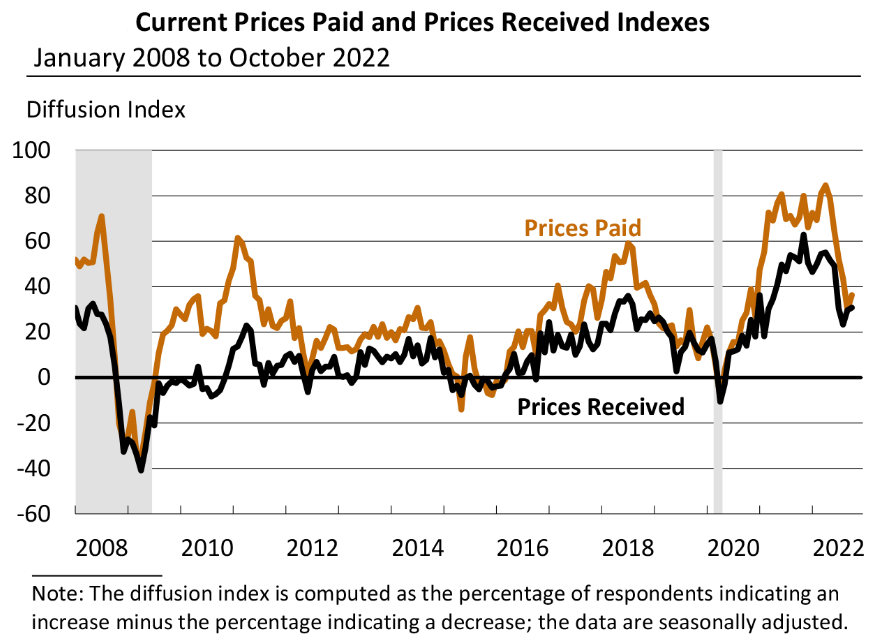
Philadelphia Fed Manufacturing Survey
The Philadelphia Fed October manufacturing index rose by a less-than-expected 1 point to a still-negative -8.7 level versus an expected -5. This was the fourth negative reading in the past five months. New orders rose 2 points but remained in negative territory at -15.9. Shipments were little changed as they remained at a low but positive level. Employment increased 16.5 points to 28.5 – more than offsetting the decline in September. However, the future employment index fell 10 points to 12.2. Prices paid increased 6.5 points to 36.3, but were 55 points lower between April and September. Prices received rose 1.2 points to 30.8, suggesting increased margin compression in September. The index for future activity fell 3.9 points to an even more-negative reading of -14.9, which is the fifth consecutive negative reading. In summary, this survey indicated that firms generally expect an overall decline in business activity over the next six months.
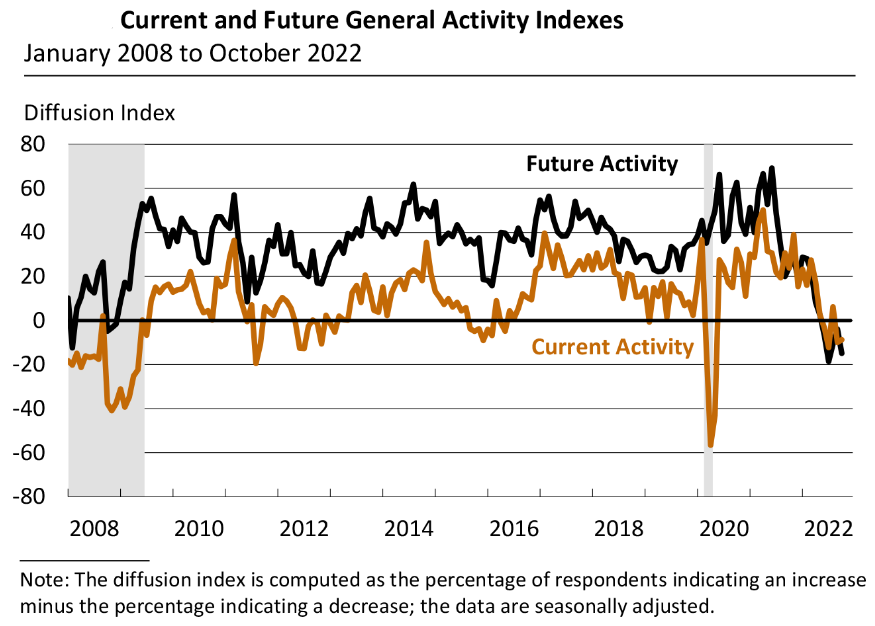
Source: Federal Reserve Bank of Philadelphia, October 2022 Manufacturing Business Outlook Survey (survey responses collected from 10-10-2022 to 10-17-2022)
U.S. Industrial Production and Capacity Utilization Better than Expected
The Fed released the September industrial production and capacity utilization report this week. Industrial production increased 0.4% month-over-month (m/m) in September compared to +0.1% expected and was +5.3% y/y. The annual increase was the largest since April and exceeded the upwardly revised +3.9% y/y August advance. Manufacturing output has been variable on a monthly basis lately, as the recent monthly gains occurred after back-to-back declines in May and June. The Q3 manufacturing output growth seasonally adjusted annual rate (saar) of 2.0% was the slowest quarterly increase since the early stages of the pandemic. We would characterize the manufacturing sector as losing momentum in a jagged fashion. We assume that the strong USD was weighing on manufacturing. Capacity utilization rose 0.2% m/m in September to 80.3%. This rate was 0.7% above the 1972 to 2021 long-term average.
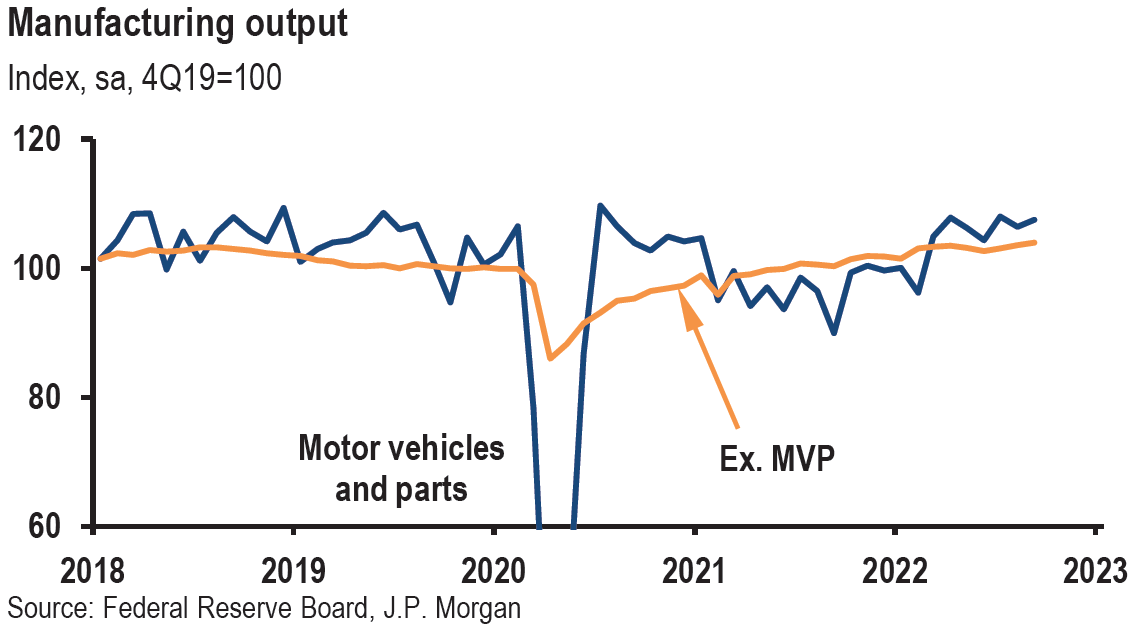
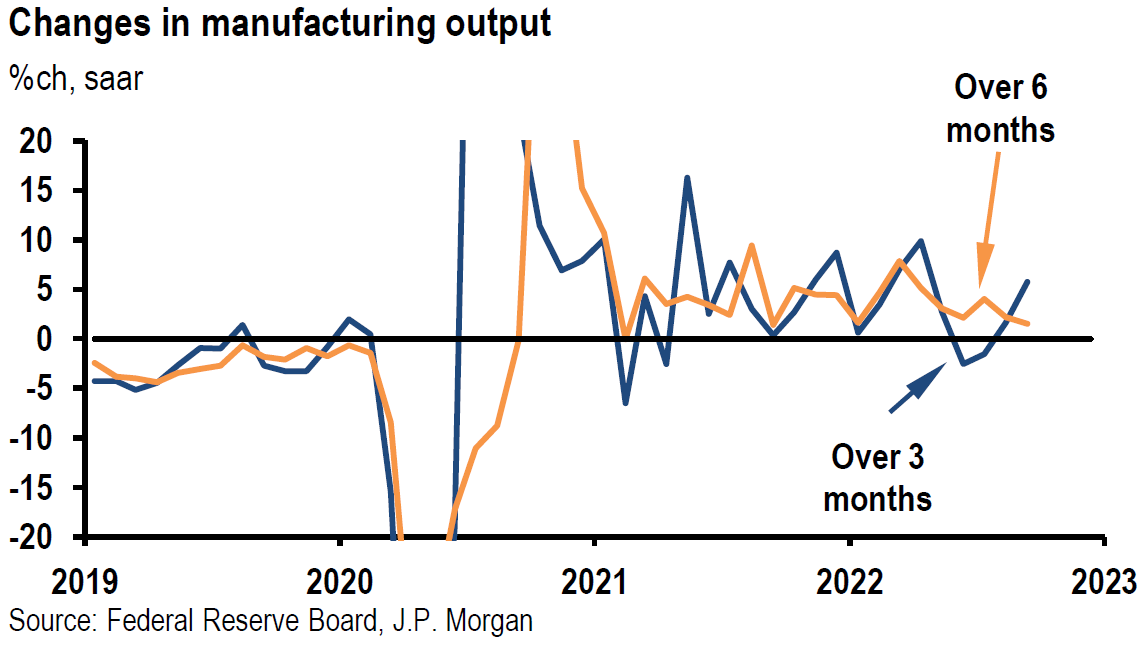
Source: JP Morgan, US: Manufacturing output has a solid gain in September (10-18-2022)
Conference Board Leading Indicators
After remaining unchanged in August, the Conference Board’s Leading Economic Index (LEI) decreased 0.4% in September to 115.9. The LEI was 2.8% lower for the six months between March and September, versus a gain of 1.4% over the previous six months. The weaknesses in the leading economic indicators were widespread. “Amid higher inflation, slowing labor markets, rising interest rates, and tighter financial conditions, the Conference Board forecasts real GDP growth will be 1.5% y/y in 2022, before slowing further in the first half of next year.” The senior director of economics at the Conference Board saw that the persistent downward trajectory [of LEI] in recent months suggests a recession is “increasingly likely by year end.”
Weaker Housing Data
National Association of Home Builders (NAHB) Survey – Lower
The NAHB housing market index fell for the tenth straight month to 38 in October versus an expected 43 level. With the exception of the beginning of the pandemic, this was the lowest reading since August 2012 and about half the level of six months prior. Rising mortgage rates, materials bottlenecks and elevated home prices all contributed to this disappointing level. The NAHB chairman commented: “high mortgage rates approaching 7% have significantly weakened demand, particularly for first-time and first-generation prospective home buyers.” Current sales conditions fell 9 points to 45, sales expectations for the next six months dropped 11 points to 35 and traffic of prospective buyers declined 6 points to 25. In summary, homebuilder sentiment was rather depressed.
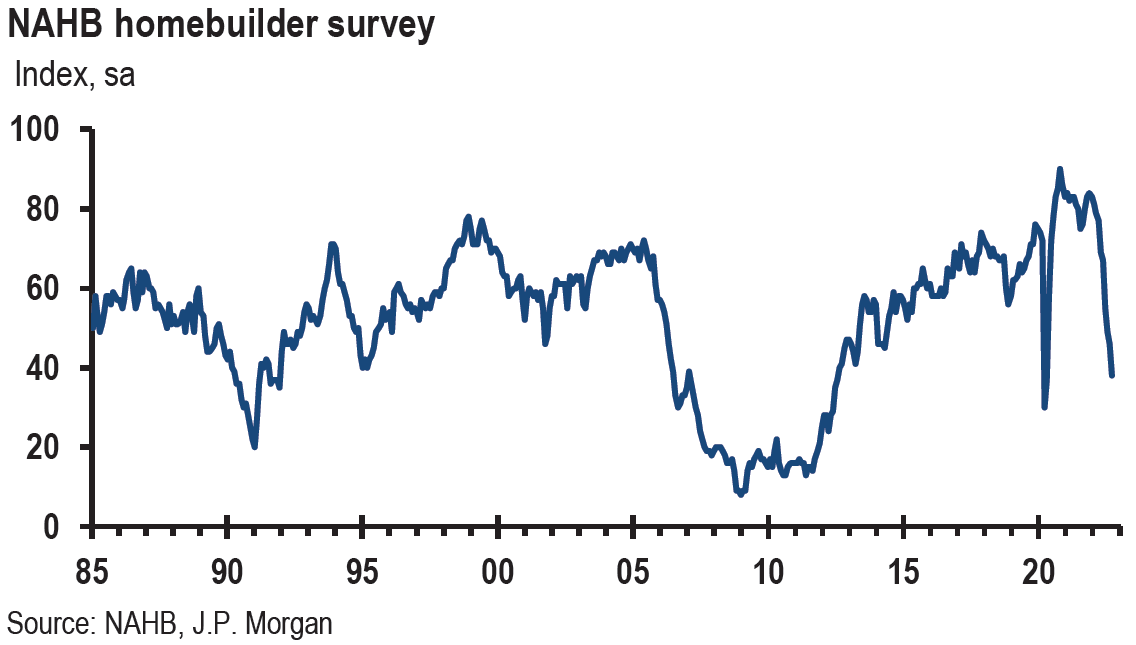
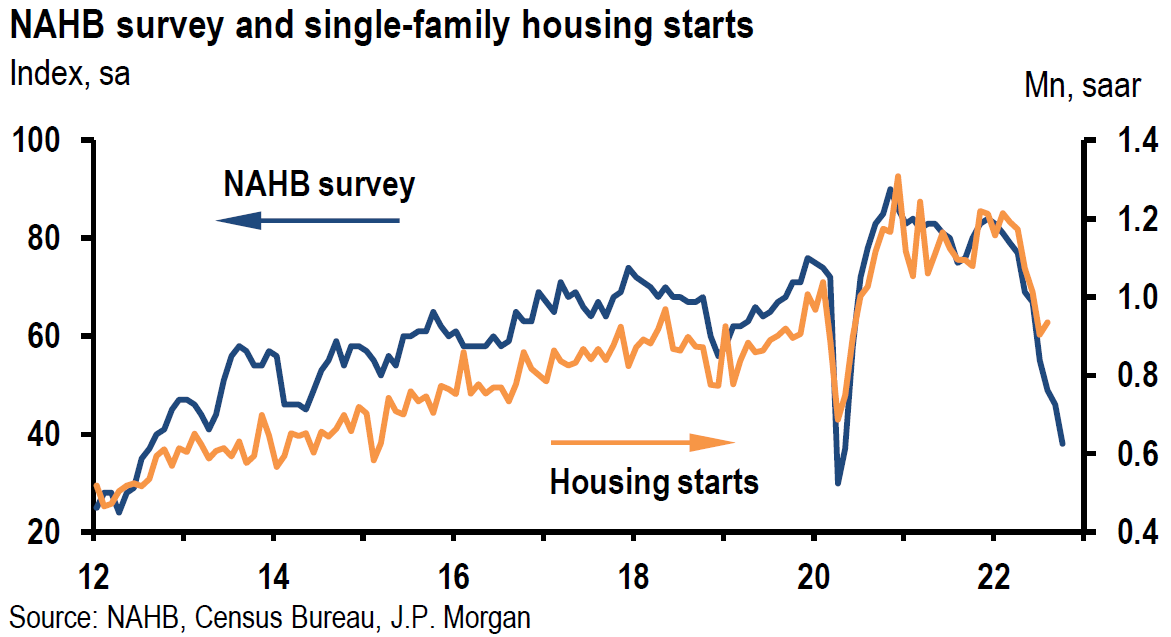
Source: JP Morgan, US: NAHB survey keeps dropping off (10-18-2022)
Housing Starts and Permits – Lower for Single Family Units
According to the U.S. Census Bureau, housing starts for September, dropped 8.1% m/m versus an expected decrease of 7.2%. The more volatile multi-family starts were 13.2% lower while single-family starts fell 4.7%. Building permits rose 1.4% versus an expected 0.8% increase. Multi-family permits rose 7.8%, while the more important single-family permits were 3.1% lower. Single-family starts dropped 18.5% y/y and permits were 17.3% lower y/y.
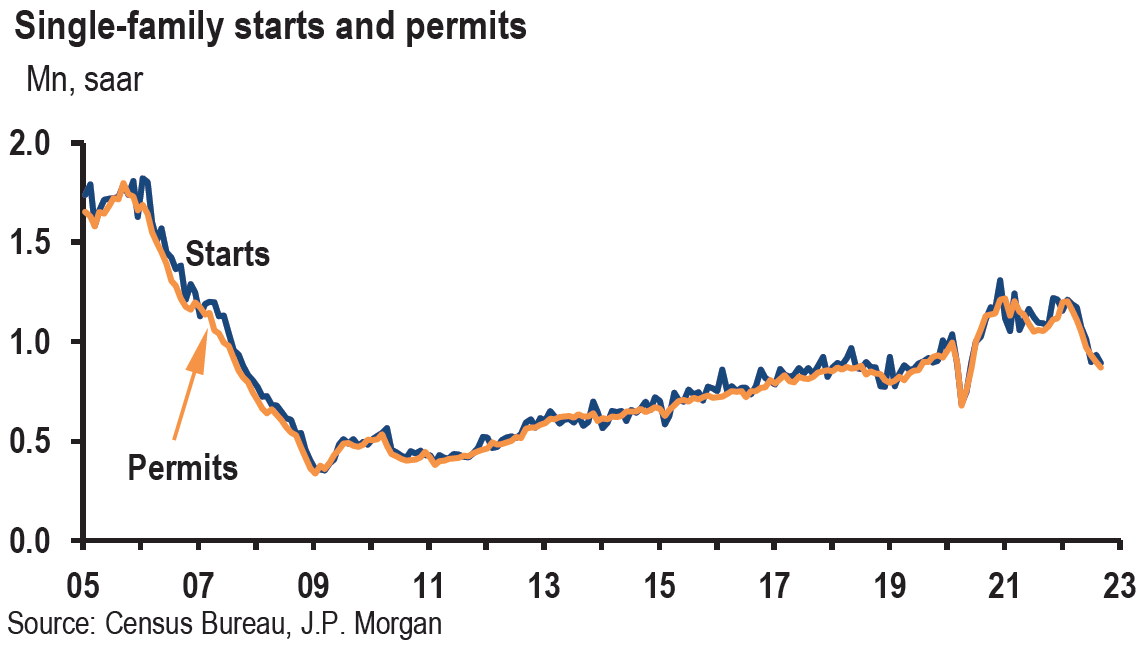
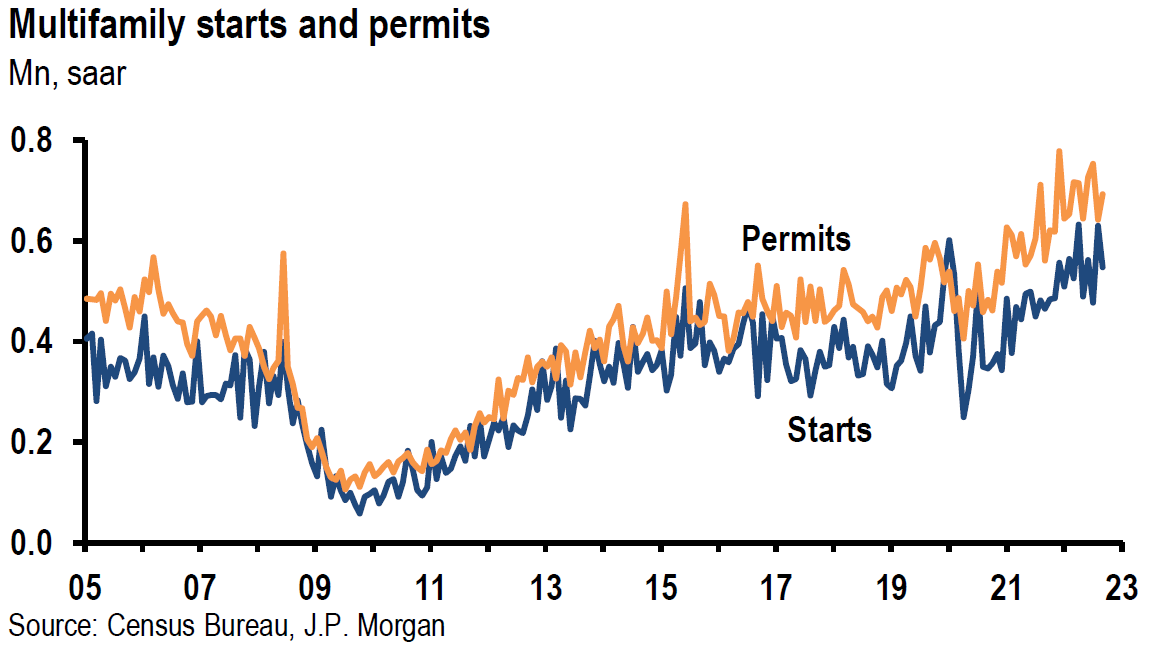
Source: JP Morgan, US: Single-family starts and permits decline again (10-19-2022)
Existing Home Sales – Lower
According to the National Association of Realtors, existing home – previously owned – sales fell 1.5% m/m to a ten-year low in September as sharply higher mortgage rates appeared to be the primary cause of an abrupt slowdown in the housing market. This was the eighth consecutive month of decreasing sales m/m. The September drop in sales was 23.8% y/y. Other than the May 2020 decline, September home sales were at the slowest pace since September 2012. Housing inventory dropped to 1.25 million units at September’s end, which was 0.8% lower y/y. At the current sales pace this was 3.2 months of inventory compared to a six-month inventory level that has been considered more “balanced.” Existing home sales have been falling since early this year. Between February and July, the average monthly drop in sales was about 5%. The median sales price of an existing home was 8.4% higher when compared to September 2021. However, prices have begun to drop recently m/m after peaking in June.
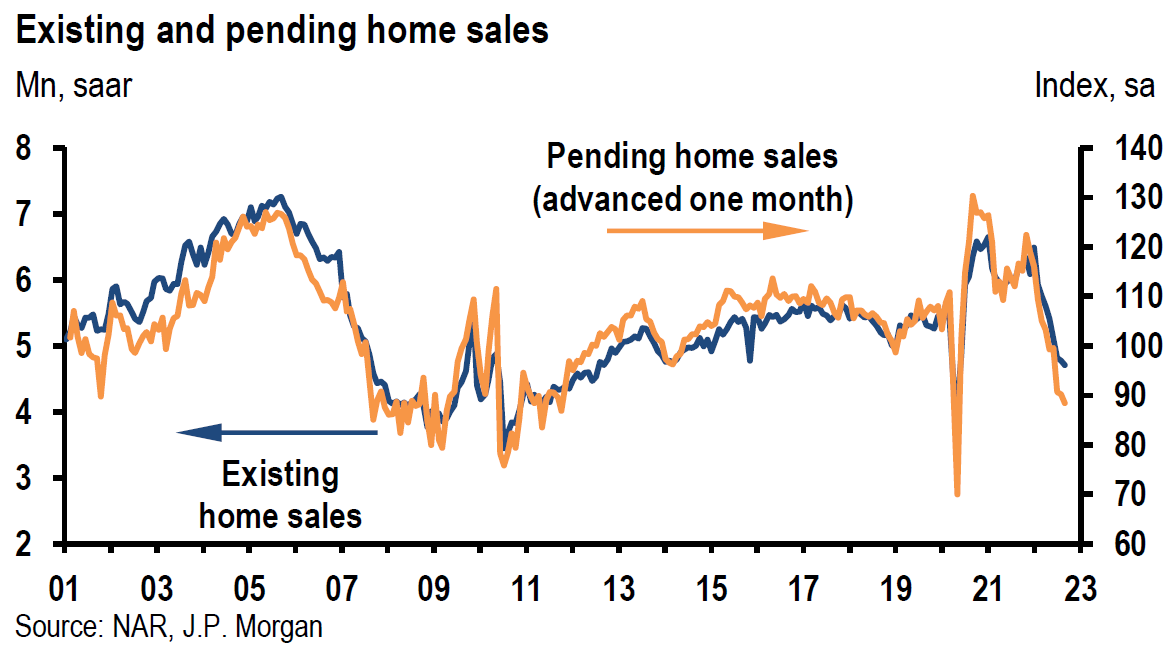
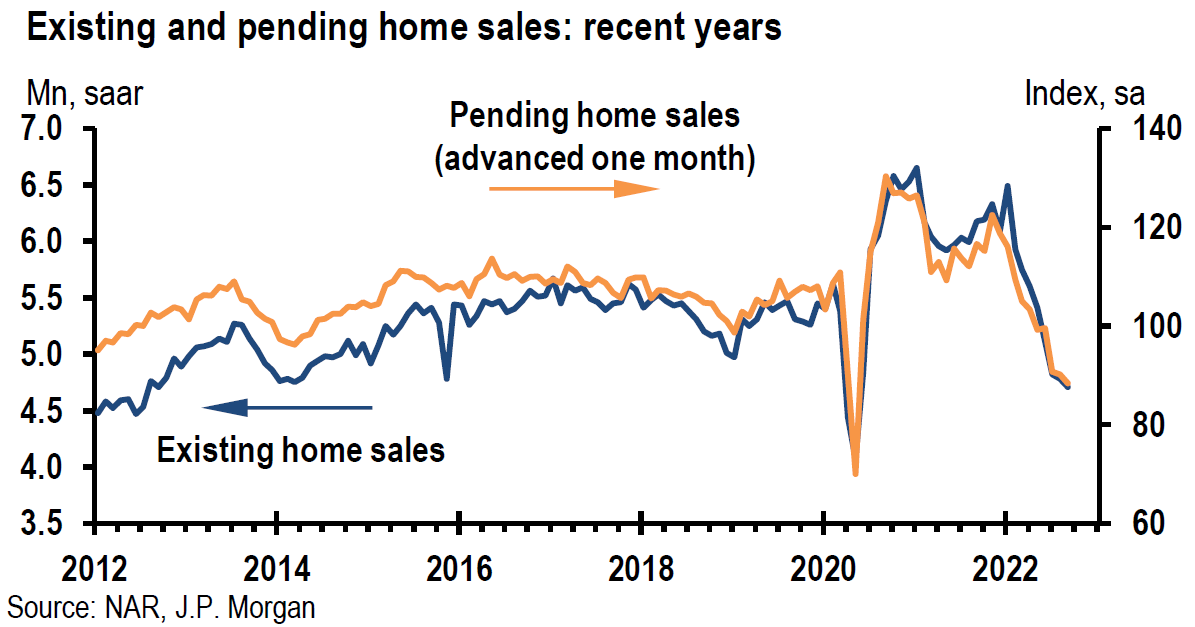
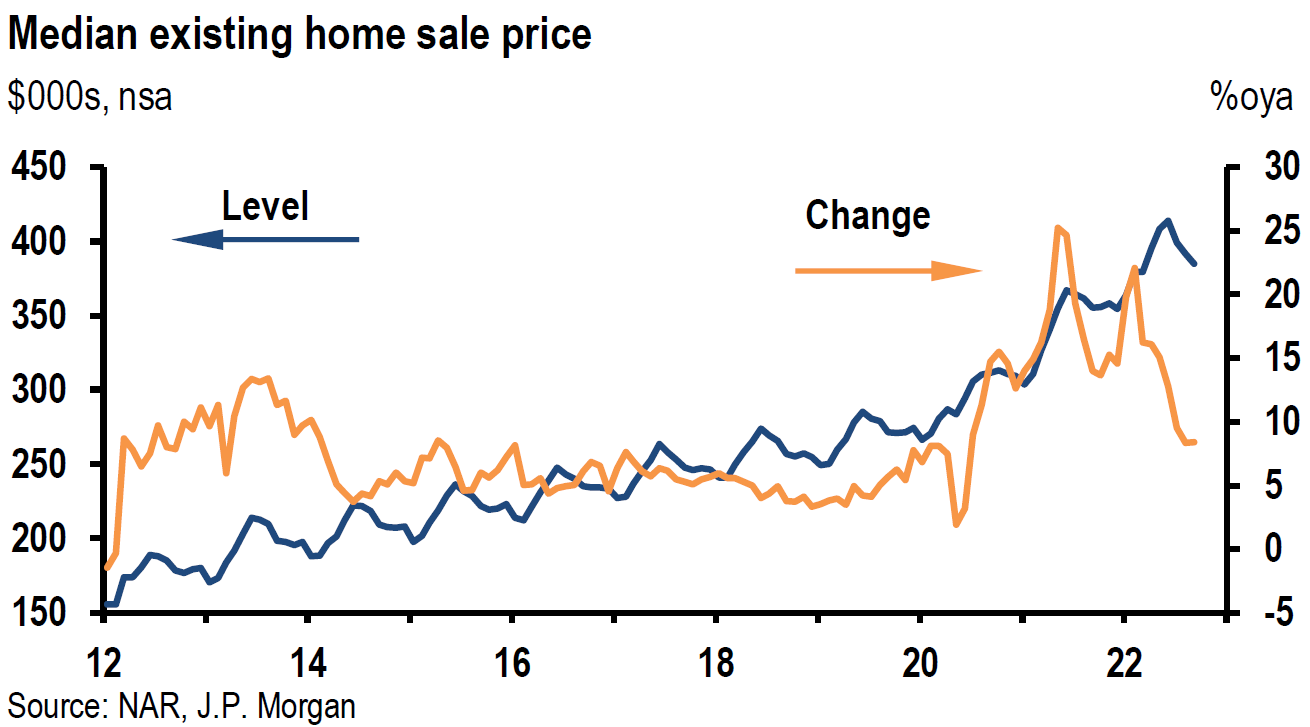
Source: JP Morgan, US: Existing home sales decline again (10-20-2022)
Initial and Continuing Unemployment Insurance Claims
For the week that ended October 15, initial jobless claims declined by a more-than-expected 12,000 to 214,000. Continuing claims for the week that ended October 8, increased by a larger-than-expected 21,000 to 1.385 million. As we have highlighted in our prior commentaries, we suspect that these low initial jobless claims overstate the tightness of the U.S. labor market since many employers have found it challenging to hire and retain the desired workers. It appears that many employers would rather retain a number of “excess” workers during a much anticipated recession to the extent they are able to do so.
Fed’s Beige Book
The Fed’s Beige book is a compilation of anecdotal evidence on current economic conditions from the twelve Fed Districts. It is published eight times per year and describes the economic changes from the prior report. The October report revealed that four Districts noted flat economic activity and two noted declines “with slowing or weak demand attributable to higher interest rates, inflation and supply disruptions.” Travel and tourist activity rose “strongly,” boosted by continued strength in leisure and a pickup in business travel. “Manufacturing activity held steady or expanded in most Districts in part due to easing in supply chain disruptions.” Rising mortgage rates and elevated house prices were cited as the cause of weakening single family starts and sales. Bankers in most Districts reported declines in loan volumes. “Outlooks grew more pessimistic amidst growing concerns about weakening demand.” One of the Fed’s primary goals is to drive demand lower. Although employment continued to rise at a “modest to moderate pace,” several Districts reported a “cooling in labor demand.” Some Districts noted that businesses were hesitant to add to payrolls “amid increased concerns of an economic downturn.” Half of the Districts noted “some easing of hiring and/or retention difficulties” even as the labor market remained “tight.” Contacts expected wage growth to continue “as higher pay remains essential for retaining talent in the current environment.” Significant input price increases were reported in a variety of industries. Growth in selling prices were characterized as “mixed.” Some contacts noted “solid pricing power over the past six weeks, while others said passthroughs were becoming more difficult as customers push back.” Many contacts expected price increases to “generally moderate.”
Bottom Line
For the time being, we are maintaining our basic investment approach as expressed in last week’s commentary. We continue to prefer high quality big cap stocks that offer good balance sheets, as well as relatively stable cash flows and profit margins. A well-diversified portfolio for long term investors will be most likely the preferred approach.
We were encouraged generally by stock price reactions to “good” news. It appears that overly pessimistic views were priced in relative to many Q3 earnings reports. Negative price reactions to “bad” news seemed to have limited spillover effects into the general equity markets. We will continue to monitor financial market reactions to various types of news and changing assumptions in an effort to decipher what’s priced in so that we could better take advantage of the market’s volatility. It was this approach that led to our high level of conviction that opening equity prices on Thursday of last week presented compelling risk/reward opportunities to purchase selected equities.
In our recent commentaries we viewed a substantial increase in the 10-year Treasury yield as a headwind for stock valuations, and in particular in regard to growth stocks. The 10-year Treasury yield traded above 4.3% before retreating somewhat. The USD also retreated from its Friday highs along with Treasury yields. It appears that, everything else being equal, U.S. equities can appreciate – at least in the short term – on any indication that we could be close to a top in 10-year Treasury yields and to a top in USD. We continue to expect the Fed to raise the federal funds rate by 75 basis points (bps) at its November meeting and by 50 bps in December. We acknowledge a possible 75 bps hike in December.
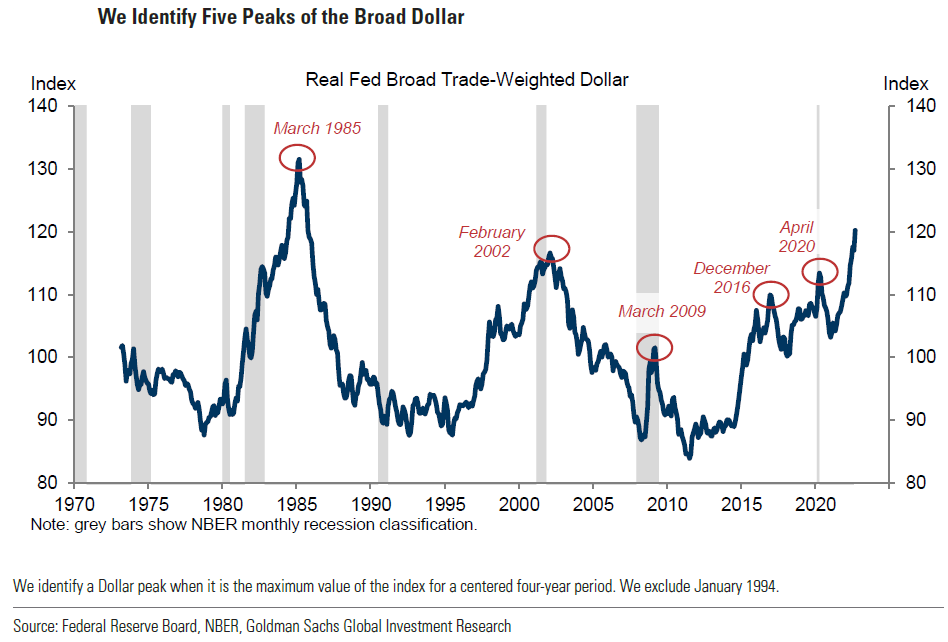
Source: Goldman Sachs Research, When the Dollar Peaks (Trivedi/Bhushan) (10-20-2022)
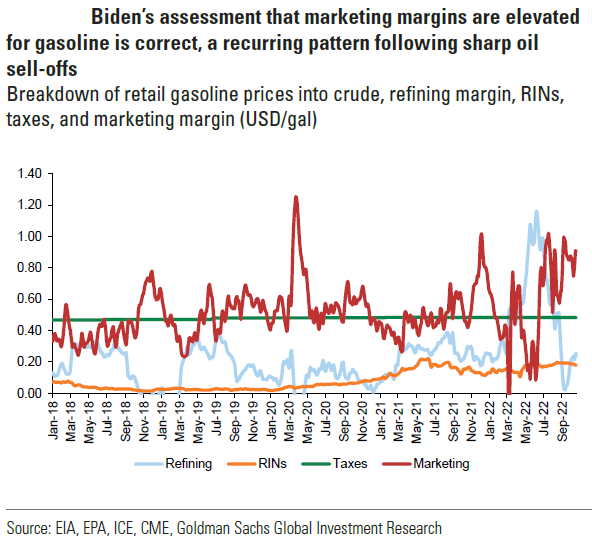
Source: Goldman Sachs Research, US energy policy responses pose limited downside from current price levels (10-20-2022)
Definitions
Federal Funds Rate – The term federal funds rate refers to the target interest rate set by the Federal Open Market Committee. This target is the rate at which commercial banks borrow and lend their excess reserves to each other overnight.
Fedspeak – Fedspeak is a technique for managing investors’ expectations by making deliberately unclear statements regarding monetary policy to prevent markets from anticipating, and thus partially negating, its effects.
Inverted Yield Curve – An inverted yield curve describes the unusual drop of yields on longer-term debt below yields on short-term debt of the same credit quality. Sometimes referred to as a negative yield curve, the inverted curve has proven in the past to be a relatively reliable lead indicator of a recession.
Hawkish – Hawks are seen as willing to allow interest rates to rise in order to keep inflation under control, even if it means sacrificing economic growth, consumer spending, and employment.
Market Liquidity – Market liquidity refers to the extent to which a market, such as a country’s stock market or a city’s real estate market, allows assets to be bought and sold at stable, transparent prices.
U.S. Dollar Index (DXY) – The U.S. dollar index is a measure of the value of the U.S. dollar relative to a basket of foreign currencies.
Industrial Production Index (IPI) – The industrial production index is a monthly economic indicator measuring real output in the manufacturing, mining, electric, and gas industries, relative to a base year.
Capacity Utilization Rate – Capacity utilization rate measures the percentage of an organization’s potential output that is actually being realized. The capacity utilization rate of a company or a national economy may be measured in order to provide insight into how well it is reaching its potential.
The NAHB/Wells Fargo Housing Market Index (HMI) – The NAHB/Wells Fargo Housing Market Index is a monthly sentiment survey of members of the National Association of Home Builders. The index measures sentiment among builders of U.S. single-family homes and is a widely watched gauge of the U.S. housing sector.
Housing starts – Housing starts are a measure of new residential construction and are considered a key economic indicator.
Housing Permits – Housing permits are a type of authorization that must be granted by a government or other regulatory body before the construction of a new or existing home can legally occur.
Existing home sales – Existing home sales transaction data measure and report sales and prices of existing single-family homes, condos, and co-ops for the United States, and is broken down by region: West, Midwest, South, and Northeast.
Initial Unemployment Insurance Claims – Initial claims are new jobless claims filed by U.S. workers seeking unemployment compensation, included in the unemployment insurance weekly claims report.
Continuing Claims – Continuing claims track the number of U.S. residents filing for ongoing unemployment benefits in a given week. Continuing claims measure ongoing unemployment benefits, which is in contrast to initial claims, which track new filings for benefits.
Fed’s Beige Book – The Beige Book is a qualitative review of economic conditions drawing on reports from 12 district banks. It is published eight times annually before meetings of the Federal Open Market Committee, which uses the results in its planning and decision-making processes.
Growth Stock – A growth stock is any share in a company that is anticipated to grow at a rate significantly above the average growth for the market. These companies generally do not pay dividends, instead growth stocks tend to reinvest any earnings they accrue in order to accelerate growth in the short term.
Empire State Manufacturing Index – The NY Empire State Index refers to the result of a monthly survey of manufacturers in New York state. The survey is conducted by the Federal Reserve Bank of New York. The headline number for the index refers to the main index of the survey, which summarizes general business conditions in New York state. The index is widely watched for insights into the state and direction of manufacturing in New York state.
Leading Economic Indicators Conference Board – The components of The Conference Board Leading Economic Index for the U.S. include:
- Average weekly hours in manufacturing – The average hours worked per week by production workers in manufacturing industries tend to lead the business cycle because employers usually adjust work hours before increasing or decreasing their workforce.
- Average weekly initial claims for unemployment insurance – The number of new claims filed for unemployment insurance are typically more sensitive than either total employment or unemployment to overall business conditions, and this series tends to lead the business cycle.
- Manufacturers’ new orders for consumer goods and materials – These goods are primarily used by consumers. The inflation-adjusted value of new orders leads actual production because new orders directly affect the level of both unfilled orders and inventories that firms monitor when making production decisions.
- ISM Index of New Orders – This index reflects the levels of new orders from customers. As a diffusion index, its value reflects the number of participants reporting increased orders during the previous month compared to the number reporting decreased orders, and this series tends to lead the business cycle.
- Manufacturers’ new orders for nondefense capital goods excluding aircraft orders – This index, combing with orders from aircraft (in inflation-adjusted dollars) are the producers’ counterpart to consumer goods and materials.
- Building permits for new private housing units – The number of residential building permits issued is an indicator of construction activity, which typically leads most other types of economic production.
- S&P 500 Index of Stock Prices – The Standard & Poor’s 500 stock index reflects the price movements of a broad selection of common stocks traded on the New York Stock Exchange.
- Leading Credit Index – This index is consisted of six financial indicators: 2-years Swap Spread (real time), LIBOR 3 month less 3 month Treasury-Bill yield spread (real time), Debit balances at margin account at broker dealer (monthly), AAII Investors Sentiment Bullish (%) less Bearish (%) (weekly), and Senior Loan Officers C&I loan survey
- Interest rate spread (10-year Treasury bonds less federal funds rate) – The spread or difference between long and short rates is often called the yield curve.
- Average consumer expectations for business condition – This index reflects changes in consumer attitudes concerning future economic conditions.
IMPORTANT DISCLOSURES
The views and opinions included in these materials belong to their author and do not necessarily reflect the views and opinions of NewEdge Capital Group, LLC.
This information is general in nature and has been prepared solely for informational and educational purposes and does not constitute an offer or a recommendation to buy or sell any particular security or to adopt any specific investment strategy.
NewEdge and its affiliates do not render advice on legal, tax and/or tax accounting matters. You should consult your personal tax and/or legal advisor to learn about any potential tax or other implications that may result from acting on a particular recommendation.
The trademarks and service marks contained herein are the property of their respective owners. Unless otherwise specifically indicated, all information with respect to any third party not affiliated with NewEdge has been provided by, and is the sole responsibility of, such third party and has not been independently verified by NewEdge, its affiliates or any other independent third party. No representation is given with respect to its accuracy or completeness, and such information and opinions may change without notice.
Investing involves risk, including possible loss of principal. Past performance is no guarantee of future results.
Any forward-looking statements or forecasts are based on assumptions and actual results are expected to vary from any such statements or forecasts. No assurance can be given that investment objectives or target returns will be achieved. Future returns may be higher or lower than the estimates presented herein.
An investment cannot be made directly in an index. Indices are unmanaged and have no fees or expenses. You can obtain information about many indices online at a variety of sources including: https://www.sec.gov/fast-answers/answersindiceshtm.html or http://www.nasdaq.com/reference/index-descriptions.aspx.
All data is subject to change without notice.
© 2024 NewEdge Capital Group, LLC


