


Honey, it’s in the stars
And you’re my everything from here to Mars
“Here to Mars”, Coheed and Cambria
For the last 25 years, Coheed and Cambria have been releasing progressive rock concept albums that follow the story of The Amory Wars, a series of science fiction comics and graphic novels created by Coheed frontman Claudio Sanchez.
All of Coheed’s albums follow this galactic story arc except for one, 2015’s The Color Before the Sun, and though this album is not part of the Amory epic, Claudio didn’t stray far from his space-based themes.
Claudio wrote the song “Here to Mars” as a love song to his wife and describes it as such:
“I wanted the song to feel epic and explosive, and distant like a journey. Some people might get literal with it and say, ‘You only love your wife to Mars? But that’s only the neighboring planet of our solar system – it’s not really that far away!’ But to me, Mars might as well be the other end of the universe because I’m never going there.”
Never going to Mars?
Not if Elon Musk (and the one billion shares of SpaceX he could receive if SpaceX reaches a $7.5 trillion valuation and establishes a permanent settlement of one million people on Mars) has anything to do with it!
Using a sci-fi metal soundtrack for today’s market feels particularly appropriate, as any reader of science fiction knows that part of enjoying the genre is the provocation to dream about the future (whether it is utopian or dystopian) and the provocation to believe the unbelievable, at least for a brief time while reading.
Dreaming about the future and believing the unbelievable has been the market’s disposition in 2026, as evidenced by huge rallies in speculative, no-earnings, and even no-revenue stocks tied to today’s dominant themes like AI, space, and even AI in space. For example, the NASA ETF rallied over 70% since its launch in early April, drawing in $1.6 billion of AUM from aspiring armchair astronaut.
Of course, there have also been huge rallies in parts of the market that are making the future (again, utopian or dystopian based on your temperament) happen today, such as the semiconductor and tech hardware equipment stocks that are directly benefitting from the rapid buildout of AI infrastructure.
This capex for the AI future is resulting in soaring earnings, margins, and stock prices for suppliers to that infrastructure buildout. In the last two months, the tech hardware industry group is up 36% and the semiconductor industry group is up 83%. Combined, those two groups now make up 30% of the overall S&P 500. But back to the celestial dreamers, the distinctly speculative and low-quality nature of the rally in the last two months should be flagged and monitored closely, as it is an important symptom of broader risk appetite, sentiment, and positioning.
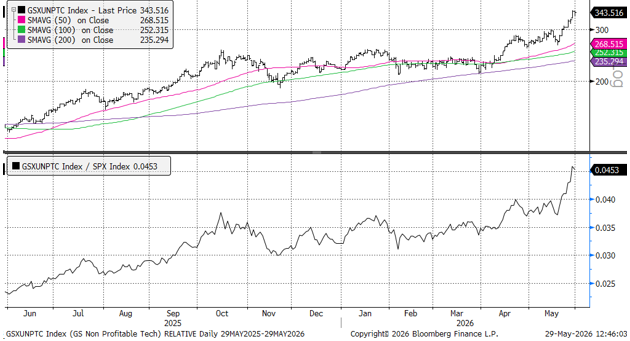
The Goldman Sachs Unprofitable Tech Index is a great way to track this speculative trade (it tracks shares of “story stocks” that have no earnings but the prospect for rapid future growth). This index is up +60% in the last two months and has rallied +15% in the last week alone.
Goldman Sachs Unprofitable Tech Index Absolute and Relative to the S&P 500
Source: Bloomberg, NewEdge Wealth, 5-29-26
We can also see this speculative bid in broader indices, where the Russell 2500, a SMID cap index, has been driven higher in 2026 by a cohort of low-to-no earnings stocks. Consider the following lineup of statistics from our Jay Peters (as of 5-28-26):
• Russell 2500 is up 20% thus far in Q2, with 10 stocks accounting for nearly a third of the index return. These 10 are all AI or space related names and are up an average of 125%
• Top 10 contributors trade at an average FP/E of 51x and average FP/S of 15x
• 75 companies in the index are up more than 100% in 2Q. The average FP/E (forward price to earnings multiple) of this group is 150x, and half of this group has negative EPS. Those that do have EPS trade at an average of 180x FP/E
• Contrast this with the names in the index that are profitable and trade at a discount to the index only up +8% on average in 2Q
Investors seem to be evoking Claudio’s lyrics from the bridge of “Here to Mars” singing: “Pardon me, I think I am going out of my head and into the worst”.
“I’m Leaving You With This Here, Ok?”: SpaceX IPO
The total encapsulation of this moment of science-fiction future dreaming is the upcoming IPO of SpaceX.
Only in a risk-on market like today’s could you see the potentially largest IPO in history (not inflation adjusted though, Saudi Aramco still holds that crown) come from a company that could trade at 80-100x forward sales on a sales base that has been growing roughly 30%, is still loss making (a $4.9B loss in 2025, a $4.3B loss in just 1Q26), has published a $28.5 trillion estimated total addressable market (or TAM) for its businesses, and has heavily incentivized its leadership to pursue fantastic(al) but likely loss making pursuits, such as terraforming Mars.
If we make it to Mars, Claudio may have to rewrite the song as “Here to Jupiter”, but the rhyme scheme is arguably tougher with this update.
Bringing us back down to earth for a moment, the effort to which exchanges and indices are going to make this blockbuster IPO a success is also notable, such as Nasdaq putting a multiplier on the weight it will give SpaceX in its index because the float (or the percentage of the market cap that is freely traded) will be so small, or the S&P 500 relaxing its profitability rule to include SpaceX in the index, or S&P and Russell including the stock after only five days of public trading.
The dynamics around non-economic demand from indices for shares of SpaceX, contrasted with the relatively small initial supply of shares, have sparked intense debates as to how the stock could trade in its initial days/months, regardless of its fundamentals.
“Give Me a Second Chance, I Know I Could Be Your Better Half”: Reminisces of 2020
The rally in low quality, low-to-no earnings, high valuation, speculative parts of the market is reminiscent of 2020, when we saw a COVID-era liquidity and stimulus fueled rally in unprofitable stocks and a wave of IPOs (mostly low quality SPACs that have since performed terribly) to capitalize on this ravenous risk appetite.
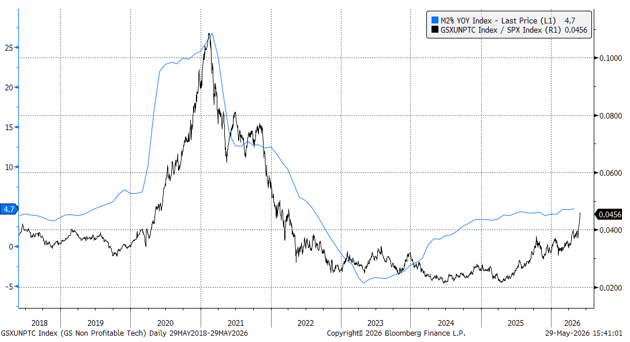
The big difference between today and 2020 is magnitude, with the chart below showing the relative performance of the Goldman Unprofitable Tech vs. S&P 500, alongside the YoY growth of M2 Money Supply (a very rough measure of liquidity). We would not expect in any “normal” circumstance to see a repeat of the 25% money supply growth from 2020 (alongside all of the “stimmy” checks fueling individual investor trading), but we still have seen a broadly supportive liquidity environment that helps to grease the wheels (or fuel the rockets?) of this speculative rally.
Source: Bloomberg, NewEdge Wealth, 5-29-26
Nonprofitable Tech vs. S&P 500 and M2 Money Supply Growth YoY %
“Dear Darling, I Hope I’m Being Clear”: So Is This a Bubble?
When comparing today’s market to 2020, it raises the question of whether or not what we are seeing is a bubble. This term gets bandied about freely, but we find the most helpful framework is from Quinn and Turner’s wonderful book, Boom and Bust, where they frame the conditions for a boom as the “bubble triangle” (taking the framework from the “fire triangle” concept that is used to understand forest fires).
They identify three key conditions, plus a spark, for a speculative bubble to emerge:
• Marketability: how easy it is for an asset to be bought and sold, with bubbles emerging at times when marketability improves (such as the telegram/telephone-based trading in the 1920s and internet-based trading in the 1990s). Arguably, app-based trading contributed to the 2020 bubble, while we could argue that today’s proliferation of thematic and leveraged ETFs (Todd Sohn at Strategas counts 41 AI based ETF launches in the last two months alone!), along with exploding options use and ETFs putting private assets in traded vehicles (as daft as that may be) as signs of today’s change in marketability.
• Money/Credit: loose lending, capital, and liquidity conditions make it easier for investors to buy riskier assets. Today’s 5% money supply growth and nearly 10% commercial bank lending growth is adding fuel to this speculative rally. Today’s higher interest rates are fascinating given still-loose financial conditions, which argues that “neutral rate” for Fed policy is higher, at least from the market’s perspective.
• Speculation: psychological and behavioral dynamics that draw more individuals into trying to “flip” trades in the market (buying with the intention of selling in the near term at a higher price), versus looking at underlying fundamentals.
• The Spark: The ignition for a speculative bubble comes from an exciting new technology or a change government policy. Today’s spark is clearly excitement around AI, space, and quantum technologies.
A segment from Boom and Bust describes the “spark” and is a helpful reminder that today’s tech-driven market is following old historical patterns:
Technological innovation can spark a bubble by generating abnormal profits at firms that use the new technology, leading to large capital gains in their shares. These capital gains then attract the attention of momentum traders, who begin to buy shares in the firms because their price has risen. At this stage, many new companies that use (or purport to use) the new technology often go public to take advantage of the high valuations. While valuations may appear unreasonably high to experienced observers, they often persist for two reasons. First, the technology is new, and its economic impact is highly uncertain. This means that there is limited information with which to value the shares accurately. Second, excitement surrounding technology leads to high levels of media attention, drawing in further investors. This is often accompanied by the emergence of a ‘new era’ narrative, in which the world-changing magic of the new technology renders old valuation metrics obsolete, justifying very high prices. – Quinn and Turner
“Distorted, a Figure Set in Trend”: So, is This 1999?
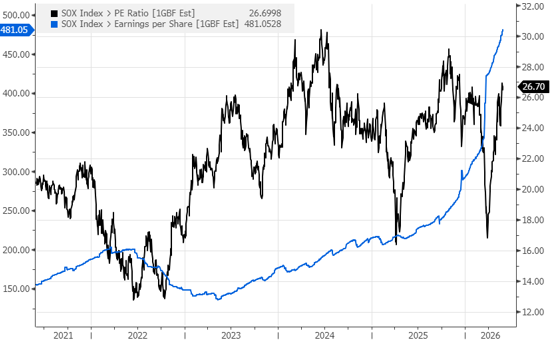
There is a lot of pushback to calling today’s market a bubble or comparing it to the 1990s. After all, earnings growth has been so explosive for AI-infrastructure companies that valuations have fallen for these areas and even the broader market over the last 9 months. The chart below shows this dynamic with semiconductor earnings experiencing an unprecedented jump higher, but valuations still down from recent highs (even as the stock returns have been extraordinary).
SOX Semiconductor Index 12 Month Forward PE Ratio and EPS
Source: Bloomberg, NewEdge Wealth, 5-29-26
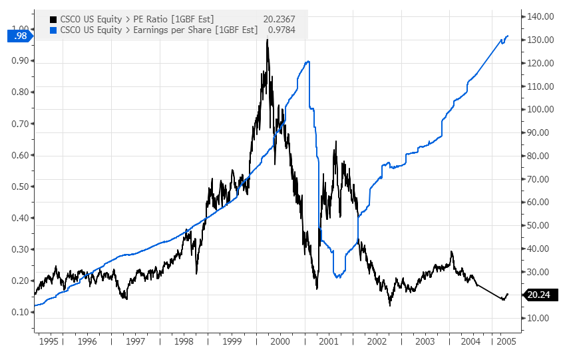
Strategists point to this earnings growth and say, “See! This isn’t 1999! There are earnings! Nothing like Pets.com!” But this ignores the fact that there were also very real earnings generated in the infrastructure buildout of the Internet. For example, from 1998-2000, Intel’s forward earnings increased 112%, CSCO’s forward earnings increased 190% (only to see those earnings forecasts get slashed by 60-80% in the next year, as shown in the charts below).
Cisco (CSCO) Forward PE and EPS 1995-2005
Source: Bloomberg, NewEdge Wealth
Intel (INTC) Forward PE and EPS 1995-2005
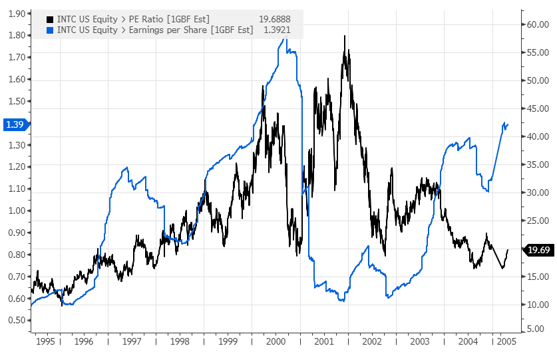
Source: Bloomberg, NewEdge Wealth
Of course, the biggest contrast to the 1990s is that many of the spenders on Internet infrastructure capex (which benefited the earnings of INTC, CSCO, and GLW) were highly leveraged, low-to-no earnings companies that ultimately went bankrupt (such as Global Crossing, a builder of fiber optics networks, that saw its revenues grow from $400M in 1998 to $1.95B in 2000, with losses swelling to $1.9B and ultimately ending in a $12B bankruptcy). Today’s hyperscaler balance sheets that are fueling the earnings of AI capex beneficiaries are far more stable given their cash generative core businesses and ample access to relatively cheap debt financing (though this Mag 7 hyperscalers are doing a fantastic job of spending all that cash, as seen in the drop in free cash flow generation in the chart below).
Magnificent 7 Forward EPS and Free Cash Flow
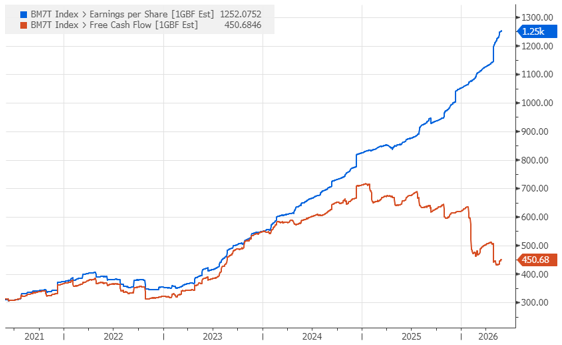
Source: Bloomberg, NewEdge Wealth, 5-29-26
But, it would be foolish to adopt a “Blind Side Sonny” (another great Coheed song) approach to this market, thinking that today’s earnings boom in historically cyclical industries and massive rallies in speculative companies can persist forever.
AI may be the most exciting, revolutionary, life changing technology we have ever seen (so are you a utopian or dystopian dreamer?), but eventually we will see the growth in AI capex slow and eventually we will see supply and demand come into balance for AI equipment, resulting in an eventual moderation in today’s sky-high semiconductor/tech hardware margins and earnings. This moderating will eventually halt the massive rallies in both earnings-driven and speculative areas, but that eventually is likely not now. Importantly, just because that eventually exists does not mean investors should avoid the higher quality areas of these exciting industries.
“Over and Out There”: Conclusion
This is a bull market, and it is a bull market fueled by excitement around new technologies that are driving a boom in both real earnings and speculative fervor. This pattern has emerged many times in the past, with a new technology sparking both investment/earnings and a surge in speculation (bicycles, railroads, telephones, radio, mainframe computers, the Internet). Said another way, it is typical for a new technology to bring both an earnings-driven rally and a speculative boom, just like today!
We see times like today as an opportunity to embrace the excitement of new technologies, while also maintaining discipline about investment quality, valuations, and earnings durability.
So, go throw on some Coheed and Cambria, read some (utopian) science fiction, and enjoy this moment of believing the unbelievable.
IMPORTANT DISCLOSURES
The views and opinions included in these materials belong to their author and do not necessarily reflect the views and opinions of NewEdge Capital Group, LLC.
This information is general in nature and has been prepared solely for informational and educational purposes and does not constitute an offer or a recommendation to buy or sell any particular security or to adopt any specific investment strategy.
NewEdge and its affiliates do not render advice on legal, tax and/or tax accounting matters. You should consult your personal tax and/or legal advisor to learn about any potential tax or other implications that may result from acting on a particular recommendation.
The trademarks and service marks contained herein are the property of their respective owners. Unless otherwise specifically indicated, all information with respect to any third party not affiliated with NewEdge has been provided by, and is the sole responsibility of, such third party and has not been independently verified by NewEdge, its affiliates or any other independent third party. No representation is given with respect to its accuracy or completeness, and such information and opinions may change without notice.
Investing involves risk, including possible loss of principal. Past performance is no guarantee of future results.
Any forward-looking statements or forecasts are based on assumptions and actual results are expected to vary from any such statements or forecasts. No assurance can be given that investment objectives or target returns will be achieved. Future returns may be higher or lower than the estimates presented herein.
An investment cannot be made directly in an index. Indices are unmanaged and have no fees or expenses. You can obtain information about many indices online at a variety of sources including: https://www.sec.gov/answers/indices.htm.
All data is subject to change without notice.
© 2026 NewEdge Capital Group, LLC

