


Throughout 2022, the equity markets challenged even the most seasoned investor’s definition of “risk.” As one of the Partners here at NewEdge Wealth recently put it, when volatility spikes and asset prices fall in value, investors often realize that their risk tolerance is different than their risk capacity.
Unfortunately, many investors’ portfolio positioning was originally determined based on their answers on a poorly structured “risk tolerance questionnaire,” which attempted to quantify a level of asset price volatility an individual would be “comfortable” experiencing. Unfortunately, this assessment of “risk tolerance” has one inherent flaw — volatility is not risk. Instead, volatility (typically measured as standard deviation) is simply a component among several factors used to measure risk.
Risk, to most investors, is the potential that your investment outcomes will differ from your expected outcomes. More specifically, the prospect that you won’t be able to support your lifestyle or goals if you fall short of your minimum “return hurdle” or exceed the financial “volatility capacity” that your lifestyle can tolerate? Unfortunately, because investors often don’t understand the impact volatility can have on their portfolios before it becomes a risk, nor are they confident in how much they can withstand without concern, they react poorly to it.
Many firms want to get clients invested quickly, which is why they tend to ask questions that gauge an investor’s emotional response to hypothetical volatility scenarios. Such questions elicit quick responses and based on those answers, firms then assign a model allocation and hope that the client truly understands their “comfort” with volatility. This analysis is ripe for “recency bias,” which we will delve into later.
Instead of determining comfort with volatility, an investor’s assessment of risk should be informed by more than one’s perception of risk. Instead, it should be driven by what they need to accomplish with what they have to help them get there. In the end, it is math, not opinion, that should inform intelligent risk-taking. Thus, spending time understanding the “why” behind investing is critical.
At NewEdge, we believe there are three components for proper risk modeling:
- Return Hurdle – The minimum investment return required to achieve your needs and goals.
- Volatility Capacity – The level of investment losses that you can afford to take based on the fluctuation of asset prices before lifestyle or goal attainment probability is impaired.
- Risk Tolerance – The level of risk you’re comfortable taking or willing to take based on your emotional reaction to the fluctuation in asset prices, recognizing that, for some, their aversion to risk is higher than their tolerance to it.
To properly quantify the above three components, it is imperative to have a firm grasp on your balance sheet, cash flows and time available to achieve your goals. This information, alongside well-informed forward-looking market assumptions, enables you to understand how volatility impacts you more accurately.
A return hurdle is simply the minimum return required to meet a set of needs/goals. Not meeting that return hurdle presents its own contribution to risk – lifestyle or inflation risk. In most cases, aiming for an increased level of return requires the exposure to an increased level of asset price volatility. For every level of expected return, there is a portfolio that can be constructed that is deemed “most efficient” – essentially, a portfolio that provides the smoothest path to a corresponding return. Typically, achieving a 3% return requires less exposure to volatility than a portfolio aiming to achieve an 8% return. Thus, the minimum return hurdle also represents the minimum level of volatility that an investor must be prepared for to meet their minimum return requirements. Establishing this return hurdle is critical to successful investment results.
It can be assumed that by exposing yourself to the possibility of returns, you are also exposing yourself to some level of volatility as to how those returns will be achieved. Looking at any chart of historical S&P 500 returns, you will find it challenging to pinpoint the actual average return over time simply because the returns are so varied. Thus, volatility of returns should be assumed as one of the few guarantees in investing. To understand your capacity for volatility, you must first understand how risk may impact you when that volatility presents itself. For most people, the capacity for volatility is dictated by volatility’s impairment of future lifestyle goals. If you must sell assets during a down market, the path to recovery gets more challenging. If your portfolio substantially supports your expenses, then elevated levels of volatility tend to have a larger impact, and often result in a reduced capacity for volatility.
Example:
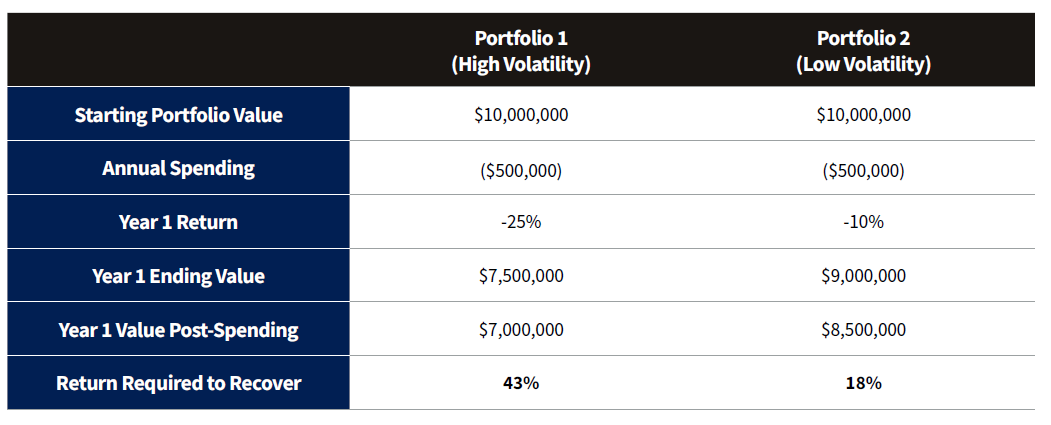
To quantify where a portfolio’s standard deviation begins to damage financial longevity, you must have a firm grasp of your current balance sheet and projected cash flows. In the end, net cash flows (or more often, expenses) substantially drive your ability to tolerate volatility over the long term. In the end, a portfolio should be propelled by return but limited by risk.
The NewEdge Approach
To prevent the risk that outcomes deviate drastically from intentions or expectations, investors need to know how long their money will last and the impact that market conditions and decisions they make will have on their outcomes. To assist investors with understanding the most appropriate portfolio and/or allocation, we employ advanced quantitative modeling designed to inform investors of the potential outcomes of the decisions they make over a long period of time. Our modeling uses an investor’s specific financial data, related to balance sheet and cash flows, to evaluate how different levels of return and volatility impact the true risk they are exposed to in achieving their goals.
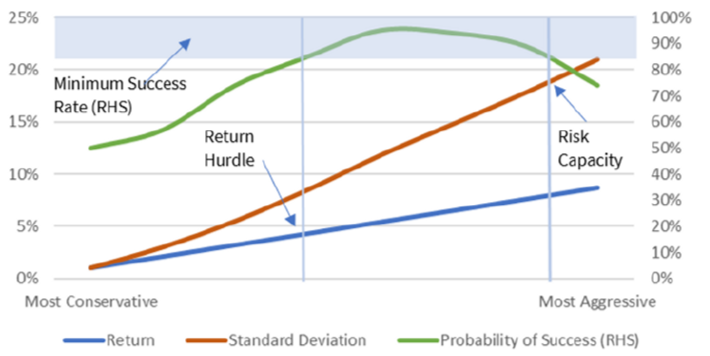
Through our quantitative modeling and evaluation process, we help develop a band of acceptable allocations. This spans from the allocation strategy that meets the hurdle return and likely the lowest level of volatility up to the allocation that pushes against the upper levels of an investor’s risk capacity – or said differently, the likely highest volatility they can be exposed to without becoming detrimental to outcomes. We deem portfolio allocations to be acceptable based on the probability that they will enable investors to meet all of their goals without the chance of running out of money. While assuming a static return over time is interesting, we know that historically speaking, the percentage of time that the S&P 500 has achieved an average return in any given year is very low.
Probability is attained using Monte Carlo analyses, which subjects a client’s financials to a variety of market conditions to account for fluctuations and volatility in the market that other calculations often ignore. The two most important components of portfolio outcomes in a Monte Carlo analysis are the correlation of assets and their standard deviation. We set a minimum threshold of acceptable probability percentages based on a client’s age, assets, cash flows and liquidity.
Risk Modeling
Understanding the necessary return and volatility required to meet a goal helps investors avoid emotional responses to temporary market or economic conditions. When you know that volatility was expected through a model that showed a high level of probability toward success, it helps weather the storm when volatility inevitably occurs.
The Perception of Risk and Our Responses to It
As investors, we have all experienced the emotional swings that come with asset price volatility. After the events that caused the emotion, we often reflect on that period with frustration – not because of the path of the markets, but instead by our response to it. But, in the end, the fact that most frequently gets in the way of successful outcomes is that we are, well, human.
Behavioral finance attempts to explain actual investor behavior, in contrast to theorizing about it. Our perception of risk can change day to day, based on our experiences, the people we surround ourselves with and our genetic predisposition toward risk-taking¹. For example, we know there is a correlation in the risk-taking behavior between parents and children². Understanding the inputs into our perception of risk is extremely beneficial in coping with our innate emotional response to it. To help prevent these responses from getting in the way, it’s important to understand what they are and why they occur.
Below are several behavioral finance biases and responses all investors should be aware of as they work to define their true risk tolerance:
Recency Bias – Have you ever watched a scary movie and afterward thought twice about taking your dog for a walk in the dark? That’s recency bias – a common behavioral bias that favors recent events over historical ones. Nothing physical about the world has changed, but your interpretation of risk has. We care a lot about behavioral biases because we know they exist, and unlike a dog walk (where your dog may simply be upset with you), they can have real consequences when it comes to investing. Changes to an investment plan based on short-term market moves can have long-lasting results, which in turn can make it more challenging to achieve the intended results.
Because of recency bias, we work diligently to get clients to think in terms of decades versus days and associate a time horizon with their investments. A lot of time goes into curating an asset allocation and implementing a plan for a client. As time passes, investors often forget why they put the original plan in place. Or, more consequentially, they choose to deviate from the plan as they see markets climbing or falling. To help prevent the desire to change, care must be taken to allow the plan to have flexibility and to ensure that clients understand the boundaries of return required and volatility capacity that can be targeted and still enable goal attainment.
Loss Aversion Bias – Investors tend to feel the pain of losses more than the pleasure of gains compared with other client types. Thus, investors may hold losing investments too long, even when they see no prospect of a turnaround. This is a very common bias and can often lead to more conservative portfolios, with short-term protection measures sometimes making the return hurdle more challenging to meet.
Endowment Bias – Investors tend to assign a greater value to an investment they already own than one they would otherwise purchase with the proceeds of that asset. Their valuation of an owned object will often be higher than its true fair market value. Inheriting a large, concentrated stock position and holding for non-financial reasons is a frequent example of endowment bias. Similarly, the avoidance of selling a poorly performing stock in exchange for a better performing one is also common.
Anchoring Bias – Investors are often influenced by the subconscious use of irrelevant information to make decisions, frequently the first bit of information we learn. This often manifests itself in the choice of arbitrary price levels and the tendency to cling to such numbers when facing decisions to buy or sell. Waiting to sell an asset simply because of a price you want to see achieved is not a rational reason to own a security. Anchoring often manifests itself in many forms when it comes to our wealth, including in financial planning or goal attainment. When considering retirement, investors often come up with a random wealth level they want to hit before they make a decision, regardless of whether that level of wealth is sufficient to cover their needs and objectives.
Mental Accounting Bias – Investors often treat various pools of money differently based on where the pools are mentally categorized. For example, these investors segregate their assets into safe and risky “buckets” or based on some known future use. Although this behavior is usually not harmful, returns can often be maximized by taking advantage of our proclivity to do so. We do this by partitioning capital based on beneficiary versus our own personal use. Doing so can often lend to a more efficient and bifurcated assessment of risk based on the end-likely user of that capital. For example, suppose a portion of your net worth is unlikely ever to be used by you. In that case, we should be defining the likely user and managing the capital based on their needs – typically a much longer time horizon with fewer demands on capital.
Hindsight Bias – Occurs when an investor perceives past investment outcomes as if they had been predictable, and after the fact stating that they had known when in reality, they had not. It is the exaggeration of what could have been known at a prior moment in time. It impedes our ability to learn from our mistakes and attempts to apply an unreadable level of rationality to the randomness of things like the stock market. The result can often be the harsh critique of decision makers who act as agents or advisors to others.
Confirmation Bias – Confirmation bias occurs when people overvalue or actively seek information that confirms their beliefs, while ignoring or devaluing evidence that discounts their beliefs. Confirmation bias can cause investors to seek only information that confirms their views about an investment and avoid or discount information that is disconfirming. This behavior can leave investors holding a poorly performing position simply because they don’t want to acknowledge the negative news. This bias finds its way into many aspects of our everyday life — from the news we choose to watch to the friends we make. Thus making confirmation bias one of the more common biases found in investing.
Self-Control – Self-control bias is the tendency to consume today at the expense of saving for tomorrow, failing to act in pursuit of long-term goals. An example is simply eating and dieting, where we choose to eat food that we know is bad for us simply because we don’t see the impact on long-term outcomes. The primary concern is for clients with a high-risk tolerance coupled with high spending. When this coincides with the financial market’s sudden severe turbulence, the client may be forced to sell solid long-term investments that have been priced down, even if temporary. We work to address self-control through our modeling and evaluation, assessing a change in expenses on long-term outcomes.
Outcome Bias – This occurs when investors focus on the outcome of a process rather than on the process used to attain the outcome. In the investment realm, this behavior focuses on a return outcome without regard to the process used (i.e., the risk taken) to achieve the return. Therefore, it is important for clients to understand how the outcome was achieved, not simply the outcome itself. Unfortunately, we witness this bias frequently amongst clients who often want to compare their choice in investments simply by the prior and historical performance, even when they are incomparable.
While we all agree that investment results are the reason we put our hard-earned money at risk, at NewEdge Wealth, we are focused on the quality of our decisions as they relate to goal attainment and performance. Quality decisions are made through informed discovery and analysis, which helps investors understand why they are doing, what they are doing and what they can do with it. With a well-articulated risk assessment, investors are better positioned to maximize returns based on their capacity and tolerance for volatility.
SOURCES
² Sandra E. Black, Paul J. Devereux, Petter Lundborg, and Kaveh Majlesi. On the Origins of Risk-Taking. NBER Working Paper No. 21332 July 2015 JEL No. G11,J01
Corporate Finance Institute, Charles Schwab, Morningstar, Credit Suisse, eMoney Advisor
IMPORTANT DISCLOSURES
The views and opinions included in these materials belong to their author and do not necessarily reflect the views and opinions of NewEdge Capital Group, LLC.
This information is general in nature and has been prepared solely for informational and educational purposes and does not constitute an offer or a recommendation to buy or sell any particular security or to adopt any specific investment strategy.
NewEdge and its affiliates do not render advice on legal, tax and/or tax accounting matters. You should consult your personal tax and/or legal advisor to learn about any potential tax or other implications that may result from acting on a particular recommendation.
The trademarks and service marks contained herein are the property of their respective owners. Unless otherwise specifically indicated, all information with respect to any third party not affiliated with NewEdge has been provided by, and is the sole responsibility of, such third party and has not been independently verified by NewEdge, its affiliates or any other independent third party. No representation is given with respect to its accuracy or completeness, and such information and opinions may change without notice.
Investing involves risk, including possible loss of principal. Past performance is no guarantee of future results.
Any forward-looking statements or forecasts are based on assumptions and actual results are expected to vary from any such statements or forecasts. No assurance can be given that investment objectives or target returns will be achieved. Future returns may be higher or lower than the estimates presented herein.
An investment cannot be made directly in an index. Indices are unmanaged and have no fees or expenses. You can obtain information about many indices online at a variety of sources including: https://www.sec.gov/answers/indices.htm.
All data is subject to change without notice.
© 2026 NewEdge Capital Group, LLC

