


Click Here to Listen to the Audio Version
Introduction
“Now lookie here people, listen to my story”
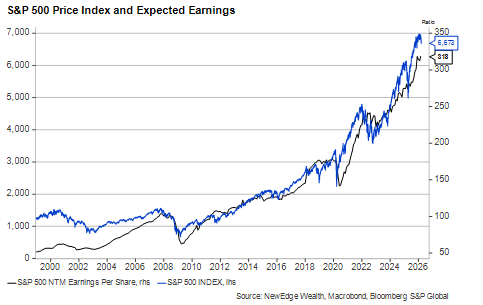
The U.S. equity market’s long-term resilience is no accident. Domestic firms benefit from operating in the world’s most dynamic economy and represent a wide range of industries. This has helped companies generate reliably strong earnings growth across seasons and cycles, and it has created internal market diversification in periods of sharp rotations (when many country indexes driven by just one or two industries often falter). The synchronous growth in both corporate earnings and the index itself represented on this graph makes it hard to argue with a patient approach to long-term investing:
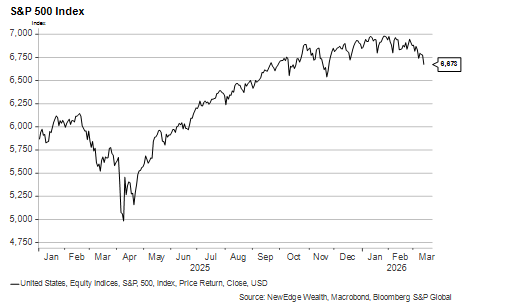
Over shorter periods, resilience can falter. Investors often discount the long-term story and reduce their exposure to equities if the economic picture softens or policy risk seems to be on the rise. Lately, however, investors have seemed largely immune to panic even during moments that, in the past, may have led to more substantial (5% to 10%) corrections.
The lone 10% correction of the past two years began in March 2025 and lasted only a few weeks. Buyers correctly looked through concerns about the impact of the so-called Liberation Day tariffs, the bulk of which were either immediately scaled back or eventually ruled illegal by the courts.
The onset of the Iran War in the past several weeks has, as we wrote last week, been initially greeted with a shrug from equity investors despite a 30%+ increase in the price of oil. The flatness of the index over the past six months (which included a long government shutdown, significant changes to tariff rules, and the war) speaks volumes:
This week, we are going to explore what’s behind this resilience and how investors debating whether to put money to work should think about their odds of making a timing mistake or putting too much faith in the administration’s ability to pull markets back from the brink.
At the risk of overloading our readers with puns, we have selected the Dire Straits (see what we did there?) tune, “Money for Nothing”, to inspire this Weekly Edge. We hope you’ll forgive us if we also borrow a lyric or two from the song’s “Weird” Al Yankovic parody, “Beverly Hillbillies”, given “bubblin’ crude’s” current relevance.
We’re Monitoring the Situation
“One day he was shootin’…”
The past week’s market action saw energy prices continue to surge, with Brent crude oil closing above $100/bbl on Thursday for the first time since 2022. Just about every other market sold off on the increasing likelihood that the global economy is in store for an unpleasant mix of higher inflation and softer real growth. While still short of the highs reached in the immediate aftermath of Russia’s Ukraine invasion, oil prices have risen to levels that, if sustained, will be economically harmful to the U.S. and its peers.
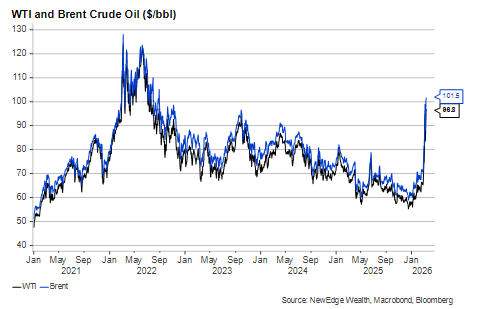
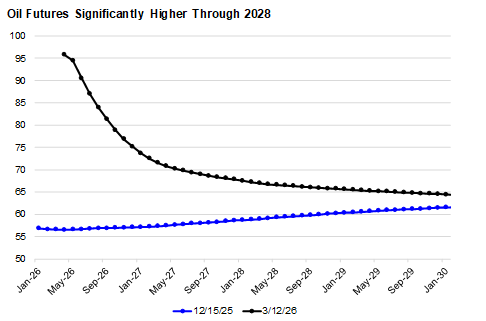
Market sensitivity to oil prices will likely persist until the conflict reaches at least a tentative resolution and oil is once again flowing out of the Persian Gulf. One thing keeping broader markets from panicking is the view priced into oil futures that prices will not remain at these levels for long. While oil futures today reflect higher prices over the balance of this decade than they did three months ago, they also imply a substantial normalization within just a few months from today’s spot price.
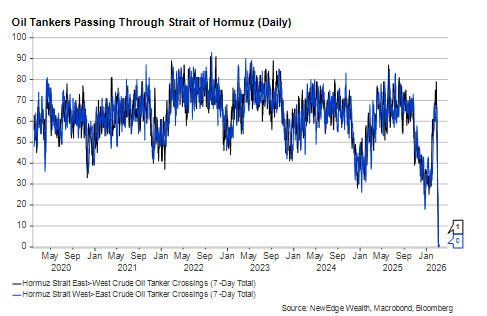
Why do markets remain optimistic that prices will soon fall despite Bloomberg data showing few if any oil tankers leaving the Strait of Hormuz (“Look at that, look at that”) and both sides continuing to launch attacks? We’ll use the next section to unpack the answer.
How Much Market Pain is Too Much?
“Lemme tell ya, them guys ain’t dumb”
“Any time I want it to end, it will end.” President Trump’s comment on the war this week could have been made in reference to any number of market-rattling policy gambits since the start of his second term. Reciprocal tariffs, the 45-day government shutdown, and the public showdown with Fed Chair Jerome Powell are some of the others that immediately spring to mind.
In each of these cases, this administration has undertaken policies that introduced risks outside of the normal range to which investors are accustomed. But in all of them (Iran is still pending) policies were cancelled or scaled back when markets began to really turn negative. The pain point often arrives when the S&P 500 flirts with a 5% correction and/or when the 10-year U.S. Treasury yield comes close to 4.5%. Of course, stocks were down closer to 20% from all-time highs in the days after Liberation Day last year, but that move happened incredibly fast. It took less than a week for the administration to reverse course on the tariffs.
Some observers have come to call this the TACO trade (Trump Always Chickens Out). It’s a pejorative, to be sure, but it also may be a perfectly rational approach to keeping the economy afloat, as we’ll detail in the next section.
Trying to Avoid a U.S. Consumer/U.S. Equity Market Death Spiral
“Now look at them yo-yos, that’s the way you do it.”
The past few years of strong growth have come amid a rapid increase in net worth (primarily the result of a roaring stock market) and a significant drop in the household savings rate.
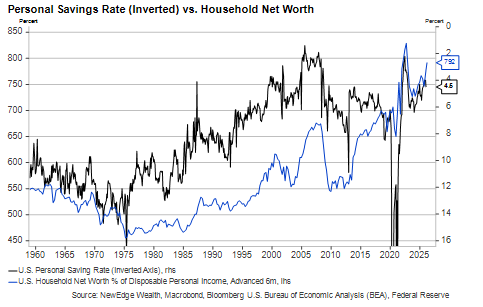
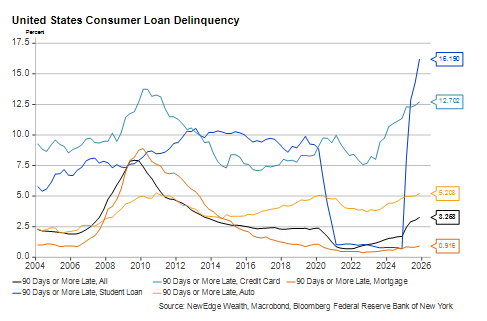
Avoiding sharp drops in the stock market is arguably the key to keeping GDP growth supported, especially given the cracks that have emerged elsewhere in the economy. Savings rates have fallen close to all-time lows. Average wage growth has slowed, and more consumers are falling behind on their debt obligations. Households do not have the same cushions they did to help them weather a far worse hit to purchasing power back in 2022.
We wrote at the outset of 2026 that U.S. economic performance would hinge on whether a rising stock market could continue to backstop wealthier consumers. According to Oxford Economics, wealth effects boost consumption primarily through increases in discretionary goods and services spending. This makes sense because wealthier consumers devote a greater share of their consumption basket to these areas relative to necessities like energy and food.
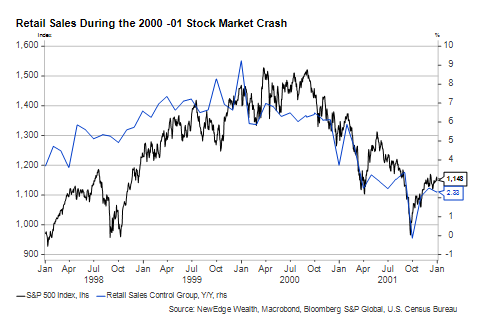
There is a reason why the S&P 500 has been a member of the Conference Board’s Index of Leading Economic Indicators since the first half of the 20th century. As we saw in 2000 and 2001, a sharp and sustained decline in stock prices can create an abrupt deceleration or decline in consumer spending.
It’s also worth noting that the causality between stock prices and consumer spending can flow in both directions. The average household holds a greater share of their net worth in equities today than at any point in history, which means the equity market has a greater potential to influence their sentiment and behavior:
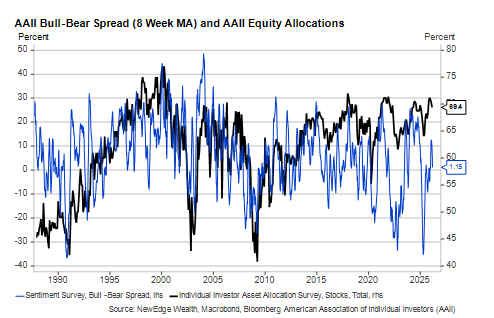
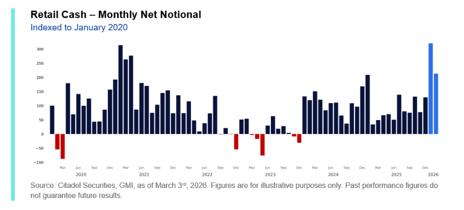
During the first two months of 2026, retail investors put cash to work in stocks at a near record pace. Indeed, much of the dip buying has come from individual investors over the past several years even as many institutions have been positioned neutral or even short the market.
What Could Go Wrong?
“Now that ain’t workin’, that’s the way you do it”
One of our major investment themes heading into 2026 was “Don’t Fight the White House”. The administration is clearly aware of the connection we pointed out above between the equity market and the economy. Administration spokespeople, including the president himself, often cite the levels of the Dow Jones Industrial Average or the S&P 500 as evidence their policies work and the economy is doing well.
Investors are correct to conclude that the Trump administration judges more of its success on the performance of the stock market than prior administrations did. Policymakers are deploying a wider variety of measures to support the market – including specific industries and companies – today than they have in the past. This includes direct government ownership in private companies, tariff exemptions for U.S. technology firms connected to A.I., government purchases of mortgage-backed bonds, and using the Department of Justice to pressure the Fed to lower interest rates.
While some are more effective than others, all these policies may help the effort to keep growth stimulated in the short term. Some tax relief from the One Big Beautiful Bill Act may provide further help to households in Q2, although some of that may be offset by higher gasoline prices.
The key to the TACO phenomenon, however, is not the measures put in place to support markets but the measures that are *not* taken (or the ones that are quickly rolled back) that would have potentially threatened investor risk appetite and corporate earnings growth. This is how investors seem to view the Iran war, for now.
U.S. oil prices are more than 30% higher than they were two weeks ago. Retail gasoline is up by close to the same amount, and 16% over its level at this time last year. Can the “military excursion” into Iran be walked back with a clean reset to the status quo ante in global commodity markets? Analysts are skeptical, especially given the physical damage to infrastructure in the region and the production shutdowns in several Persian Gulf producers.
Saying “this time is different” risks underestimating President Trump’s ability to step away from political danger and declare victory in Iran with no permanent macro damage. However, we are concerned about the impact of a prolonged period of elevated oil prices on the global economy and most sectors of the equity market. For equity markets, more volatility is possible even absent a worst-case scenario like a recession. Should the war last long enough to hit GDP growth expectations (currently at 2.5% for 2026) and S&P 500 earnings (currently at 14% growth for both 2026 and 2027), stocks would likely remain under pressure.
Conclusion: Should Investors Bank on Volatility Remaining Low?
“Yeah, Buddy, move away from there”
While downside risks are elevated, we do not believe investors need to panic. Prior to the war, most economic data had been coming in strong compared to Q4 2025. The weak February jobs report merely offset an unexpectedly strong January print. And we are just putting the finishing touches on an excellent corporate earnings season with no broad-based signs of negative developments on the horizon.
Investors who need to put money to work but are afraid of mistiming the market can plan out a multi-tranche pace of deployment. The number of tranches and the frequency of investments will be different for each investor, but this approach spreads market timing risk over a period of several months or even a year. An investor who went all-in in March 2025 had some regrets by early April (though they were short-lived), but an investor who moved into stocks gradually over the first six months of last year had several excellent entry points along the way. Having a plan and sticking to it can help with the psychological challenges of taking market risk.
Incidentally, this is true whether one is a believer in the “TACO” phenomenon or not. Five percent corrections (like the one we are on the edge of at the moment) are quite common. Even 10% drops are close to annual occurrences. Whether one believes the U.S. government can steer policy to avoid even normal-sized drawdowns, committing to investments well in advance over a long period of time can help mitigate the odds of regret.
Click Here to Listen to the Audio Version
IMPORTANT DISCLOSURES
The views and opinions included in these materials belong to their author and do not necessarily reflect the views and opinions of NewEdge Capital Group, LLC.
This information is general in nature and has been prepared solely for informational and educational purposes and does not constitute an offer or a recommendation to buy or sell any particular security or to adopt any specific investment strategy.
NewEdge and its affiliates do not render advice on legal, tax and/or tax accounting matters. You should consult your personal tax and/or legal advisor to learn about any potential tax or other implications that may result from acting on a particular recommendation.
The trademarks and service marks contained herein are the property of their respective owners. Unless otherwise specifically indicated, all information with respect to any third party not affiliated with NewEdge has been provided by, and is the sole responsibility of, such third party and has not been independently verified by NewEdge, its affiliates or any other independent third party. No representation is given with respect to its accuracy or completeness, and such information and opinions may change without notice.
Investing involves risk, including possible loss of principal. Past performance is no guarantee of future results.
Any forward-looking statements or forecasts are based on assumptions and actual results are expected to vary from any such statements or forecasts. No assurance can be given that investment objectives or target returns will be achieved. Future returns may be higher or lower than the estimates presented herein.
An investment cannot be made directly in an index. Indices are unmanaged and have no fees or expenses. You can obtain information about many indices online at a variety of sources including: https://www.sec.gov/answers/indices.htm.
All data is subject to change without notice.
© 2026 NewEdge Capital Group, LLC


