


What will it take to show you that it’s not the life it seems? (I’m not okay)
My Chemical Romance, “I’m Not Ok (I Promise)”
U.S. consumers are acting pretty emo these days.
(For those of you who do not have the pleasure of knowing what emo is, it is short for “emotional hardcore” and refers to a genre of music from the early 2000’s that was characterized by brooding, confessional lyrics set to melodic, post-punk music. Emo also came with a subculture of distinctive side-swooping haircuts, glam-punk fashion, and a rather angsty perspective about one’s place in the world.)
U.S. consumers have appeared to be embodying their inner emo-kid when filling out sentiment surveys, almost as if they are blasting My Chemical Romance’s seminal 2004 “I’m Not Ok (I Promise)” while responding to the Conference Board or University of Michigan (the two primary sources of consumer sentiment/confidence surveys in the U.S.).
In fact, U.S. consumers are so emo right now that they are reporting their worst, most sour, most negative sentiment since the depths of COVID and the Great Financial Crisis.
And yet, these emo-consumers continue to spend healthily, with overall personal consumption expenditures at all-time highs, almost as if they are listening to some jolly yacht rock while hitting the stores!
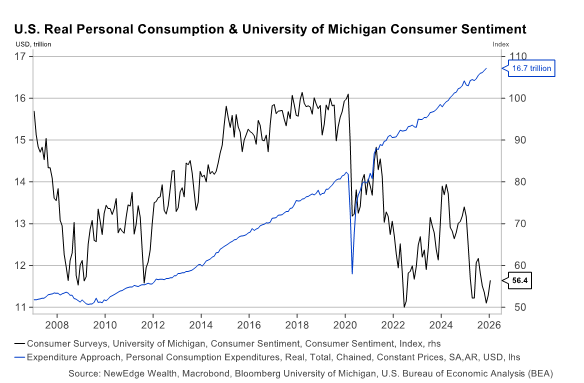
This divergence between how consumers are feeling (emo) versus how consumers are spending (yacht) has puzzled many market watchers and policy makers, including Fed Chair Jerome Powell at this week’s FOMC rate decision press conference:
“It’s just that consumers—the consumer is filling out surveys that sound really negative, and then spending. So, there’s been a disconnect for some time between downbeat surveys and reasonably good spending data.”
We think the reason for this divergence is fairly simple: consumption metrics are “market weight” and sentiment surveys are “equal weight”.
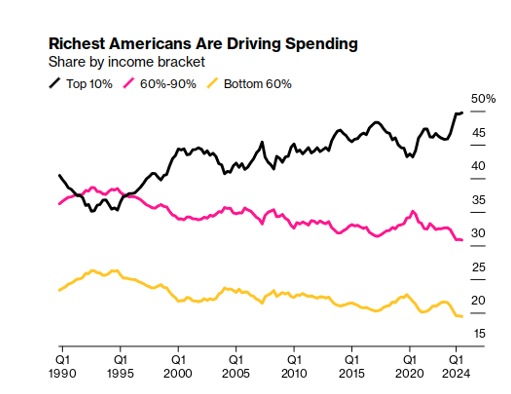
Consumption metrics are like a “market weight” stock index, such as the S&P 500, where the largest weights/contributors have an outsized impact on the total. Think of the S&P 500’s 37% weight to the “Great 8” stocks, whose strength from 2023 to 2025 masked some of the weakness under the surface of the broader market. This is similar to the U.S. consumer dynamic, where the top 10% of households are generating 50% of consumption and remain resilient thanks to dynamics around the wealth effect and a lower sensitivity to the jobs market. So, when the largest weights in a market weight index are also the strongest performers, the overall index (or metric) can look healthier on the surface.
Conversely, sentiment surveys are like an “equal weight” index, where every stock or every response carries the same weight. This means that the more challenging experiences of lower-income consumers carry the same weight in the Conference Board or University of Michigan surveys as the healthier high-income consumers. And so, sentiment surveys have underperformed consumption metrics just as equal-weight indices have underperformed market-weight indices (by a whopping 43% in 2023-2025 for the S&P 500 varieties!).
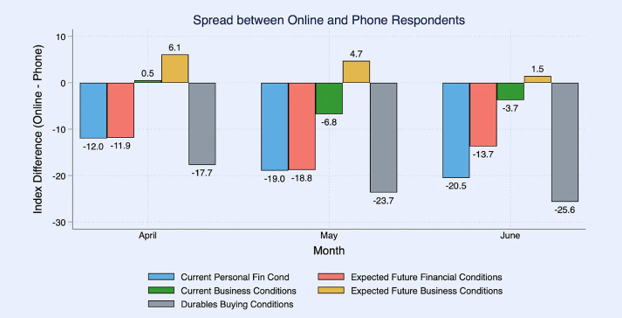
This distinction between market-weight consumption metrics and equal-weight surveys also needs the added caveat that sentiment surveys have experienced a “structural break”, as economists Ernie Tedeschi and Ryan Cummings put it, as they have switched from phone collection to online collection of the surveys.
Turns out, consumers are even more negative (and emo!) when they respond to a survey online than when they are asked questions on the phone by another human (they sneered like MCR’s Gerard Way, saying “Well, if you wanted honesty, that’s all you had to say”). Tedeschi and Cummings argue that the shift to online surveys makes comparisons to periods before 2024 inconsistent.
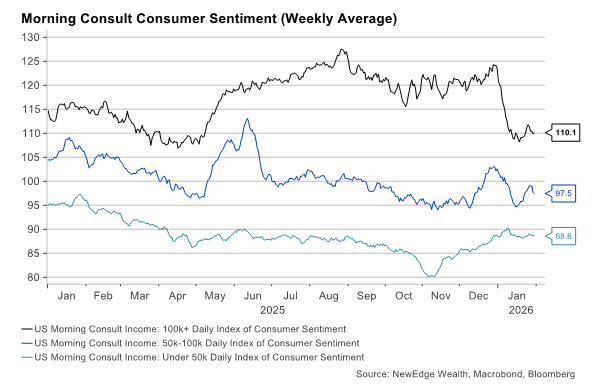
There is one more caveat, and that is as of January 2026, sentiment for higher income households has also turned materially lower, where we have seen some improvement in lower income household sentiment since November 2025 (likely related to the resolution of the government shutdown).
All of this might seem like splitting hairs in the data, but it is important for understanding and forecasting U.S. household consumption in 2026, which, of course, is critical to the outlook for the broader U.S. economy.
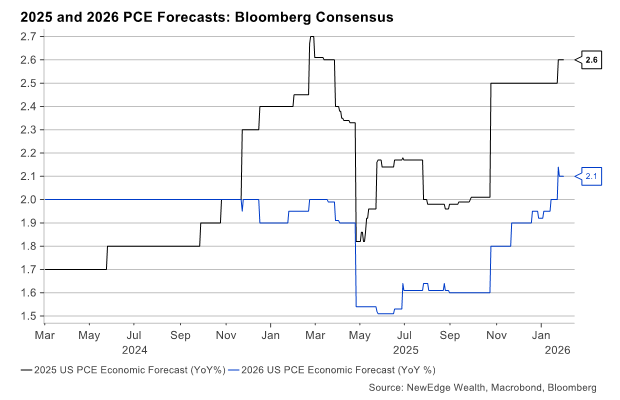
Interestingly, economists are forecasting a fairly meaningful deceleration in personal consumption growth in 2026 to 2.1% versus 2025 at 2.6%.
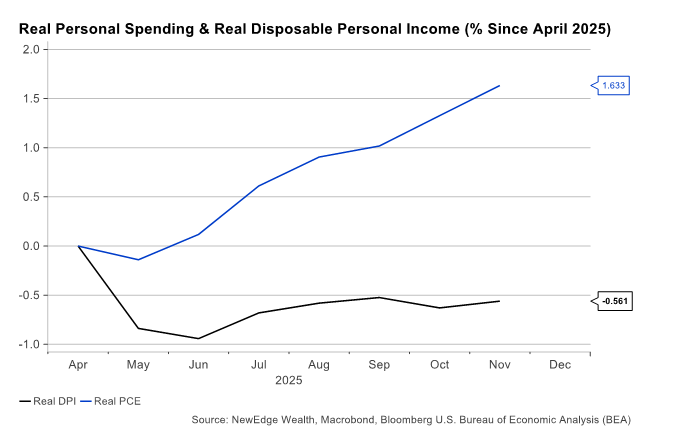
Expecting a slowdown in consumption in 2026 does not seem unreasonable when we consider how stretched consumers have become in the last year. By stretched, we mean how much consumer spending has outpaced consumer income. The chart below shows how, since April 2025, consumer spending has grown by 1.6%, but consumer income has fallen by -0.6% (on a real, inflation-adjusted, basis). This is not sustainable, as over longer periods of time, spending and income track each other closely.
This rise in spending without a concomitant rise in income suggests that consumers are dipping into savings/saving less in order to fund consumption, and the data shows exactly that, with the savings rate recently dropping to 3.5%, near historical lows (seen in the inverted black line in the chart below).
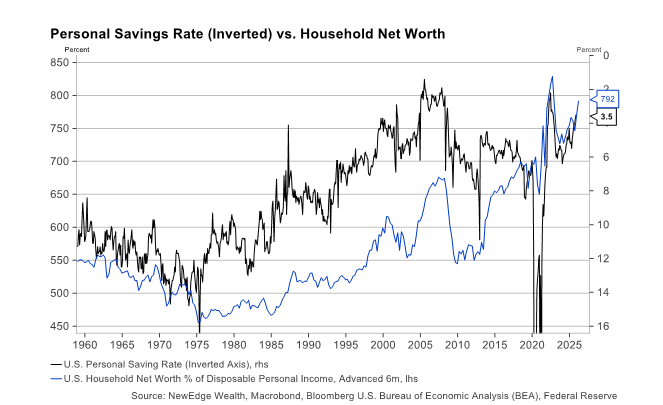
The chart above also makes a notable point that there is an inverse relationship between the savings rate and household net worth. Said another way, when households are enjoying the wealth effect of rising home and stock prices, they tend to save less and spend more. The recent resilience in home prices and powerful run in stocks has driven household net worth to a record, driving the dip in savings, and fueling the rise in consumption.
But this brings us back to our market-weight vs. equal-weight dynamic and the realities of the well-appreciated “K-Shaped” dual economy (where high-income households are strong and growing, while low-income households are struggling).
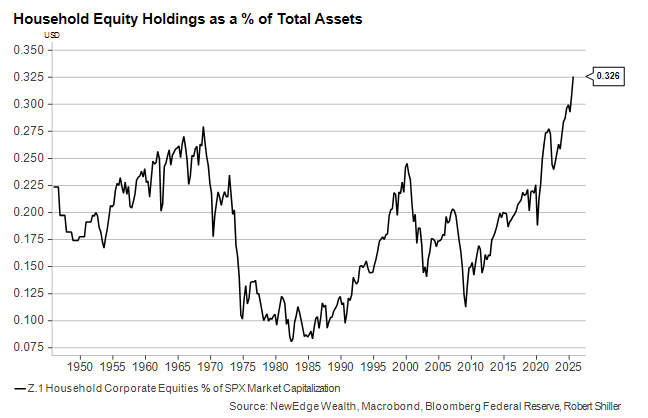
The spoils of a soaring stock market and strong home prices have been a key reason why the top leg of the K, high-income households, have been able to continue to spend so robustly.
For the stock market and the high-income consumer, it has been a positive feedback loop: strong stocks drive strong growth in consumption, which drives further stock gains and further consumption growth. Further, according to the Fed Flow of Funds, U.S. households have never been more exposed to/invested in equity markets, which means that rallies are thoroughly enjoyed, but corrections will likely be a bruising experience, not just to sentiment but actual consumption. We see this as a key risk to growth forecasts for 2026: the positive feedback loop between equity markets and consumption turns into a negative feedback loop (note this is not our base case, but a risk we must appreciate).
For all of this talk about the consumer, it is notable that it took us over 1,000 words before we even mentioned the labor market. Of course, the labor market is the key to overall consumption and economic growth. The reality is that wealthier consumers are typically less reliant on the labor market for consumption, while lower-income consumers are highly sensitive to the labor market.
And for all of the caveats about consumer sentiment surveys we outlined above, the one area where consumers tend to be very accurate (and not overly emo) with their assessments of the economy is about the labor market.
Consumers tend to sniff out softening in the labor market before it hits broader statistics, such as unemployment. This is why metrics like the Conference Board’s Labor Market Differential (the difference between jobs being “plentiful” vs. “hard to get”) have been one of the most reliable relationships between “soft” sentiment data and “hard” collected data.
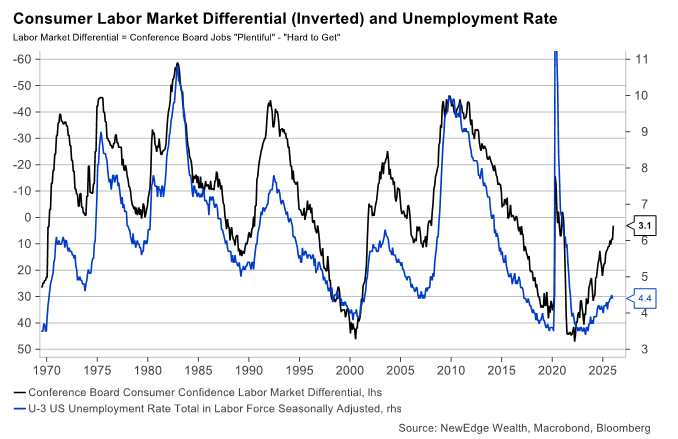
This measure has been flashing warning signs that we could see further increases in the unemployment rate, which would likely disproportionately hurt low-income consumers at first. However, a rise in unemployment would likely not be welcomed by an expensive equity market expecting a sharp acceleration in earnings growth in 2026, so high-income consumers and their reliance on strong stock market gains would not be immune to further labor market weakening.
Conclusion: “You can’t swim, you can’t dance, and you don’t know karate, face it, you’re never gonna make it”
The takeaway from all of the charts and caveats about the consumer is that the strong aggregate spending data does not tell the full story about the U.S. consumer (we can hear Gerard Way again pleading “What will it take to show you that it’s not the life it seems?”).
The market weight (consumption metrics) vs. equal weight (sentiment survey) dynamic helps explain the divergence between what consumers are doing (yacht!) vs. what they are saying (emo!).
The expectations for slower consumption growth in 2026 do make sense in the context of falling real incomes (as wage growth slows and inflation remains sticky), but how this spins up to an aggregate consumption number will largely depend on how much the wealth effect is able to continue to buoy high-income spending.
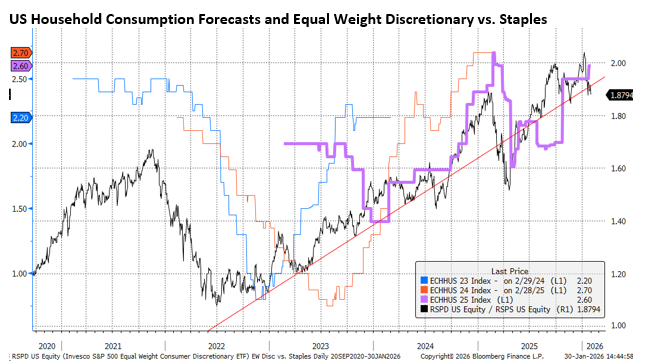
Though the slowing jobs market has not caused a slowdown in consumption thus far, a further rise in unemployment, as potentially signaled by jobs sentiment surveys, could certainly pose a risk to incomes and equities, meaning both low- and high-income consumers could be pressured. Lastly, the most important consumer chart over the past three years has been the equity market’s assessment of the consumer, and it continues to be our ultimate guide. As long as the equal weight Discretionary (cyclical) vs. Staples (defensive) ratio remains in an uptrend, we see the equity market maintaining optimism about the U.S. consumer. If this ratio turns lower, we may “join the black parade” as MCR would say and become more negative about the outlook for U.S. household consumption.
IMPORTANT DISCLOSURES
The views and opinions included in these materials belong to their author and do not necessarily reflect the views and opinions of NewEdge Capital Group, LLC.
This information is general in nature and has been prepared solely for informational and educational purposes and does not constitute an offer or a recommendation to buy or sell any particular security or to adopt any specific investment strategy.
NewEdge and its affiliates do not render advice on legal, tax and/or tax accounting matters. You should consult your personal tax and/or legal advisor to learn about any potential tax or other implications that may result from acting on a particular recommendation.
The trademarks and service marks contained herein are the property of their respective owners. Unless otherwise specifically indicated, all information with respect to any third party not affiliated with NewEdge has been provided by, and is the sole responsibility of, such third party and has not been independently verified by NewEdge, its affiliates or any other independent third party. No representation is given with respect to its accuracy or completeness, and such information and opinions may change without notice.
Investing involves risk, including possible loss of principal. Past performance is no guarantee of future results.
Any forward-looking statements or forecasts are based on assumptions and actual results are expected to vary from any such statements or forecasts. No assurance can be given that investment objectives or target returns will be achieved. Future returns may be higher or lower than the estimates presented herein.
An investment cannot be made directly in an index. Indices are unmanaged and have no fees or expenses. You can obtain information about many indices online at a variety of sources including: https://www.sec.gov/answers/indices.htm.
All data is subject to change without notice.
© 2026 NewEdge Capital Group, LLC


