


Long in tooth and soul
Longing for another win
– “Invincible”, Tool
Equity markets have been acting invincible (save for Wednesday of this week). With the tailwinds of a friendly Fed and resilient growth data, equities have been in full melt-up mode as investors chase to increase exposure into year end.
In less than two months the S&P 500 is +16%, the NASDAQ is +20%, and the Russell 2000 is +24%, all resulting in bright flashing “overbought” readings for the indices (as measured by the Relative Strength Index readings for each index being well above 70).
As markets have rallied, we have seen sentiment become resoundingly bullish, positioning become increasingly long, and valuations expand back to recent highs. Interestingly, estimates for EPS growth have actually been trimmed during this rally!
This raises the question: has this market become too “one-sided”, or as Maynard would buzz “long in tooth and soul, longing for another win”?
To answer this, we must monitor four key buckets of data: sentiment, positioning, valuation, and earnings expectations. For today’s purposes, we will focus only on sentiment and positioning, with a subsequent update on valuations and earnings expectations.
We pay close attention to extreme readings in these measures, to both the upside and the downside, because it helps us gauge how easy it would be to surprise the market in the opposite direction of what consensus is expecting.
In our mid-year 2023 outlook, we called upon a Goethe quote, “Few people have the imagination for reality.” When markets hit extremes of bullishness or bearishness, they often lose their imagination for what could cause markets to move in another direction.
This was an important lesson in each of the last two years: 2022 started with overjoyed optimism and risk appetite but proceeded to be a year of highly disappointing returns, while 2023 started with pervasive pessimism and risk aversion but proceeded to be a year of powerful returns.
The set up for 2024, based on the data below, is one that is not quite as extremely optimistic as 2022 (there are some extreme measures today, while others have room to get even more extended), however today’s mood is substantially more optimistic than the start of 2023. This doesn’t mean that markets and the economy cannot continue to be strong in 2024, however this creates a much higher bar to surprise to the upside next year, and if it continues to extremes, sets the stage for downside surprises.
One last note before diving in: all of these measures are not great timing tools for markets, meaning they can hit extremes and persist for some time (consider the multi-year melt-up of the late 1990s; these measures tend to more exacting timing tools at market lows).
So with the spirit of an open mind, we monitor these measures as we enter 2024, to see where markets could be most surprised next year.
Sentiment: “Bellow out loud, bold and proud”
When it comes to monitoring equity sentiment, the only thing to fear is greed itself.
And what a difference a year makes! Compared to the start of 2023, when bearishness was rampant and sentiment was washed out, today’s market participants are feeling much more optimistic (in a great reminder that narratives and emotions follow price action, not the other way around!).
The American Association of Individual Investors Sentiment Survey shows that those investors saying they are bullish now outweigh those saying they are bearish by the most since 2021, when markets were roaring and YOLO’ing on speculative stocks.
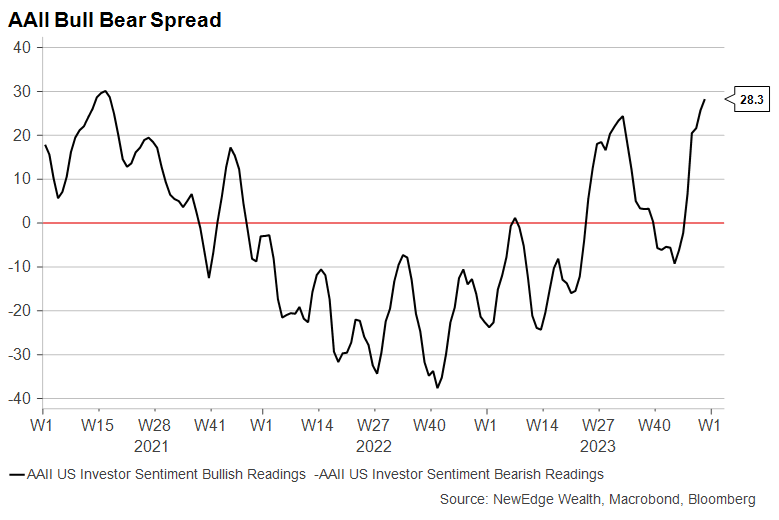
As of: 12-22-23
Before getting too concerned about this measure, Jeff DeGraff at Renaissance Macro flagged that Consensus Inc’s reading of bullishness is also now in the 90th percentile, but that this level of bullishness does not have strong predictive power that market returns will be sharply weaker going forward (it is a more reliable indicator in the opposite direction, meaning when markets are weak and bulls are scarce).
We can also measure sentiment by looking at investor’s demand for downside protection with puts versus upside optionality with calls. This is captured with the Put/Call Ratio, where a low measure is a sign of complacency when investors have little demand for downside protection.
Today, the Put/Call ratio has fallen, but is not at the lows seen in July of this year and still above the ultra-complacent lows since in late 2021/early 2022. Also contrast today’s level with the start of 2023, when demand for downside protection was elevated given bearish sentiment.
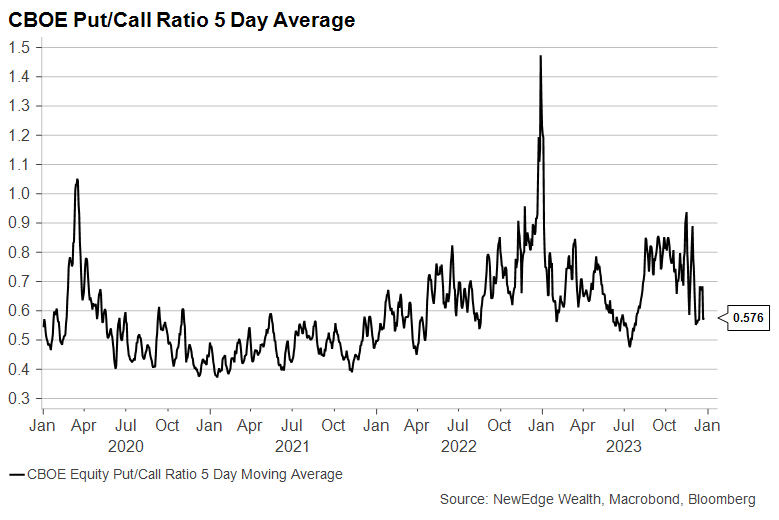
As of: 12-22-23
Relatedly, we can look at the VIX equity volatility index as a gauge of fear or complacency in markets. The VIX is a better timing tool at market lows (spikes in the VIX tends to happen when markets “flush” at the lows), while near market tops the timing is murkier because the VIX can stay muted for extended periods of time (but then it risks becoming a coiled spring, rebounding higher and catching investors off guard).
Today, the VIX is low and subdued at just ~14. Wednesday’s trading, when markets quickly reversed lower without news, was a sharp reminder of how low volatility breeds the conditions for high volatility (effectively the set up for a “Minsky Moment”). Investors who remember early 2018 are likely scarred by this dynamic: volatility fell sharply, going sub-10 on the VIX as markets were in melt-up mode, only to quickly reverse in an episode now known as Volmageddon.
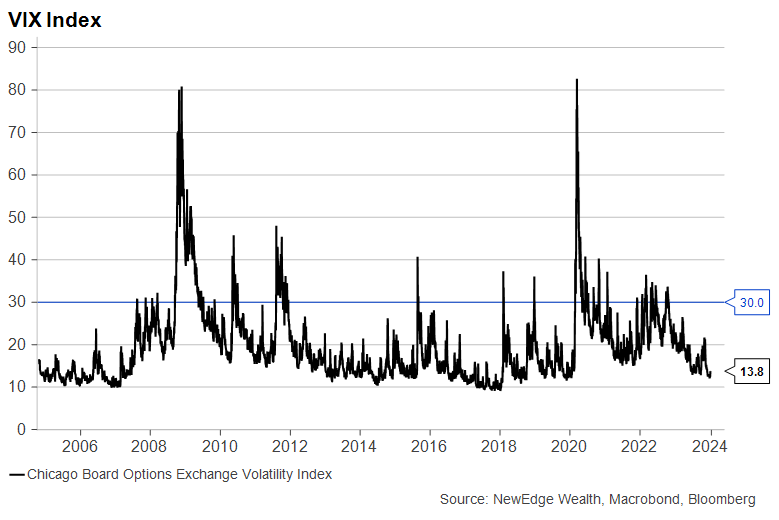
As of: 12-22-23
A helpful indicator to bring all of these measures together in CNN’s Fear and Greed Index. This measure shows today’s market in “Extreme Greed” territory (when we started writing this piece at the start of the week, it was just at “Greed”!).
Note the contrast to early 2023 in the second chart below, where we were firmly in “Fear” territory.
CNN Fear and Greed Index Dashboard (Top) and Over Time (Bottom)
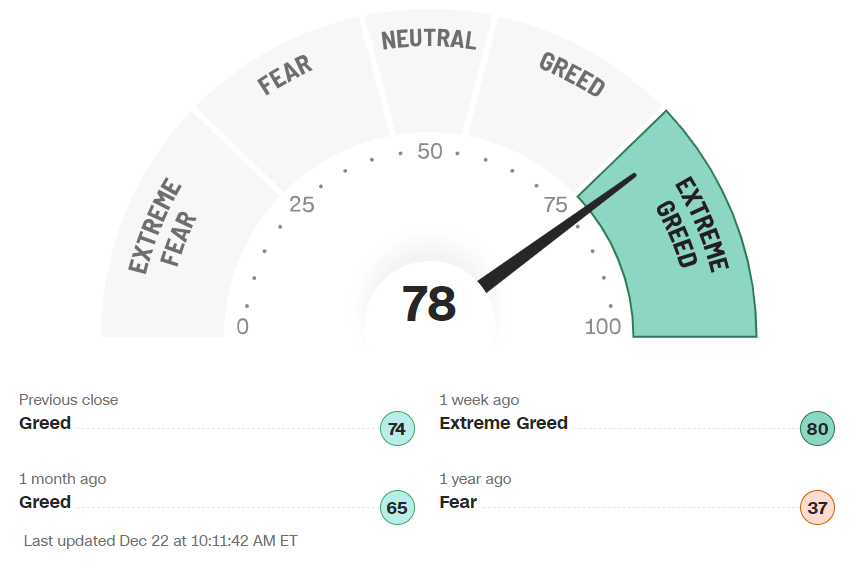
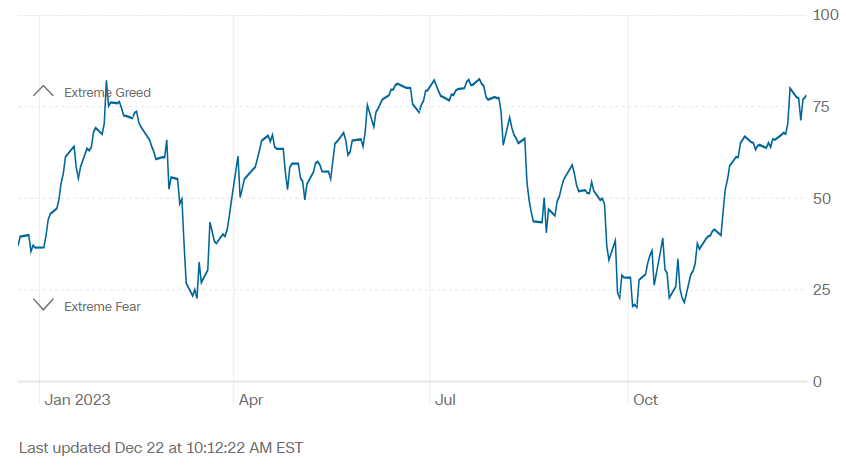
Source: CNN Fear and Greed Index, as of 12-22-23
Overall on sentiment, today’s bullish mood is getting close to an extreme, but note that this ebullient mood can persist given these are weak timing tools. However, today’s readings stand in stark contrast compared to the beginning of 2023 when sentiment was bearish and fairly washed out. This implies a higher bar to surprise to the upside in 2024, as investors are already expecting good news and good returns.
Positioning: “Lurch into the fray”
Positioning tells a similar story: compared to the underweight, risk-off positioning to start 2023, as we enter 2024, investors have become much more overweight risk assets (in reflection of the optimism outline above), but not quite to the extremes seen in times like early 2022 and early 2018. This creates a higher bar to jump over, but we’re not at the point (yet) where investors are all crowded on one side of the boat (this can change quickly given recent performance chasing!).
Note that measuring sentiment is a bit like the “Blind Men and an Elephant” parable, where your conclusion can differ depending on which narrow measure you are assessing, so always consider individual positioning metrics in a broader context.
Let’s start with bonds.
After a bruising three years in bonds (the Bloomberg Agg Index is -16% over the past three years, while 2023 has seen a slight rebound to positive returns at +5%), investors have turned much more bullish on bonds, expecting lower interest rates in 2024.
The Bank of America Fund Manager Survey shows managers are the most overweight and bullish on bonds in 15 years. This is consistent with another data point from the survey that showed the highest percentage on record of managers expecting lower interest rates going forward. If there is a pain trade in 2024 that could catch investors flat footed, it could be that rates move higher and not lower, as expected.
BofA Fund Manager Survey Shows Bond Bullishness
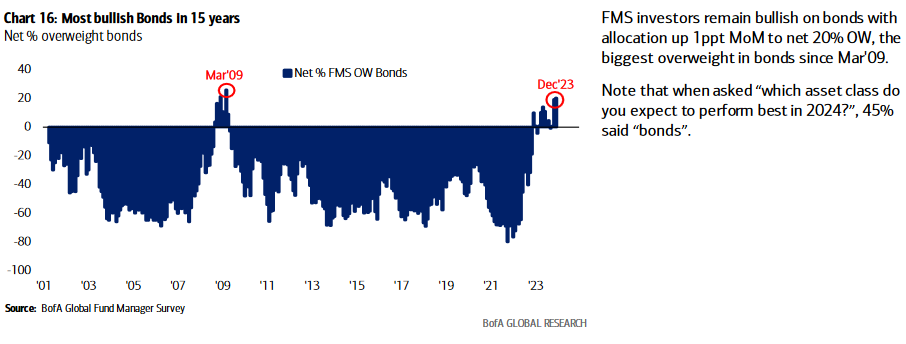
Source: Bofa Global Fund Manager Survey, as of December 2023
Similarly, individual investors seem bullish on bonds as well, with JP Morgan clients reporting they are the most overweight/long bonds since 2010. Note, these investors seemed to get the bond bear right, with max underweight in early 2022!
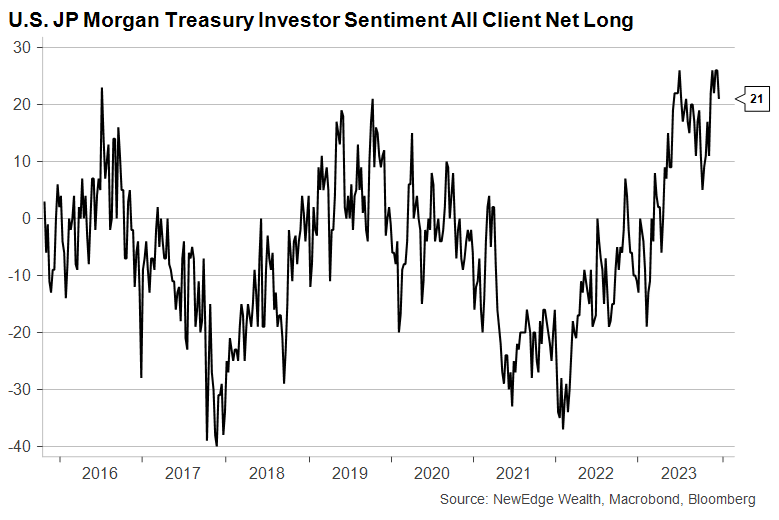
As of: 12-22-23
Moving to equities, let’s start with individual investors. The AAII Asset Allocation Survey shows individual investors with a 65% weighting to stocks, down from the ~70% reached in early 2018 and late 2021. If one is to make a “cash on the sidelines” argument for stocks (investors exiting cash/money market funds as yields fall in order to allocate to equities), you could see this allocation percentage rebound.
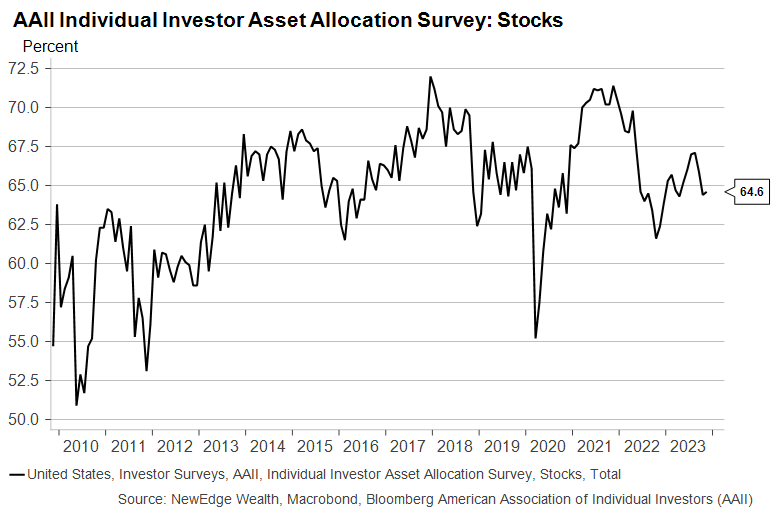
As of: 12-22-23
Note that it is likely that these measures will rebound in the next monthly update, mostly given the record inflows into some equities that have been notched this December. Again, contrast this to December 2022 when outflows from equities reached a record.
For individual investors, we can also measure their risk appetite and positioning by looking at margin loan balances. In the low interest rate, hyper risk-on days of 2021, margin loans surged to nearly $1 trillion. These loan volumes are down 30% from their peak, despite the market being back near prior highs, but there is a possibility that this measure is misleading as risk-hungry investors are turning to tools like 0DTE options to add “juice” to portfolios.
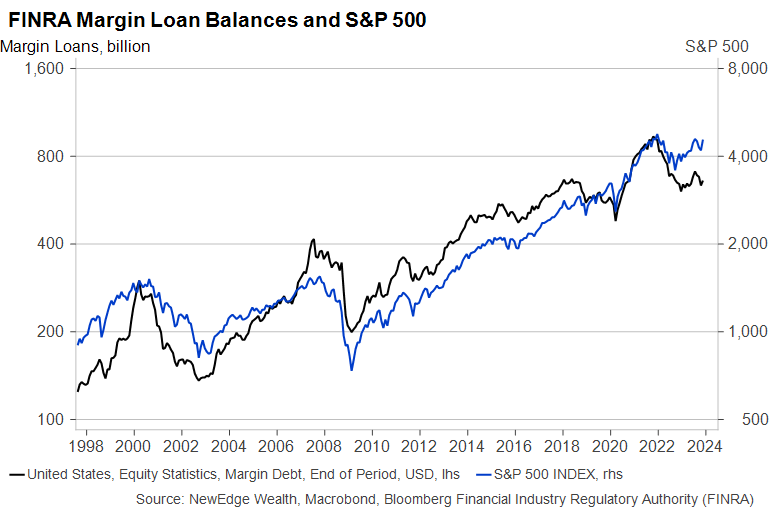
As of: 12-22-23
Looking at institutional investors, we can see that after resisting for much of 2023, fund managers have turned to be overweight equities.
Using the Bank of America Fund Managers Survey again, we can see that managers are reporting to be overweight equities at the highest percentage since early 2022 but are still below long-term average allocations and well below prior peak allocations. There is arguably still room for managers to get even more overweight equities.
BofA Fund Manager Survey Shows Equities Now Overweight
Source: Bofa Global Fund Manager Survey, as of December 2023
The National Association of Active Investment Managers paints a similar story: vastly more overweight equities compared to the start of 2023, but not yet to the same degree of overweight as 2018 or 2021/2022.
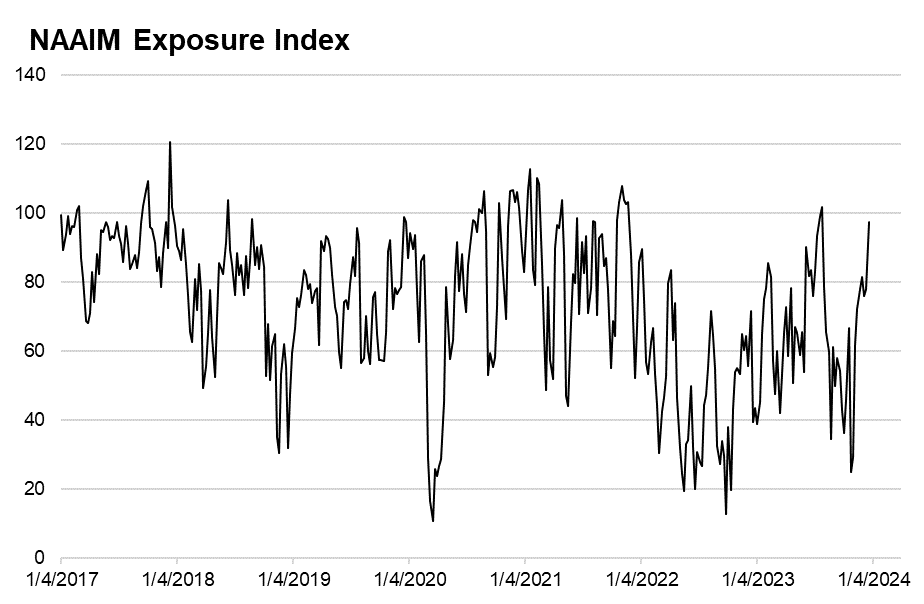
Source: National Association of Active Investment Managers, as of 12/20/23
Looking at shorter term traders, Goldman publishes positioning metrics for CTAs, often trend-following hedge funds that trade in derivatives. Here we can see that strong markets have resulted in CTAs now being the most overweight equities going back to 2015. This positioning can turn on a dime, where a little weakness in markets could cause CTA’s to quickly sell equity futures (buying begets more buying, selling begets more selling).
Goldman Global CTA Stock Positioning
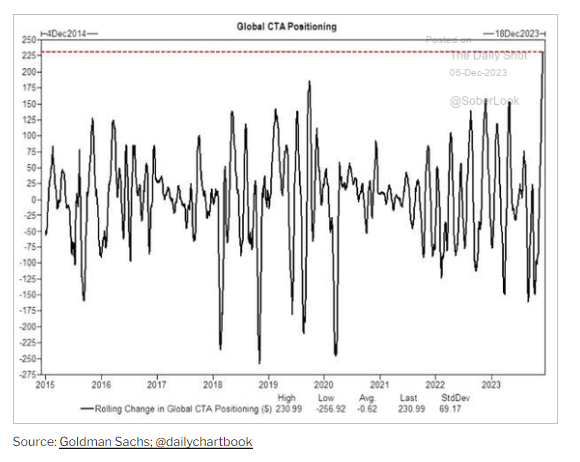
Source: Goldman Sachs via The Daily Shot, as of 12-18-23
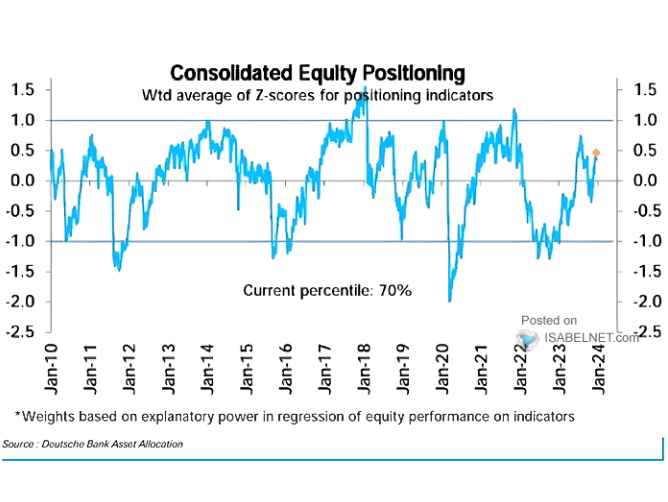
To pull all this together, Deutsche Bank publishes a Consolidated Positioning Indicator, which shows that overall equity positioning is now overweight, which is very different than the start of 2023’s deep underweight, but it is just in the 70th percentile of overweight readings. This indicates that there is more room for broad investors to get further overweight equities before reaching extremes, such as in early 2018, early 2020, and early 2022.
Deutsche Bank Consolidated Equity Positioning: December 18, 2023
Source: Deutsche Bank Asset Allocation, via Isabelnet, as of 12/18/23
We would be remiss not to mention positioning on a sector basis to get a sense of where investors are crowded within the equity market. Flows into Technology stocks have been extraordinary in 2023, with every other sector seeing outflows or minuscule inflows. Compare this to late 2022, when investors were fleeing tech stocks in droves, which of course set up for 2023’s strong Tech performance.
Deutsche Bank Equity Sector Flows
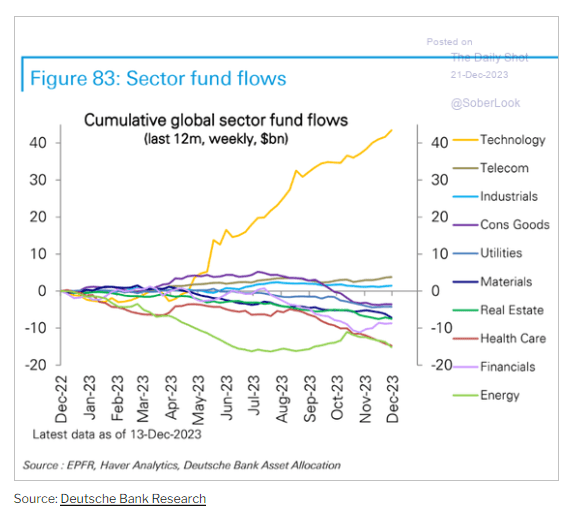
Source: Deutsche Bank via The Daily Shot, as of 12-21-23
Overall, bullish bond positioning does look crowded and could be considered a potential area for surprise in 2024. For equities, positioning is much more overweight than early 2023, but is still below extremes reached in 2018 and 2021/2022. This suggests that there is room for more investors to get drawn into the market, holding all else equal. Lastly, where equity positioning does look crowded is in the technology sector, which could present a headwind in 2024 even if Tech fundamentals remain resilient (or it could continue to get more crowded like during the late 90s!).
Conclusion
Bernard Baruch, an American financier in the early 1900s, is purported to have once quipped: “The main purpose of the stock market is to make fools of as many men as possible.”
He seems to have been right, with ample historical data that shows investors have often become most confident and overweight assets near price tops, and most pessimistic and underweight assets near price bottoms. It is for this reason that we should always take a cold assessment of the current market mood, even if these readings are not exacting timing tools.
As we enter 2024, and if markets continue to rally robustly to start the year, we will have to monitor these sentiment and positioning measures closely for signs of complacency, when factors like sentiment and positioning become risks in and of themselves.
We wish all readers a happy and healthy holiday season. We will not be publishing next week, so look for us in the New Year!
IMPORTANT DISCLOSURES
Index Information: All returns represent total return for stated period. S&P 500 is a total return index that reflects both changes in the prices of stocks in the S&P 500 Index as well as the reinvestment of the dividend income from its underlying stocks. Dow Jones Industrial Average (DJ Industrial Average) is a price-weighted average of 30 actively traded blue-chip stocks trading New York Stock Exchange and Nasdaq. The NASDAQ Composite Index measures all NASDAQ domestic and international based common type stocks listed on the Nasdaq Stock Market. Russell 2000 is an index that measures the performance of the small-cap segment of the U.S. equity universe. MSCI International Developed measures equity market performance of large, developed markets not including the U.S. MSCI Emerging Markets (MSCI Emerging Mkts) measures equity market performance of emerging markets. Russell 1000 Growth Index measures the performance of the large- cap growth segment of the US equity universe. It includes those Russell 1000 companies with relatively higher price-to-book ratios, higher I/B/E/S forecast medium term (2 year) growth and higher sales per share historical growth (5 years). The Russell 1000 Value Index measures the performance of the large cap value segment of the US equity universe. It includes those Russell 1000 companies with relatively lower price-to-book ratios, lower I/B/E/S forecast medium term (2 year) growth and lower sales per share historical growth (5 years). The BBB IG Spread is the Bloomberg Baa Corporate Index that measures the spread of BBB/Baa U.S. corporate bond yields over Treasuries. The HY OAS is the High Yield Option Adjusted Spread index measuring the spread of high yield bonds over Treasuries.
Sector Returns: Sectors are based on the GICS methodology. Returns are cumulative total return for stated period, including reinvestment of dividends.
The views and opinions included in these materials belong to their author and do not necessarily reflect the views and opinions of NewEdge Capital Group, LLC.
This information is general in nature and has been prepared solely for informational and educational purposes and does not constitute an offer or a recommendation to buy or sell any particular security or to adopt any specific investment strategy.
NewEdge and its affiliates do not render advice on legal, tax and/or tax accounting matters. You should consult your personal tax and/or legal advisor to learn about any potential tax or other implications that may result from acting on a particular recommendation.
The trademarks and service marks contained herein are the property of their respective owners. Unless otherwise specifically indicated, all information with respect to any third party not affiliated with NewEdge has been provided by, and is the sole responsibility of, such third party and has not been independently verified by NewEdge, its affiliates or any other independent third party. No representation is given with respect to its accuracy or completeness, and such information and opinions may change without notice.
Investing involves risk, including possible loss of principal. Past performance is no guarantee of future results.
Any forward-looking statements or forecasts are based on assumptions and actual results are expected to vary from any such statements or forecasts. No assurance can be given that investment objectives or target returns will be achieved. Future returns may be higher or lower than the estimates presented herein.
An investment cannot be made directly in an index. Indices are unmanaged and have no fees or expenses. You can obtain information about many indices online at a variety of sources including: https://www.sec.gov/answers/indices.htm.
All data is subject to change without notice.
© 2026 NewEdge Capital Group, LLC

