


Phew, for a minute there, I lost myself
“Karma Police”, Radiohead
Much like the exasperated runner at the end of Radiohead’s iconic “Karma Police” music video, this week President Trump effectively threw a lit match into a stream of gasoline that was connected to global markets.

The S&P 500 shed an incredible $5 trillion in market value over a mere two-day period, experiencing the most rapid drop on a percentage basis since the March 2020 COVID swoon.
This week’s market-rattling tariff announcement has sparked a fierce debate amongst market participants: are these announced tariffs a negotiating tactic, with the full extent of the tariffs unlikely to be applied, OR are these tariffs an essential part of an attempt to majorly restructure the U.S. economy, with the economic and market pain caused by these trade taxes seen by the administration as a necessary cost to achieve their long-term goals.
Many market participants are hoping for the former, expecting “deals” to be announced that walk back Wednesday’s poster board of tariffs (more on that below). This could very well happen as markets plunge and voter discontent swells, but we have been arguing all year that one of the “great follies” of this market was that it was not taking President Trump at his word, seeing his statements as only rhetoric and unlikely to be enacted. Further, we have been arguing that the market has been expecting “just the right stuff” from DC, creating a scenario where policy risks were skewed to the downside.
As President Trump presented his tariff plan in the Rose Garden on Wednesday, the latter of the two scenarios in this tariff market debate, the one where tariff pain is seen as a necessary cost of “rebalancing” the global economy, seemed to carry sharp truth. Trump lauded long-past economic orders where tariffs, not income taxes, were the main source of government tax receipts, and he repeated his long-used refrain (going back to 1987) that other countries were taking advantage of the U.S. in trade relations.
In a way, President Trump was donning the uniform of a “Trade Karma Policeman” and proclaiming, with exhibits, “this is what you get when you mess with us!” (maybe with a similar sneer to Thom Yorke draped over a leather bench seat).
The reality is that both sides of the tariff debate are likely to eventually be true, as is often the case in debates. Tariffs are a cherished policy tool by President Trump (as Neil Dutta of RenMac has quipped: “Why are you surprised? The guy ran on tariffs being his favorite word in the dictionary!”), but the pain of enacting the tariffs as currently planned would be so severe that eventually these policies could be dampened.
This week’s Edge will start by looking at the haphazard calculation and construction of these tariffs, and move on to the economic and earnings impacts, along with the Fed’s reaction to these developments, mostly in the fact of lingering hard data resilience. We will wrap by assessing the current “flush” metrics of the equity market to get a sense of the near-term path forward for the market. The punchline there is that equity markets have gotten oversold and indiscriminately sold enough that we could see a near-term bounce/tradeable low. It’s a lot to tackle, so let’s dive in.
“He Talks in Maths”: Wednesday Tariff Calculation and Construction
As the tariffs were introduced on Wednesday afternoon, online sleuths immediately took out their pocket calculators to begin deducing how and why the individual country rates were determined. The “how” became clear in a matter of minutes. Rather than levying tariffs on each country’s exports in proportion to the tariffs they charge for U.S. goods, the Trump administration calculated the tariff rates using the size of the countries’ trade deficits with the U.S.
Tariff rates have little if any correlation to trade deficits, which arise from differences in national wealth, savings, and comparative advantages. Switzerland, for example, charges no tariffs for U.S. goods but runs a large trade surplus thanks, in part, to Americans’ love of expensive watches and delicious chocolate. Brazil, on the other hand, maintains high tariffs but actually runs a small trade deficit with the U.S. Using the White House’s formula, the tariff on Swiss goods is now 31% while Brazilian goods are taxed at only 10%.
These calculations contain a clue as to the “why” of this week’s tariff rollout. The administration would likely have used reciprocal tariffs if its goal was to lower overall tariff rates. Instead, it took an approach that is likely to lower trade volumes (and thus global growth!). There is little that a country like Switzerland, for example, can offer the U.S. to have its proposed 31% tariffs reduced. It already taxes U.S. imports at 0%.
If the administration’s goal is, indeed, to encourage a massive onshoring of industry by making imported goods less attractive, the tariffs will need to remain in place for years. And goods like coffee and bananas, which are not produced at all in the U.S., will be permanently more expensive.
The end result of actually applying these haphazard, trade deficit-focused tariffs is clearly growth-negative, a dynamic we explore in the next section.
“And We Have Crashed Her Party”: The Economic and Earnings Implications
In addition to reducing global trade volumes, the domestic economic actuality is that these tariffs, if fully applied, would represent the largest tax increase in modern U.S. history on both American consumers and businesses (“crashing the party” of the last two years of robust growth).
These tariffs are certainly a growth-negative development for both GDP and corporate earnings, as higher costs will likely reduce demand for goods and services from consumers.
From a business perspective, the ability of businesses to pass on cost increases to consumers will determine the potential severity of the hit to company profit margins. If cost increases are able to be passed through, like they were in the stimulus-fueled COVID consumption boom, company margins can actually expand, but we think it is far more likely that companies struggle to pass all of the costs through to today’s cash-strapped consumers. This implies that higher input costs will hit corporate margins, which means that companies may turn to other cost reductions, like layoffs or pulling back on investment, in order to protect profitability. This is one way that this tariff policy could result in higher unemployment and weaker GDP growth.
Adding another wrinkle to this situation is the stock market’s tariff-driven plunge, which could potentially disrupt the powerful “wealth effect” that has fueled above-trend consumer spending over the past two years of. With the top 10% of income earnings generating nearly 50% of total consumption in the U.S., and these top households having outsized exposure to financial assets, it is likely that a deep and protracted swoon in markets will cause this wealthy workhorse of the American economy to pull back on spending (this was a key downside risk that we highlighted in our 2025 Outlook).
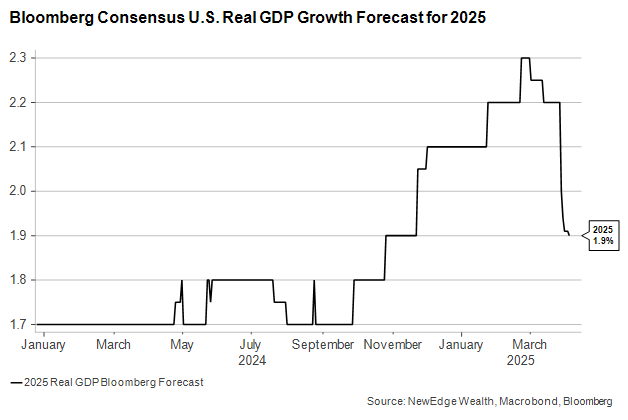
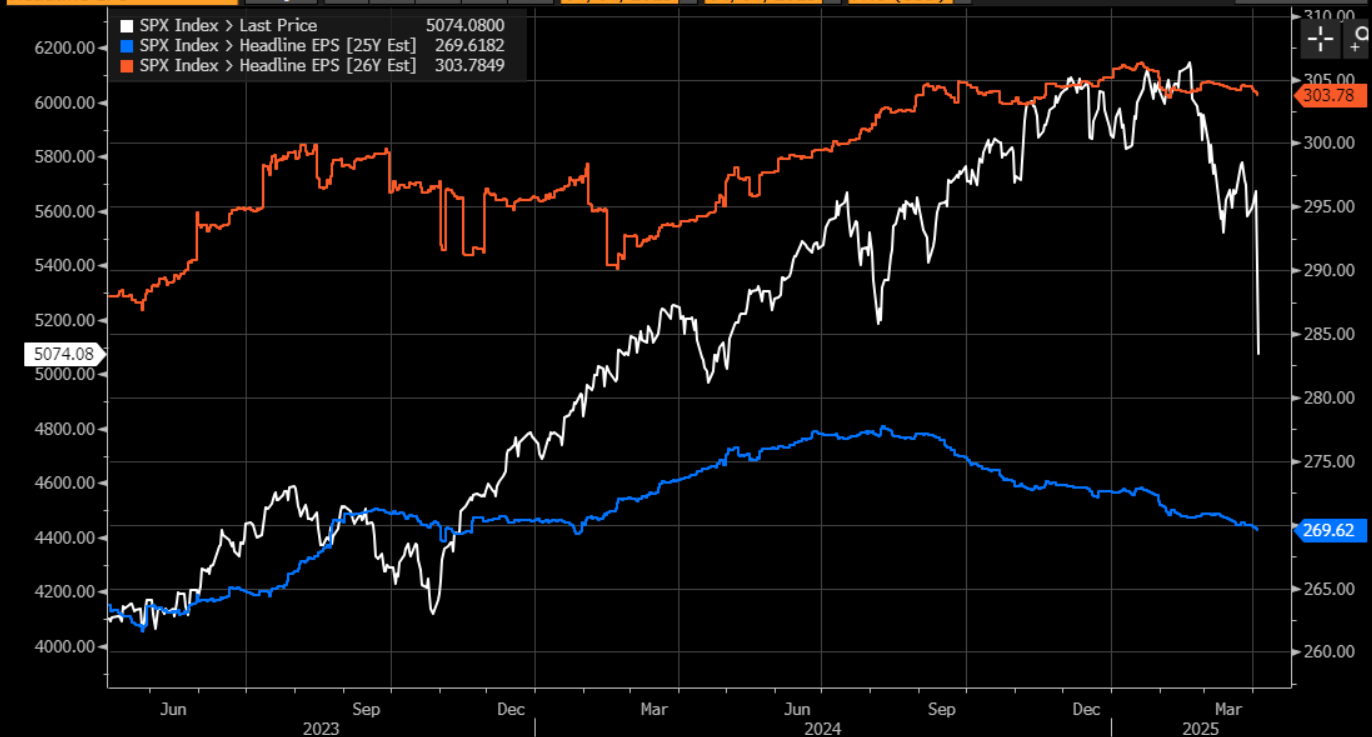
All of this suggests that both GDP and corporate profit estimates are currently too high. The street is forecasting 1.9% for 2025 GDP growth (down from 2.3% to start the year) and $270/share (+10% YoY) for 2025 S&P 500 EPS (we also think that this makes 2026’s $304 far too high). Even a partial enactment of this tariff plan likely makes these estimates unachievable, which suggests that we remain firmly in the midst of an estimate revision downcycle (a backdrop that is typically challenging for risk assets).
S&P 500 Price with 2025 and 2026 Consensus EPS Forecast
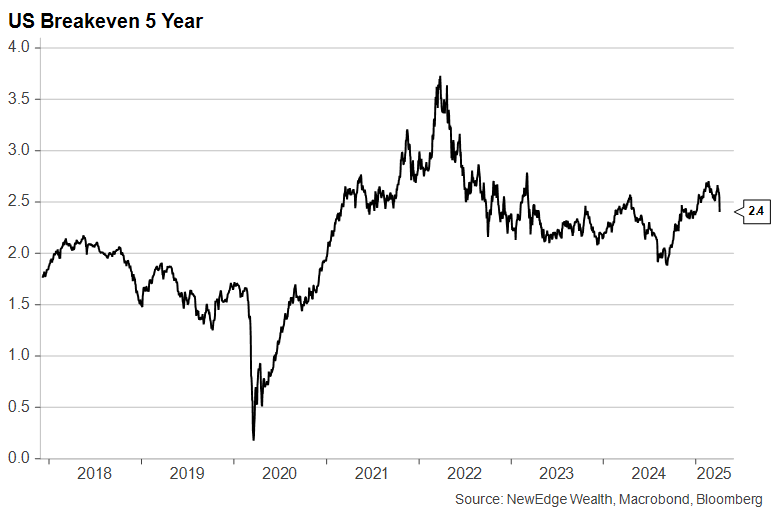
From the inflation perspective, the market is sending a clear signal that it is not concerned that inflation will run away in the short or long term. The USD dropping, Treasury yields falling, oil plunging, and inflation breakeven rates sinking all suggest that the market sees tariffs as a bigger growth negative than an inflation positive.
Notably, we heard from Fed Chairman Powell on Friday, who expressed incremental concern about inflation running hotter, saying it is the Fed’s job to make sure long-term inflation expectations remain well anchored. Based on the reaction of the 5-Year Inflation Breakeven, inflation expectations aren’t just well anchored, they are sinking.
Powell effectively took the near-term “Fed Put” off the table in his Friday speech, saying that they will “wait for clarity before taking further action.” Clarity appears to be the scarcest commodity in today’s economy, so this implies that we will need to see weak hard data before we see the Fed take action (the market currently has a 40% chance of a cut in May and a 90% chance of a cut in both June and July).
But if the Fed wants clarity to cut, they certainly did not get it from Friday’s jobs data.
“I’ve Given All I Can, But We’re still on The Payroll”: Friday’s Jobs Data
To paraphrase Commissioner Jim Gordon in The Dark Knight, the strong March U.S. employment report gave investors the data they deserved but not the one they needed. Strong job growth (+209K private payrolls) and low unemployment (4.15%) are not going to scare the Fed off the sideline to begin cutting interest rates, at least not anytime soon.
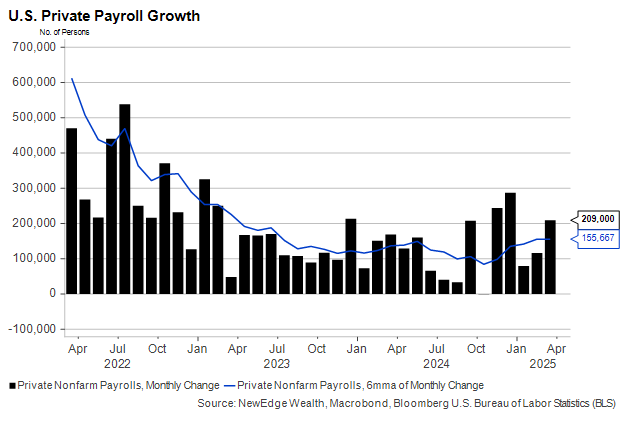
High-profile job culling by the Department of Government Efficiency did not show up in the report. Federal government employment was down by only 4,000 out of 3 million workers. But private wage growth has softened, and hours worked have come down in some key services sectors, which could become an issue if goods prices begin to pick up as a result of the tariffs.
Investors already had plenty of reasons to be alarmed this week. The job report did not add to the list, but continued resilience in the labor market will complicate the Fed’s job moving forward.
“For a Minute There, I Lost Myself”: Flush Check
We wrap this week’s report by looking for signs of flush and panic in equity markets. The good news is that Friday brought enough indiscriminate, rapid, deep selling that we could see a bounce in the near-term, or a “tradeable low”. Further, when many of these metrics hit extremes, like the percentage of names at 20-day lows shown below, forward returns in equity markets improve materially, meaning Friday’s close may not be the ultimate low, but looking out 1-2 years, returns from this level could be above average.
We have been flagging for the past month that many of the market’s “flush” metrics did not trigger, suggesting more downside was possible. We even published at the beginning of last week a “bear market target” of 4,700 on the S&P 500 if a recession and bear market odds were to rise.
But as markets rapidly traded to a mere 5% above that “bear market target” over the course of two days, we paraphrase another great movie character, Ron Burgundy, saying, “Boy, that escalated quickly.”
The good news is that as the market “lost itself for a minute there” in its rapid decline, we have finally triggered many of the major “flush” signals that show signs of capitulation and indiscriminate selling.
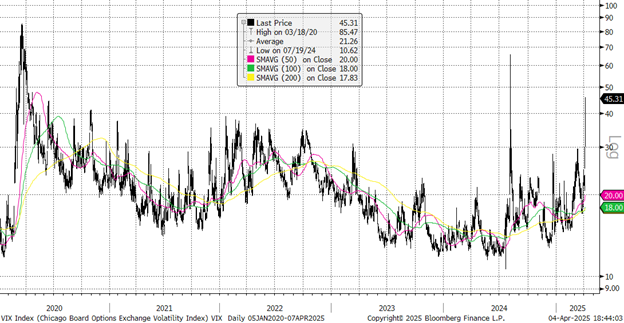
First, the VIX volatility index spiked to 45, which often happens at “climactic lows”.
VIX Index
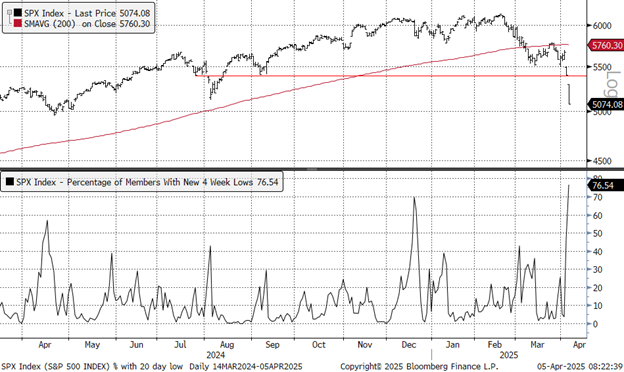
Next, the percentage of S&P 500 names hitting 20-day lows spiked to a whopping 76.5%, an extreme level that captures indiscriminate selling and a flush in sentiment.
S&P 500 with % of Names At 20-Day Lows
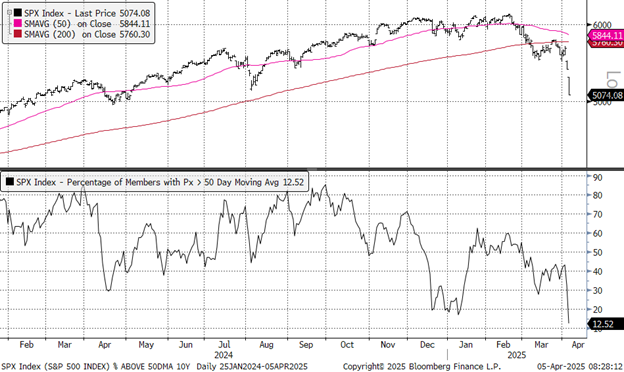
The percentage of names above their 50-day moving average also showed signs of capitulation and flush, dropping to just 12%.
S&P 500 with % of Names Above Their 50-Day Moving Average
Other measures like the Put Call Ratio, short ETF flows, and the percentage of names making multi-standard deviation moves all had elevated/extreme readings on Friday to confirm this oversold/indiscriminately sold state.
Conclusion
After the price action of the last two days, it is easy to feel like the car is on fire, just like at the end of Karma Police.
The path forward for tariff policy remains highly uncertain, making the path forward for the Fed, the U.S. economy, and markets highly uncertain. The good news is that we can return to the numbers and take a longer-term view, given Friday’s price action was so extreme that it creates a setup for much better forward returns. This does not mean that we will see a v-shaped recovery (unless, of course, if tariffs are walked back significantly), that volatility is over, or even that we have even seen the ultimate low. However, in times like this, we always remember the great line from Walter Deemer: “When it comes time to buy, you won’t want to.” Patience, a calm mind, and likely Radiohead turned up to 11 are necessary companions in navigating this unprecedented time.
IMPORTANT DISCLOSURES
The views and opinions included in these materials belong to their author and do not necessarily reflect the views and opinions of NewEdge Capital Group, LLC.
This information is general in nature and has been prepared solely for informational and educational purposes and does not constitute an offer or a recommendation to buy or sell any particular security or to adopt any specific investment strategy.
NewEdge and its affiliates do not render advice on legal, tax and/or tax accounting matters. You should consult your personal tax and/or legal advisor to learn about any potential tax or other implications that may result from acting on a particular recommendation.
The trademarks and service marks contained herein are the property of their respective owners. Unless otherwise specifically indicated, all information with respect to any third party not affiliated with NewEdge has been provided by, and is the sole responsibility of, such third party and has not been independently verified by NewEdge, its affiliates or any other independent third party. No representation is given with respect to its accuracy or completeness, and such information and opinions may change without notice.
Investing involves risk, including possible loss of principal. Past performance is no guarantee of future results.
Any forward-looking statements or forecasts are based on assumptions and actual results are expected to vary from any such statements or forecasts. No assurance can be given that investment objectives or target returns will be achieved. Future returns may be higher or lower than the estimates presented herein.
An investment cannot be made directly in an index. Indices are unmanaged and have no fees or expenses. You can obtain information about many indices online at a variety of sources including: https://www.sec.gov/answers/indices.htm.
All data is subject to change without notice.
© 2026 NewEdge Capital Group, LLC
