


Do you have to, do you have to, do you have to let it linger?
Oh, I thought the world of you
I thought nothing could go wrong
But I was wrong, I was wrong
“Linger”, The Cranberries
Inflation is lingering around, meaning U.S. economic data continues to support our view that there is little urgency for the Fed to ease policy as swiftly and aggressively as bond markets have been pricing in.
This week’s lingering hot CPI and PPI data caused a jump in yields and an unwind in rate cut bets.
Consumer prices, CPI, came in slightly higher than forecasts, with Core CPI (ex food and energy) year-over-year +3.8% versus 3.7% expected.
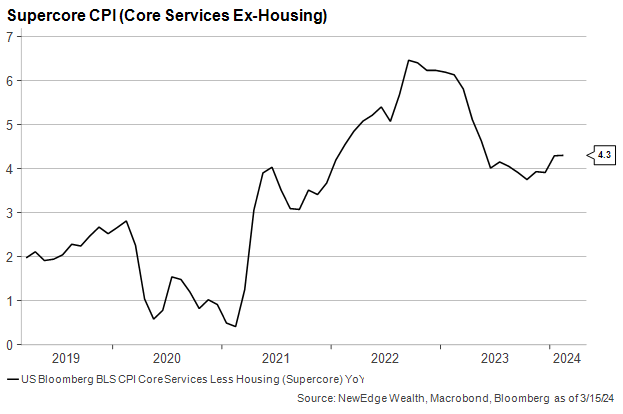
As seen below, Supercore inflation (core services ex housing), the Fed’s newest must-watch metric, remained sticky at 4.3% for the month, not supporting the Fed’s hope for a continuation of 2023’s immaculate disinflation (the Fed was just as Dolores O’Riordan sang, thinking “nothing could go wrong”).
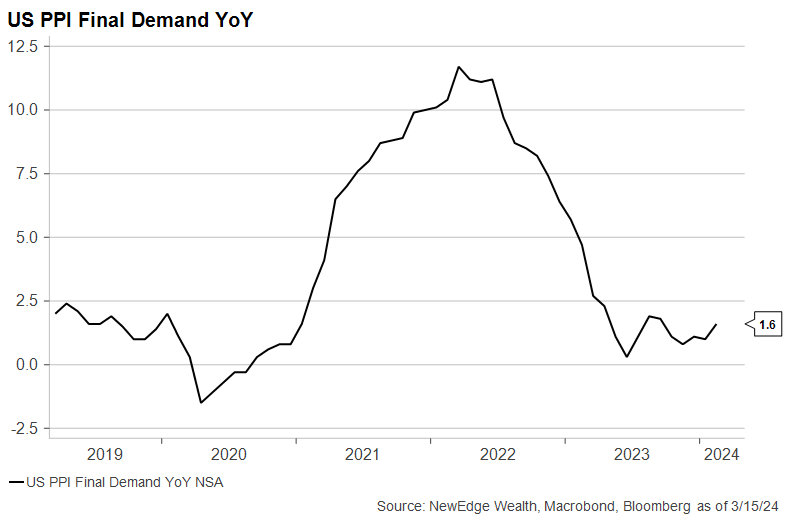
Producer prices, PPI, was the more meaningful upside surprise. PPI Final Demand was double what consensus expected on a month-over-month basis, coming in at +0.6% vs. 0.3% expected. Looking at the year-over-year chart for PPI, you can see a stalling out of the immaculate disinflation as well.
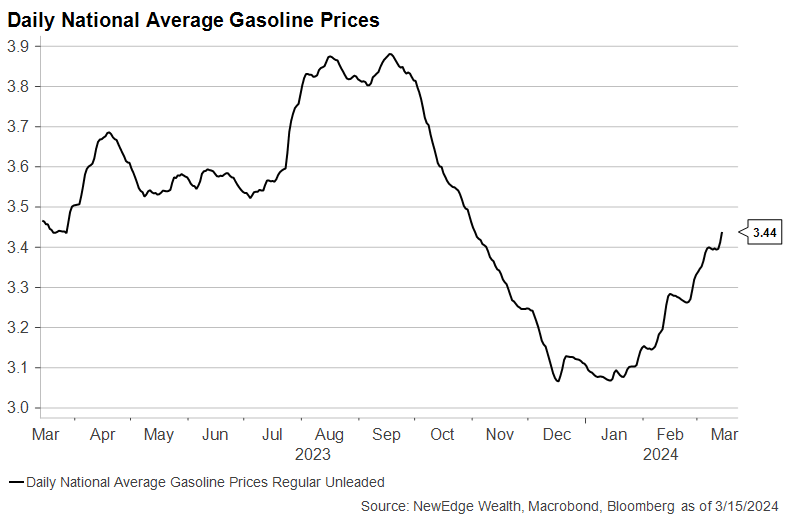
A good portion of this rise in producer prices came from the recent climb in energy prices. Energy contributed 0.24 percentage points to the 0.6% month over month rise in producer prices. This is one reason why we continue to watch gasoline prices closely, which have been steadily rising to start the year and are now up +11% since mid-January.
This rise in gasoline prices also found its way into this week’s weaker-than-expected retail sales data. The February Retail Sales Control Group, which excludes gas station sales, was flat versus the +0.4% expected. This softer consumption data partially reflects higher gas prices, which were +0.9% on the month and likely ate into consumers’ discretionary spending.
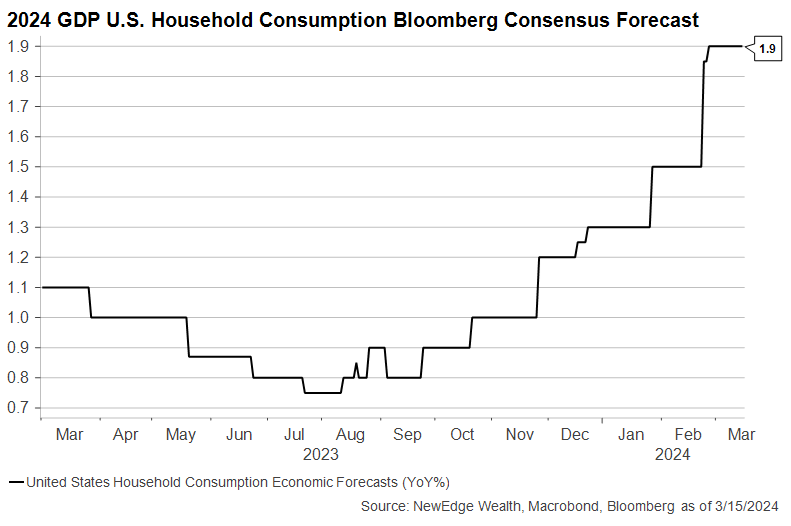
As of now, softer retail sales in January and February have not made their way into lower forecasts for consumer spending in 2024. As seen in the chart below, analysts have continued to raise their forecasts for GDP Household Consumption.
This stickiness in inflation is causing the bond market and Fed’s desired turbulence-free descent in inflation to hit some bumpy air. The end result is an unwind of pricing of Fed rate cuts and a rise in yields.
Here you can see the Fed Funds Futures pricing (using Bloomberg’s World Interest Rate Probabilities) for the number of rate cuts expected by December of this year. This pricing has gone from an ultra-dovish 6.5 cuts in mid-January to just 3 cuts today.
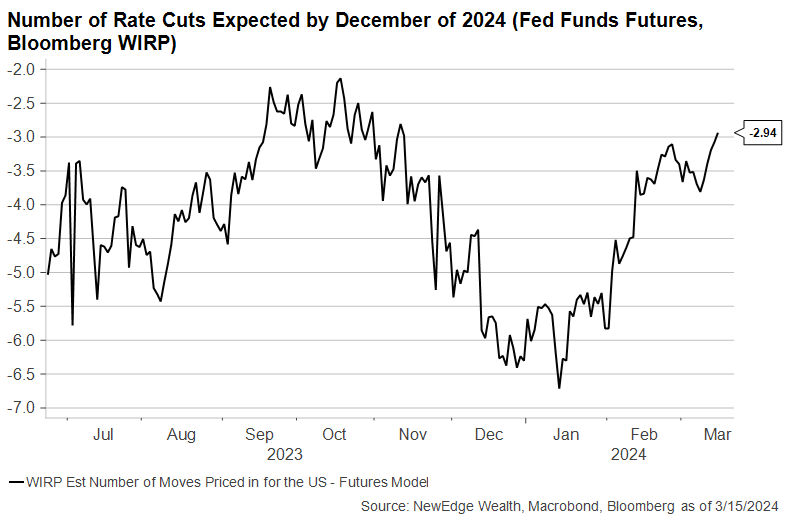
We think this pricing for the number of cuts is far more reasonable, but still could face challenges if inflation data continues to come in hot.
Further, we think Jim Bianco’s recent argument that the Fed has a narrow window to begin cutting is important. Jim argues that if the Fed does not cut by May or June, they will have missed their window to alter policy before acting too close to the 2024 election (with July, September and November potentially off the table given election events timing).
This could mean that if the Fed does not cut by May or June and data does not give the Fed a good reason to cut (such as a string of soft jobs data that suggests a sharp weakening in the economic environment), the Fed may not have the degrees of freedom to deliver on the three cuts it showed in its December Dot Plot.
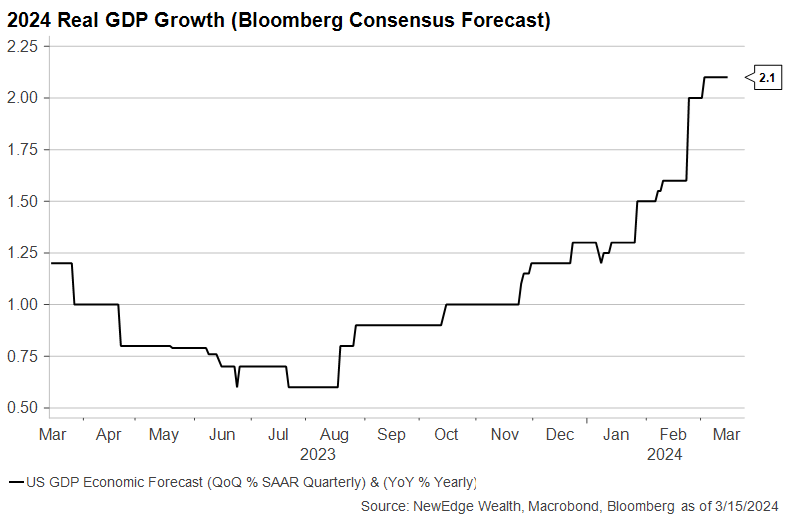
To the point of the Dot Plot and the Summary Economic Projections, next week the Fed will provide an update to these forecasts.
It may be too early for the Fed to shift its forecasts too much, but we would not be surprised to see a higher forecast for 2024 GDP and possibly a slight shift higher in the median dot for 2024 rates. On the GDP front, in December the Fed forecasted 1.4% for 2024, which at the time aligned with consensus forecasts as well. However, since December, 2024 GDP forecasts have been revised up materially to 2.1%, as seen below.
As noted above, softer retail sales data should be watched closely, as this data has not caused analysts to lower their forecasts for Household Consumption or broader GDP (which is roughly 70% household consumption).
For markets, this reversal in expectations for the Fed has found its way into bonds more than stocks at this point.
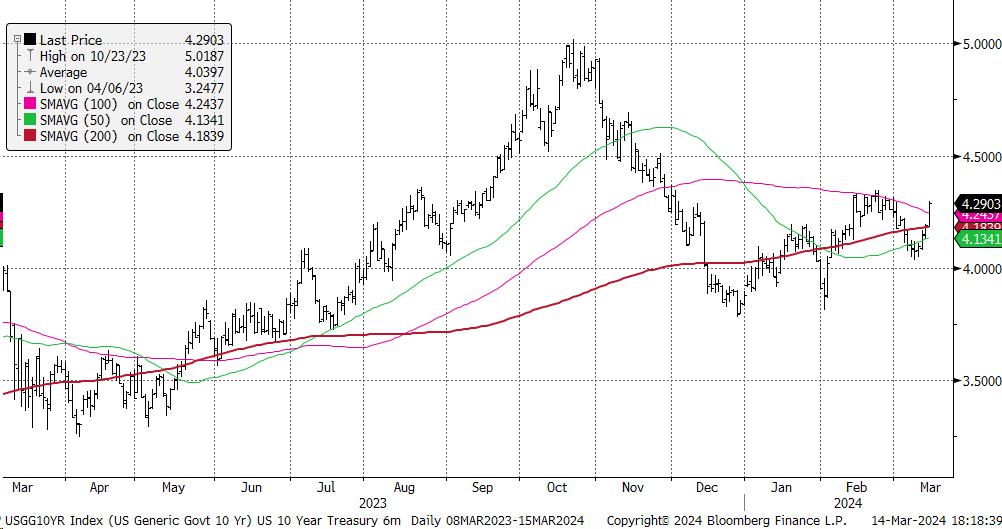
Bond yields jumped in response to the hotter inflation data, with the most notable move occurring in the 10 Year Yield, which shot up above important resistance at its 100-day moving average (pink line in the chart below) for the first time since November.
US 10 Year Treasury Yield
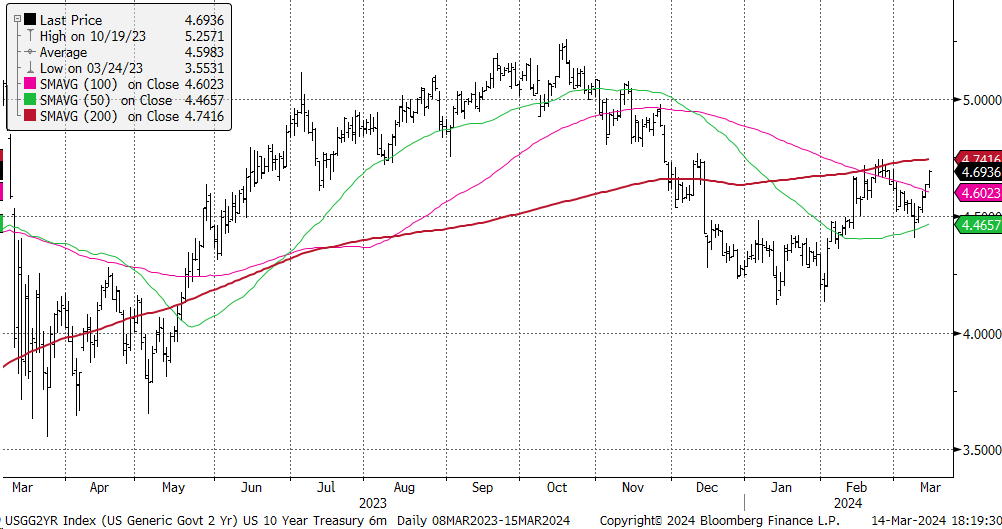
The impact of higher inflation and a tighter Fed was seen in 2-year yields, which moved higher as well, though remain below their own resistance level ~4.75%.
US 2 Year Treasury Yield
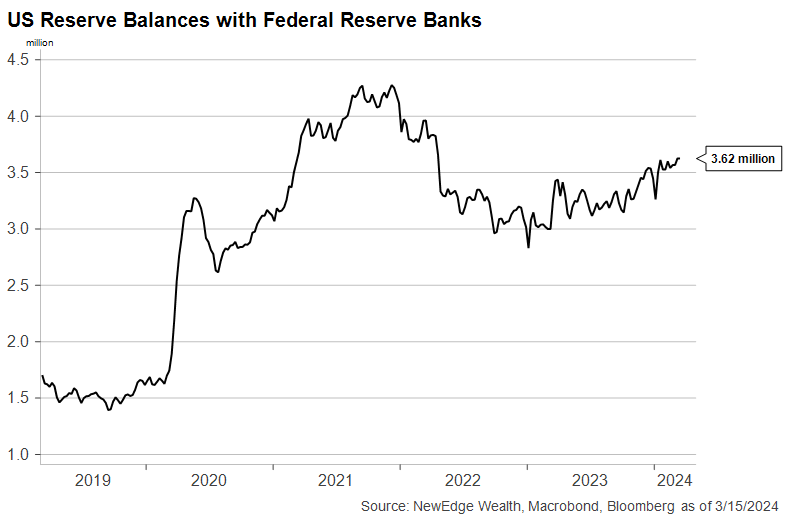
Equities wobbled on Thursday in response to the hotter data, but not in a high volatility way that would suggest a “mode shift”. Equities are likely helped by liquidity, which remains abundant, despite the Fed’s rate policy. A narrow way to estimate liquidity is looking at overall bank reserves, which recently hit a new a new year-to-date high. The draining of reserves and tightening of liquidity that occurred during 2022’s tightening has reversed since 2023, likely supporting risk asset valuations and buoyant prices.
If yields continue to rise, though, we could see an uptick in volatility and a bout of weaker trading, similar to the experience of 3Q23’s softer markets. Higher yields could eventually bring challenge to the S&P 500’s stretched valuation, which at 21x forward is back to levels only seen in 2020/2021’s policy-fueled surge and the late 1990’s tech bubble.

Importantly, resilient equites are also reflecting resilient growth expectations, with 2024 and 2025 S&P 500 EPS estimates remaining stable in recent weeks, while credit spreads continue to send a signal of optimistic growth expectations.
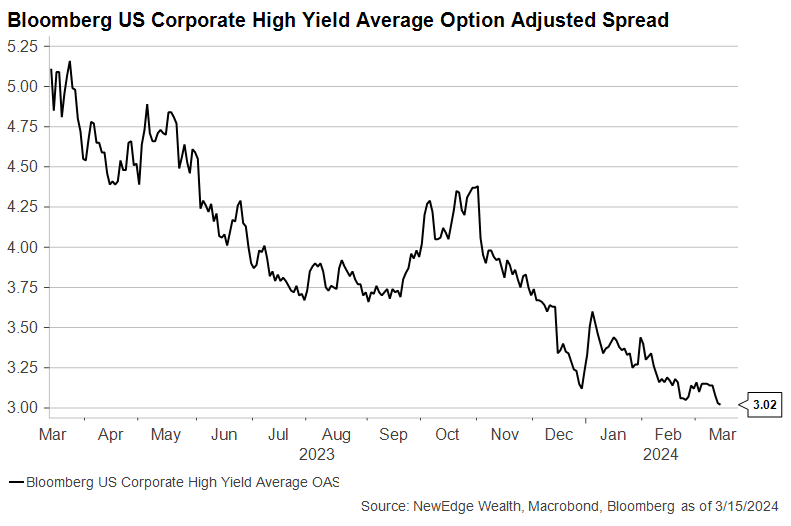
High Yield credit spreads made a new year-to-date low on Thursday, despite the equity wobble. This tightness in spreads could eventually be seen as complacency about growth prospects, but this tends to be a more coincident indicator, meaning if growth were to soften we could see spreads widen materially, and likely result in weaker equity trading as well.
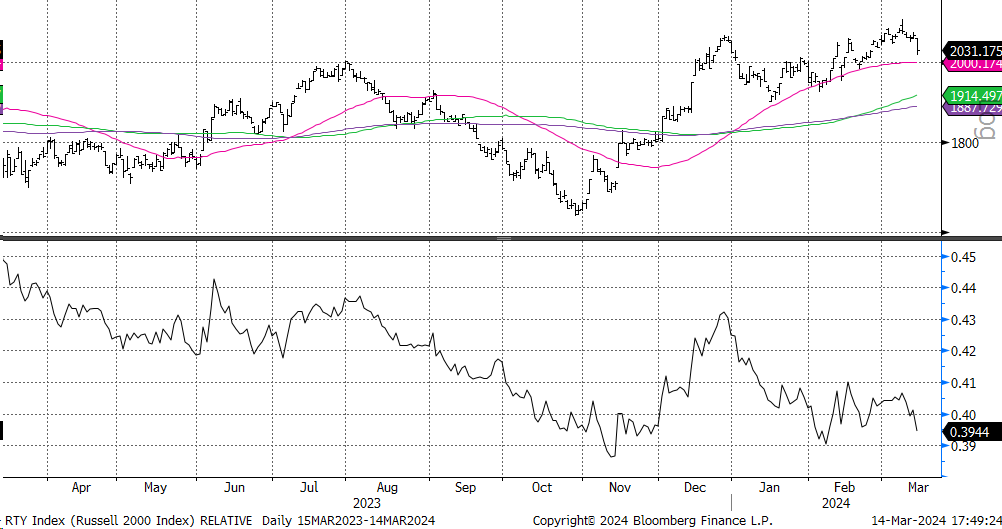
Importantly, not all equities are created equally resilient, with the jump in bond yields hitting small caps particularly hard. The Russell 2000 Small Cap Index is more interest rate sensitive thanks to higher debt levels, higher usage of floating rate debt, and higher proportion of unprofitable companies compared to large cap indices, like the S&P 500.
Russell 2000 Absolute (top) and Relative to the S&P 500 (bottom)
Overall, as we look to next week’s Fed meeting, we expect the Fed to try to keep its options open as much as possible, not necessarily closing the door to cuts in the event of weaker data in the future, but setting the table for a continuation of higher for longer policy if recent data continues. This week’s lingering hot inflation data and election timing continues to reduce the Fed’s flexibility to ease policy. Yields must be watched closely as a potential source of equity volatility, while the rosy growth outlook that has been so supportive for risk assets must be monitored as data progresses.
Top Points of the Week
By Austin Capasso and Ben Lope
1. S&P 500 Hits New All-Time High – This week, the S&P 500 hit a new all-time high driven by the “Magnificent 7” basket of stocks, which make a large weighting in the index. Another positive week of returns would indicate that the S&P has seen positive returns in 17 of the last 20 weeks, a streak not seen since 1964.
2. Rates – The US 10-year Treasury yield popped as high as 4.21% this week after a mixed bag of economic data. This makes us believe the 10-year can get to its 4.35% resistance level.
3. Energy Stocks & Oil Prices – The Energy sector is quietly up 8% over the past month, double the S&P 500 and second only to the Materials sector, after a sustained rally in the price per barrel of WTI crude oil has the commodity trading above $80bbl, or up 11% YTD. Both crude and natural gas prices are at the highest levels since early November. Ukrainian strikes on Russian oil refineries this week added to the rally.
4. Copper – Copper prices moved 5% higher this week to hit an 11-month high. The move higher, which brings the YTD increase to 6%, is mostly due to global supply constraints, but received an extra boost this week with a better-than-expected Chinese CPI report. This report may be an early signal of global demand and production picking up.
5. Hot CPI Report – The widely watched Consumer Price Index (CPI) Report came in hotter than expected on both a headline and core basis. Headline CPI increased 0.4% for the month, which was in-line with expectations, and 3.2% on an annual basis, which was slightly higher than expected. Core CPI, which excludes food and energy components, rose 0.4% on the month versus the 0.3% expected and was up 3.8% on the year against the 3.7% expected. These results indicate an impressive US economy that has continued to be resilient.
6. February US PPI Comes in Higher Than Expected – Powered mostly by increasing energy prices, February US Producer Price Index (PPI) figures increased by 0.6% month over month. This monthly increase was twice as much as economists expected. Although these headline figures certainly contribute to some fears about reemergent inflation, Core PPI figures (which exclude food and energy prices), were up only 0.3% on the month, a touch lower than the 0.5% monthly increase seen in January.
7. Flat US Retail Sales – Retail sales for the US economy rose 0.6% for the month of February. Although this was basically flat versus the forecast, it was a notable increase to the previous month’s result of -1.1%. A bounce back like this underscores an encouraging US economy that was able to remain resilient after a downside surprise in January.
8. Rate Hike Speculation in Japan – The Japanese yen had a sharp rally this week after seeing its largest short positioning since 2012. This is all on speculation if the Bank of Japan (BOJ) will end their negative rate regime by eventually hiking interest rates. An upward revision to Japan’s economic growth last quarter means that the country can avoid a technical recession and slowly move towards more restrictive policy. We plan to monitor ongoing decisions and announcements by the BOJ closely.
9. Earnings Update – The biggest earnings story this week was Adobe (ADBE). Despite reporting 11% revenue growth and 15% EPS growth after Thursday’s close, both of which beat analyst estimates, the stock was down double digits after Friday’s open. This gap down was likely due to management releasing lower-than-expected Q2 revenue guidance, which created some fears amongst investors as to whether the broad adoption of AI in the space will help or hurt the company.
10. The Week Ahead – Fed Day headlines next week , where Jerome Powell and other members of the Federal Reserve will make a decision on the direction of interest rates. It is expected that the Fed will pause on implementing any rate cuts or hikes. We will also get a look into the US housing market, US leading economic indicators, and activity within the US services and manufacturing sectors.
IMPORTANT DISCLOSURES
Abbreviations/Definitions: AI: artificial intelligence; BOJ: Bank of Japan; Core CPI: measures the changes in the price of goods and services, excluding food and energy; Core PPI: measures the change in the selling price of goods and services sold by producers, excluding food and energy; CPI: Consumer Price Index; Dot Plot: The Fed dot plot is published quarterly as a chart showing where each of the 12 members of the FOMC expect the federal funds rate to be for each of the next three years and the long term; EPS: earnings per share; Fed Fund Futures: derivatives that measure expectations of Fed policy; GDP: gross domestic product; Headline CPI: the raw inflation figure reported through CPI that calculates the cost to purchase a fixed basket of goods to determine how much inflation is occurring in the broad economy; Household consumption: consists of expenditures by resident households, and by nonprofit institutions that serve households, on goods and services that are consumed by individuals; PPI: Producer Price Index; Retail Sales Control Group: measures the value in total receipts of retail and food stores in the United States which excludes food services, gasoline, autos and building materials, and is a proxy for goods consumption inside the gross domestic product data; Summary Economic Projections: a quarterly report published by the Federal Reserve, which compiles the economic forecasts of the members of the Federal Open Market Committee, the panel responsible for setting U.S. monetary policy; Supercore inflation—the prices of core services excluding housing; West Texas Intermediate (WTI) Crude: refers to a grade or a mix of crude oil, and/or the spot price, the futures price, or the assessed price for that oil; colloquially WTI usually refers to the price of the New York Mercantile Exchange WTI Crude Oil futures contract or the contract itself.
Index Information: All returns represent total return for stated period. S&P 500 is a total return index that reflects both changes in the prices of stocks in the S&P 500 Index as well as the reinvestment of the dividend income from its underlying stocks. Dow Jones Industrial Average (DJ Industrial Average) is a price-weighted average of 30 actively traded blue-chip stocks trading New York Stock Exchange and Nasdaq. The NASDAQ Composite Index measures all NASDAQ domestic and international based common type stocks listed on the Nasdaq Stock Market. Russell 2000 is an index that measures the performance of the small-cap segment of the U.S. equity universe. MSCI International Developed measures equity market performance of large, developed markets not including the U.S. MSCI Emerging Markets (MSCI Emerging Mkts) measures equity market performance of emerging markets. Russell 1000 Growth Index measures the performance of the large- cap growth segment of the US equity universe. It includes those Russell 1000 companies with relatively higher price-to-book ratios, higher I/B/E/S forecast medium term (2 year) growth and higher sales per share historical growth (5 years). The Russell 1000 Value Index measures the performance of the large cap value segment of the US equity universe. It includes those Russell 1000 companies with relatively lower price-to-book ratios, lower I/B/E/S forecast medium term (2 year) growth and lower sales per share historical growth (5 years). The BBB IG Spread is the Bloomberg Baa Corporate Index that measures the spread of BBB/Baa U.S. corporate bond yields over Treasuries. The HY OAS is the High Yield Option Adjusted Spread index measuring the spread of high yield bonds over Treasuries. The Russell 2000 Index is a small-cap U.S. stock market index that makes up the smallest 2,000 stocks in the Russell 3000 Index.
Sector Returns: Sectors are based on the GICS methodology. Returns are cumulative total return for stated period, including reinvestment of dividends.
The views and opinions included in these materials belong to their author and do not necessarily reflect the views and opinions of NewEdge Capital Group, LLC.
This information is general in nature and has been prepared solely for informational and educational purposes and does not constitute an offer or a recommendation to buy or sell any particular security or to adopt any specific investment strategy.
NewEdge and its affiliates do not render advice on legal, tax and/or tax accounting matters. You should consult your personal tax and/or legal advisor to learn about any potential tax or other implications that may result from acting on a particular recommendation.
The trademarks and service marks contained herein are the property of their respective owners. Unless otherwise specifically indicated, all information with respect to any third party not affiliated with NewEdge has been provided by, and is the sole responsibility of, such third party and has not been independently verified by NewEdge, its affiliates or any other independent third party. No representation is given with respect to its accuracy or completeness, and such information and opinions may change without notice.
Investing involves risk, including possible loss of principal. Past performance is no guarantee of future results.
Any forward-looking statements or forecasts are based on assumptions and actual results are expected to vary from any such statements or forecasts. No assurance can be given that investment objectives or target returns will be achieved. Future returns may be higher or lower than the estimates presented herein.
An investment cannot be made directly in an index. Indices are unmanaged and have no fees or expenses. You can obtain information about many indices online at a variety of sources including: https://www.sec.gov/answers/indices.htm.
All data is subject to change without notice.
© 2026 NewEdge Capital Group, LLC

