


If you built yourself a myth
You’d know just what to give
“Myth”, Beach House
Beach House’s 2012 song “Myth” is the perfect expression of the alternative rock sub-genre of dream pop. It is breathy, ethereal, floaty, and strikingly melodic.
In the song, vocalist Victoria Legrand muses about what happens when the romanticized stories we tell ourselves about someone or something are forced to face a much less reverie-like reality.
We are all prone to occasionally “building ourselves a myth” out of a hope that things can be different or out of an avoidance of reality, and the market is no different.
One of the most popular market myths or hopes in recent years has been the “broadening out trade,” or the expectation that market leadership would begin to include a larger subset of names vs. the ultra-narrow leadership and contribution of groups like the Magnificent 7 or the “AI trade.”
This week’s Edge will look at the status of the broadening out trade and show how it remains a myth for markets for one key reason: earnings. Market performance is narrow because earnings growth is narrow. In fact, earnings growth is getting increasingly narrow this year, as a large portion of this year’s seemingly stellar earnings growth is set to come from just one industry group: semiconductors. This reliance on semiconductors has important implications for the risk profile of markets in the medium term that we must appreciate.
So, dim the lights, maybe light a candle and let the dream pop tunes of Beach House accompany you for this Weekly Edge.
“See the Road You’re On”: Hopes for Breadth
The broadening out “myth” was the hope that 2023-2025’s ultra-concentrated S&P 500 returns would begin to be driven by a broader cohort of names. After all JPM’s Michael Cembalest estimated that 78% of the S&P 500’s return during these three years came from just 42 AI-driven stocks, with 66% of the S&P 500’s earnings driven by these names as well.
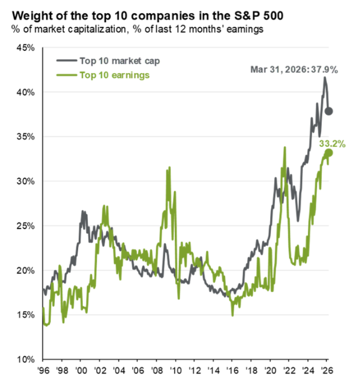
The broadening out “myth” was also the hope that the degree of concentration in the S&P 500, currently nearing 40% for the top 10 names, would start to ebb.
The chart below from JPM shows this market concentration over time and captures how the start to 2026 fanned the hopes that we were finally getting a broadening, as concentration statistics fell thanks to an “everything else” rally to start the year. However, given April’s powerful yet narrow market performance, it is likely that concentration statistics will begin to rise again.
To see this April dashing of broadening out hopes, we can look at the relative performance of the Equal Weight S&P 500 vs. the Capitalization Weight S&P 500 in the chart below (the line in the bottom panel moving lower reflects Equal Weight underperforming Capitalization Weight, a sign of narrowing in the market).
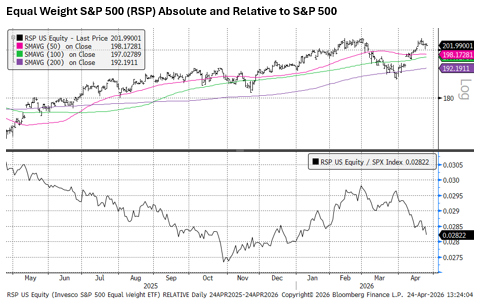
At its 2026 peak, the Equal Weight Index was outperforming the S&P 500 by 7%, but thanks to April’s narrow rally, this outperformance has been whittled down to just 1%.
“Materialize or Let The Ashes Fly”: Earnings Are The Driver
We have long been arguing that for a broadening out of market returns to be sustained, it would have to be supported by earnings, meaning both earnings growth and earnings revisions would need to “materialize” for a broader cohort of names.
Once again in 2026, we are seeing a rather narrow subset of names driving the vast majority of the earnings growth for the S&P 500, and fascinatingly, this subset is even more narrow and concentrated than it was in 2022-2025.
Below you can see sector earnings revisions for 2026. Bars that are shaded green are sectors with 2026 EPS growth estimates that have been revised higher in the first four months of this year, while bars that are shaded red reflect EPS growth estimates cuts. Notably, just four sectors have seen EPS revisions higher this year (Tech, Materials, Utilities, and Energy), while all other sectors have seen estimates get trimmed.
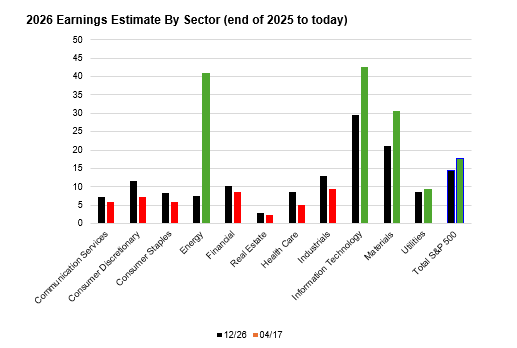
It is important to add the context of index weights to these considerations. Energy is just a 4% weight in the S&P 500, Utilities are a 2.5% weight, and Materials are a 2% weight. These are tiny influences on the S&P 500 in comparison to Tech’s 33% weight and even pale in comparison to NVDA’s chunky 7.6% weight in the index.
This highlights how the stellar 43% earnings growth that is expected for the weighty tech sector will drive the vast majority of the total S&P 500 EPS growth in 2026. But drilling down even further, we can see that it is not all of tech driving these powerful earnings; instead, it is coming primarily from semiconductors.
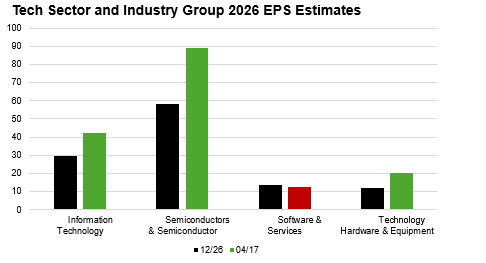
The chart below shows the same analysis of 2026 EPS growth expectations today vs. the end of last year for the Tech sector’s sub-industry groups. You can see how the semiconductor group has experienced a huge jump in its expected earnings growth (to nearly 90% for 2026!), while Software earnings have been trimmed slightly and Tech Hardware has been revised higher. Note that this Tech Hardware EPS growth and positive revision is directly related to the semi trade as well, as a name like Sandisk (SNDK), a flash memory semiconductor company, is included in this cohort and has seen a 5.6x increase in its 12-month forward EPS estimates in the last 4 months!
What is fascinating about 2026 is that due to the strength of semiconductors, we have seen the source of earnings growth in the S&P 500 narrow even further compared to the Magnificent 7 driven market of 2023-2025.
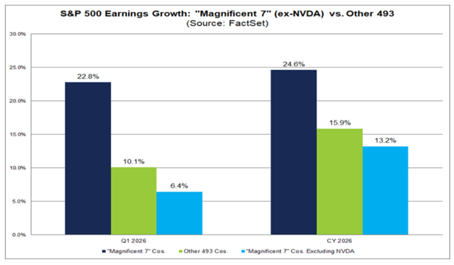
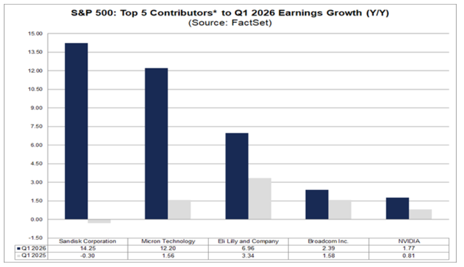
The analysis from Factset below shows that when you remove NVDA from the Magnificent 7, this cohort’s pace of earnings growth for 2026 gets cut in half, leaving Mag 7 to grow below the pace of the 493. But before you get excited that this superior 493 growth is a sign of broadening out, appreciate that this growth is also being significantly boosted by the semi trade, with three of the four largest contributors to the 493 growth being Broadcom (AVGO), Sandisk (SNDK) and Micron (MU).
The whole market has become incredibly leveraged to the semiconductor trade, which has important implications that we will explore below.
“What Comes After This Momentary Bliss?”: Implications of a Semiconductor-Driven Rally
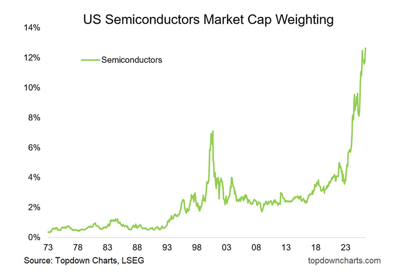
The U.S. equity market has never been more exposed and sensitive to the fate of semiconductor stocks than at this present moment.
The chart below from Callum Thomas shows the historical weighting of semiconductors in the S&P 500 and how it has catapulted up to a whopping 14% given the AI-fueled rally (double the tech-bubble weight in 2000).
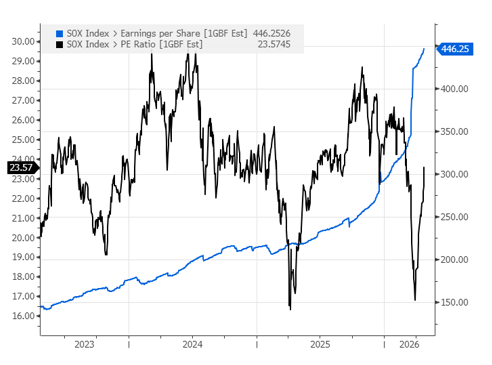
As we showed in the prior section, the strength in semiconductor stocks has been driven by a true boom in semiconductor earnings, which the chart below shows have hockey-sticked higher in 2026.
But Beach House had the right sentiment when they asked “what comes after this momentary bliss?”
Semiconductors are a notoriously cyclical industry, prone to all the vicissitudes of a capital-intensive industry like bull-whip inventory cycles (double ordering, pull-forward of demand, etc.), powerful incremental/decremental margins in upcycles/downcycles, and over-investment.
We are in the midst of what is arguably the most powerful upcycle this industry has ever experienced, but even as that makes any cycle-watcher nervous about an eventual bust, we must appreciate that analysts have been underestimating the power and duration of this semi upcycle since the start of the AI boom (for example, NVDA’s earnings estimates for this year are 16x larger than they were 3 years ago!).
Based on demand signals and supply constraints, as analyzed by our Jay Peters, it looks as if the powerful upcycle for semiconductors still has legs (though we would argue that being three years in, we could be closer to the end than we are to the beginning). However, eventually this cycle will slow and turn lower, which means that the outsized tailwind semis are having on S&P 500 EPS and returns in recent years could flip to an outsized headwind.
Said another way, the surge in the weight and contribution of semiconductors to the S&P 500 makes the index more cyclical and sensitive to the vagaries of the semiconductor cycle. It also must be noted that the stocks will typically sniff out a peak in earnings long before the actual peak materializes, so volatility in the stocks could come before earnings begin to fade.
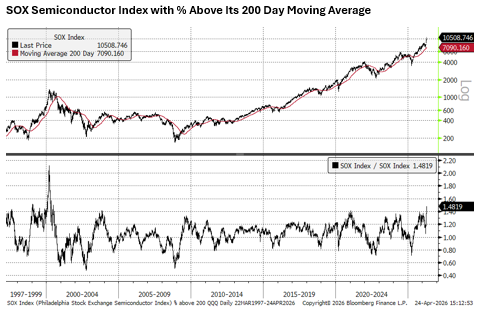
Speaking of semiconductor stock prices, the last three weeks of trading have been historically powerful, with the SOX semiconductor index +48% from the March lows.
The chart below shows how the semiconductor index is now trading 48% above its 200-day moving average (a way to capture how “overbought” an index is, moving up above its trend lines very far, very fast). This stat was only bested back at the start of 2000, when the semiconductor index rallied nearly 100% in the first three months of the year. This proved to be a “blow off top” for the stocks, followed by a brutal bear market. Oh, and it took 18 years to retake this prior high!
“Help Me to Name It”: Conclusion
The strength of earnings forecasts through the start of 2026 has encouraged market watchers that the U.S. economy and equity market can shake off geopolitical headlines and energy price shocks.
But the resilience of US equity markets and earnings has far less to do with economic resilience in the face of supply shocks and far more to do with an unprecedented, massive supercycle in the single largest industry group in the S&P 500, semiconductors.
The “myth” of the broadening out was not true 2022-2025 and looks to continue to be untrue in 2026, as earnings growth for the S&P 500 narrows even further to a small subset of highly cyclical names that are currently enjoying the upswing of a massive demand cycle.
For now this is providing a powerful “momentary bliss” for markets, but we must remain vigilant that as this semiconductor cycle ages, its outsized tailwind on earnings and returns could morph into an outsized headwind.
IMPORTANT DISCLOSURES
The views and opinions included in these materials belong to their author and do not necessarily reflect the views and opinions of NewEdge Capital Group, LLC.
This information is general in nature and has been prepared solely for informational and educational purposes and does not constitute an offer or a recommendation to buy or sell any particular security or to adopt any specific investment strategy.
NewEdge and its affiliates do not render advice on legal, tax and/or tax accounting matters. You should consult your personal tax and/or legal advisor to learn about any potential tax or other implications that may result from acting on a particular recommendation.
The trademarks and service marks contained herein are the property of their respective owners. Unless otherwise specifically indicated, all information with respect to any third party not affiliated with NewEdge has been provided by, and is the sole responsibility of, such third party and has not been independently verified by NewEdge, its affiliates or any other independent third party. No representation is given with respect to its accuracy or completeness, and such information and opinions may change without notice.
Investing involves risk, including possible loss of principal. Past performance is no guarantee of future results.
Any forward-looking statements or forecasts are based on assumptions and actual results are expected to vary from any such statements or forecasts. No assurance can be given that investment objectives or target returns will be achieved. Future returns may be higher or lower than the estimates presented herein.
An investment cannot be made directly in an index. Indices are unmanaged and have no fees or expenses. You can obtain information about many indices online at a variety of sources including: https://www.sec.gov/answers/indices.htm.
All data is subject to change without notice.
© 2026 NewEdge Capital Group, LLC
