


And I don’t know how I can do without
I just need you now
“Need You Now” – Lady A
Much like a weepy country song at a karaoke party, PMIs are souring the mood, calling into question the cyclical recovery in the U.S. and challenging the ever-higher growth narrative that is fueling markets. We think growth forecasts and markets should be singing “Need You Now”, pleading with PMIs to confirm the dominant resilient-growth narrative.
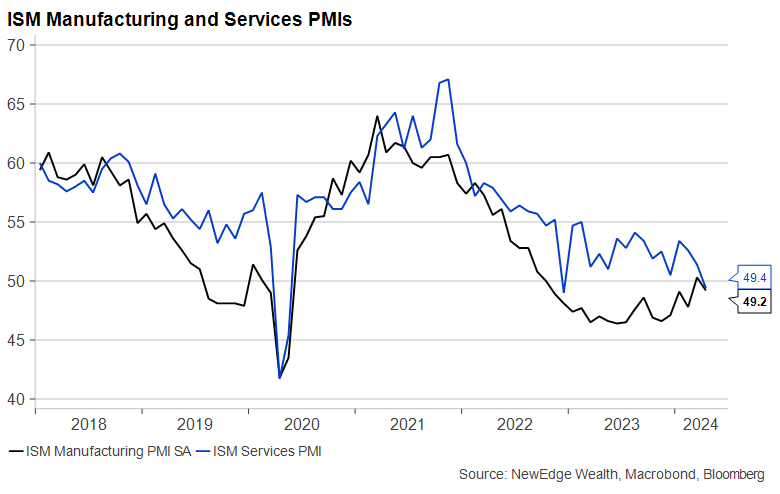
As we highlighted in Monday’s chart update, last week’s reports for the April Purchasing Managers Indices (PMIs) from the Institute of Supply Management (ISM) were disappointing. The Manufacturing gauge dipped back into contraction territory (a reading below 50 is contraction, and above 50 is expansion), while the Services gauge fell into contraction for the first time since 2022.
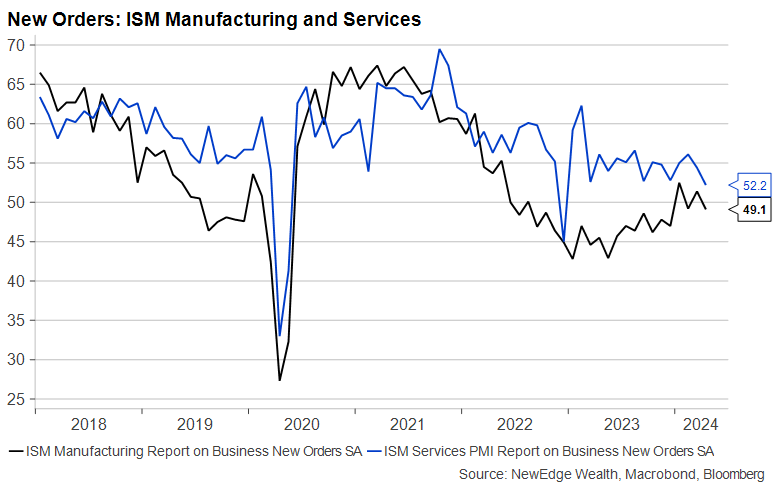
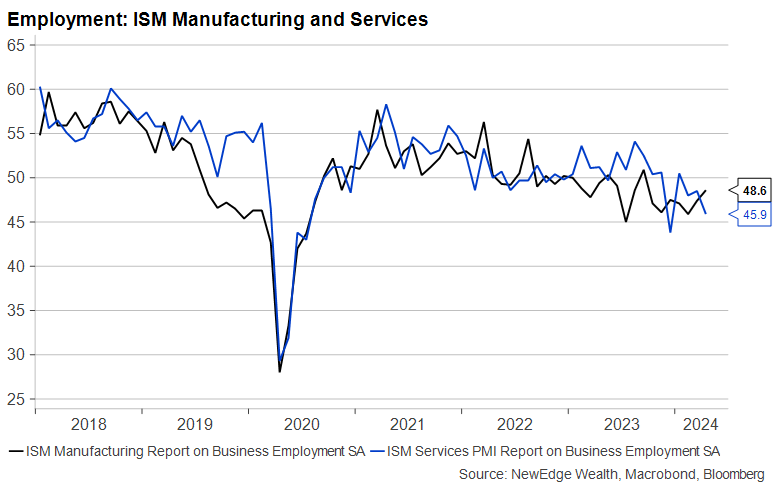
As the next three charts show, the underlying components were disappointing as well. Pro-growth areas like New Orders and Employment were notably weak (below 50 and/or falling versus the prior month), but pro-inflation areas like Prices Paid were notably “hot” (above 50 and accelerating versus the prior month). Certainly, this weaker growth and higher inflation data runs counter to the “golden path”, “immaculate disinflation” backdrop that has been celebrated by the Fed in the past year.

It is tempting to write off this data as a “blip” and not indicative of the broader trend for growth. The ISM Survey is, after all, a “soft data” measure that can be volatile and occasionally diverge from underlying economic activity (the author recalls the summer of 2015, when PMIs were falling but still technically in “expansion”, while leaders of industrial companies were categorizing the manufacturing economy as the worst they had seen in their careers!).
However, given the importance of ever-rising growth forecasts for equity and credit market performance, we think these PMIs should not be ignored and should be monitored for further deterioration, as this could be a challenge to the dominant resilient growth narrative that is fueling markets. A swift recovery in these PMIs would be an encouraging support for growth expectations, and, thus, risk assets.
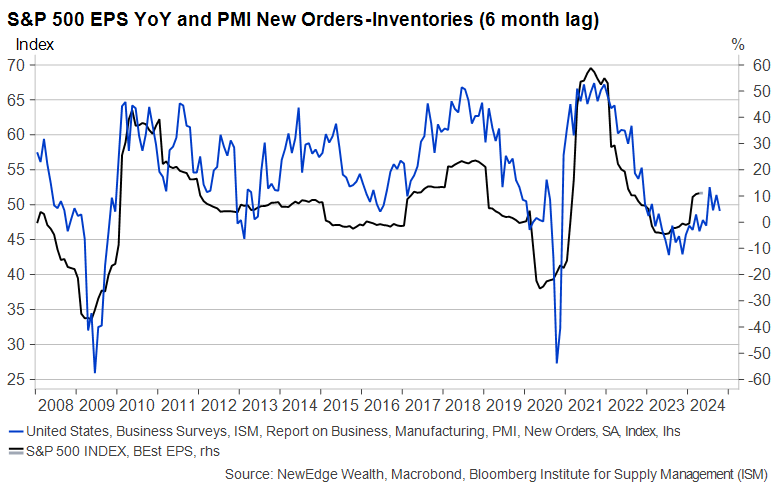
To illustrate the importance of PMIs, the chart below shows the relationship of S&P 500 earnings growth with the ISM Manufacturing PMI’s New Orders to Inventory spread. This New Orders to Inventories measure is considered a leading indicator, and has, of late, been signaling the recovery in S&P 500 earnings growth (from 0% in 2023 to +10% in 2024 forecasted). If this ratio continues to rise, it supports positive EPS growth for the S&P 500 in 2024, while if the ratio falls, it could be a warning sign that EPS estimate cuts are imminent. The chart below shows that is too early to call an end to the rebound in New Order minus Inventories, and thus too early to call for an EPS revision downcycle.
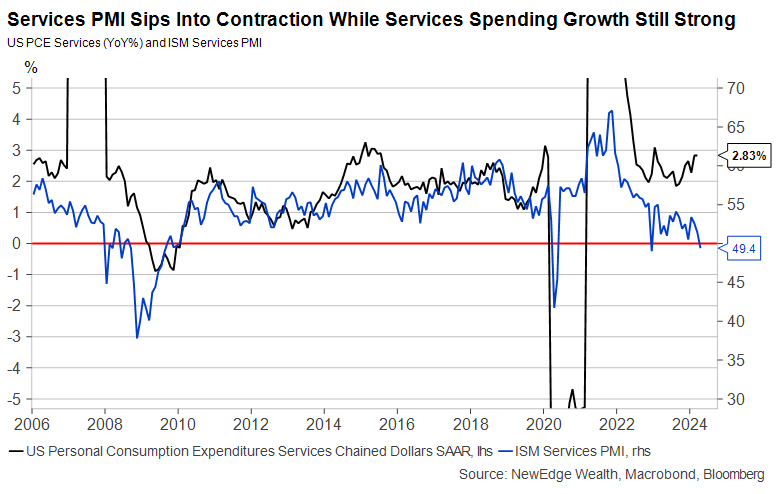
Another example of PMI importance is the relationship between the ISM Services PMI with Services Personal Consumption Expenditures. Here you can see that these measures typically move in similar directions: more spending on services tends to be associated with a strong Services PMI. This is not the case today: Services spending has been accelerating, while the Services PMI has been moderating and is now contracting. With Services spending being so important for GDP forecasts, a continued conflicting message from PMIs could challenge the strong growth expectations baked into GDP.
Looking at markets, PMIs have become mildly less important for stock market performance in recent years. PMIs still matter for overall returns, as a decelerating PMI can be associated with GDP forecast cuts, causing a risk-off sentiment in markets, while an accelerating PMI supports growth forecasts and risk appetite. However, on a sector leadership level, the relationship has faded.
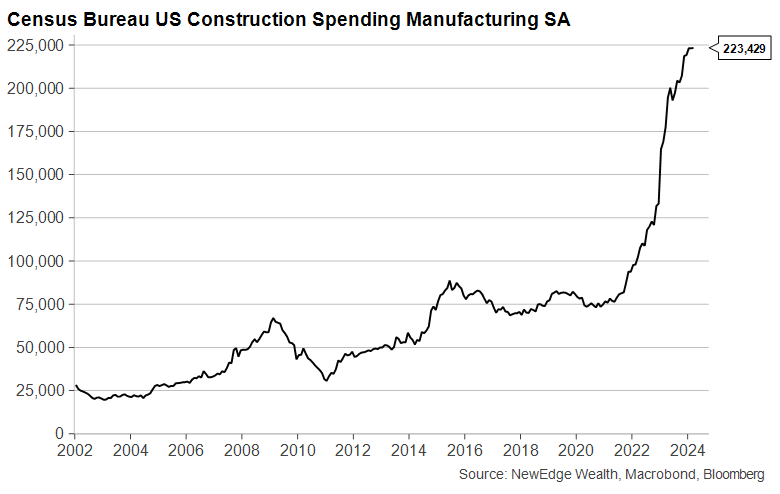
The chart below shows how the relationship between Industrial vs. S&P 500 and the Manufacturing PMI has broken down since the pandemic. This is likely a function of factors like the normalization of wild supply chain bull-whip effect swings and huge fiscal stimulus that has benefitted many of the companies in the sector, but not necessarily translated to higher PMIs (since the manufacturing PMI fell into contraction in late 2022, spending on manufacturing construction has surged 85%, an unprecedented divergence!).

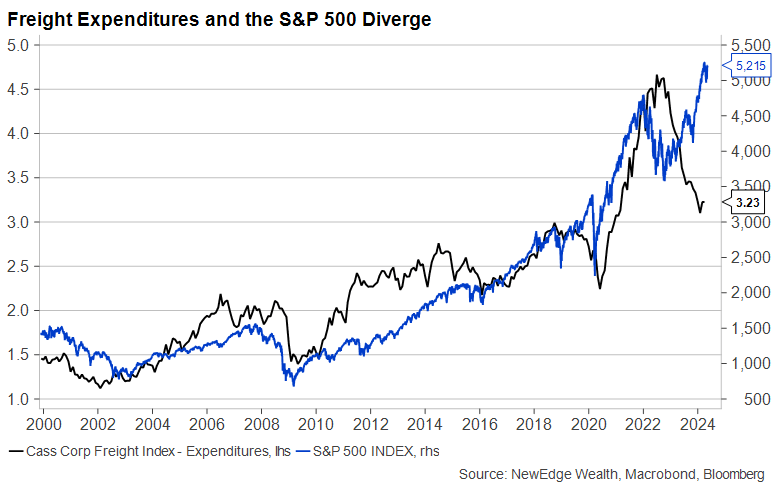
At the same time, the last two years have seen an unprecedented divergence in equity market performance and freight activity, which is closely tied to manufacturing activity. This is yet another example of The Strange Landing and the long-lasting distortions that the pandemic era is having on market performance and relationships.
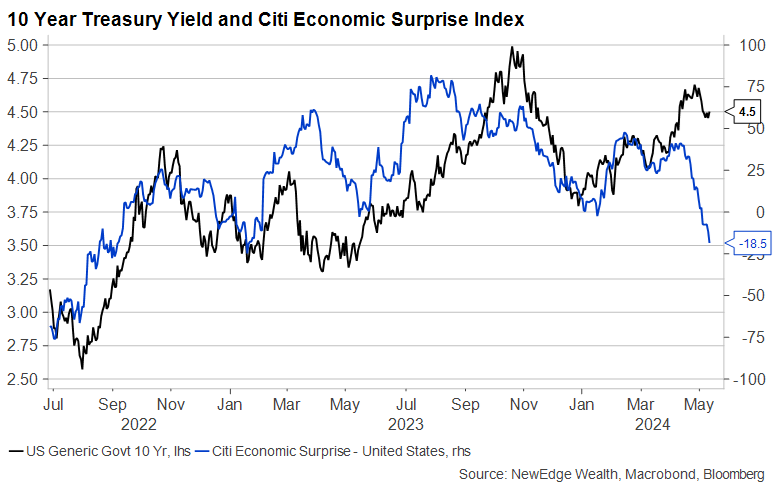
Lastly, this weaker PMI data has contributed to a broader weakening in economic surprises (a measure of how well economic data is coming in compared to expectations). This indicator has now fallen to its lowest level since 2022, which was a time categorized by growth forecasts revisions lower. This should be watched closely, as weaker economic surprises have recently been correlated with lower yields, as shown in the chart below.
Conclusion
All of this is to say that PMIs, for all their shortcomings and potential for head fakes, should not be ignored. A recovery in PMIs would be well received by risk assets, as it would support the strong growth narrative and expectations that are currently priced into markets. On the other hand, further deterioration in PMIs would challenge this strong-growth narrative and potentially spark estimate revisions lower, which would likely be a challenge for risk assets in the short term. So, it really does look like growth expectations and markets are singing “Need You Now” to PMIs.
The views and opinions included in these materials belong to their author and do not necessarily reflect the views and opinions of NewEdge Capital Group, LLC.
This information is general in nature and has been prepared solely for informational and educational purposes and does not constitute an offer or a recommendation to buy or sell any particular security or to adopt any specific investment strategy.
NewEdge and its affiliates do not render advice on legal, tax and/or tax accounting matters. You should consult your personal tax and/or legal advisor to learn about any potential tax or other implications that may result from acting on a particular recommendation.
The trademarks and service marks contained herein are the property of their respective owners. Unless otherwise specifically indicated, all information with respect to any third party not affiliated with NewEdge has been provided by, and is the sole responsibility of, such third party and has not been independently verified by NewEdge, its affiliates or any other independent third party. No representation is given with respect to its accuracy or completeness, and such information and opinions may change without notice.
Investing involves risk, including possible loss of principal. Past performance is no guarantee of future results.
Any forward-looking statements or forecasts are based on assumptions and actual results are expected to vary from any such statements or forecasts. No assurance can be given that investment objectives or target returns will be achieved. Future returns may be higher or lower than the estimates presented herein.
An investment cannot be made directly in an index. Indices are unmanaged and have no fees or expenses. You can obtain information about many indices online at a variety of sources including: https://www.sec.gov/answers/indices.htm.
All data is subject to change without notice.
© 2026 NewEdge Capital Group, LLC
