


Nature’s first green is gold,
Her hardest hue to hold.
Her early leaf’s a flower;
But only so an hour.
Then leaf subsides to leaf.
So Eden sank to grief,
So dawn goes down to day.
Nothing gold can stay.
Robert Frost, “Nothing Gold Can Stay”
Today’s Weekly Edge is a “Choose Your Own Adventure” for short-term and long-term perspectives!
For a short-term update on what we are seeing in Tech trading, market rotations, Fed expectations, and yields, click here for a short chart update.
For a long-term view, read below for a discussion on long-term return prospects for U.S. equity returns.
Nothing Gold Can Stay?
A recent article in The Economist argued that the “golden age for stock markets is coming to a close”, as the backdrop for interest rates, taxes, and valuations has become less supportive of equity returns compared to the last decade. The article acknowledges the promise of technological change with AI, but questions how quickly the adoption of this technology can impact the broad economy and market (the cover of the magazine also sparked a hilarious social media debate as to whether it was a bullish or bearish signal).
We agree with the logic and reasoning behind many of these points, but also note that there is some necessary nuance and practicality that must be added in making real-world investment decisions.
So, after the last decade of golden U.S. equity returns (+10% annualized for the past 10 years), will it be as Robert Frost pens that “nothing gold can stay”?
It Doesn’t Have to Be Gold to Be Good
The first and most important point in this analysis is: just because forward returns could be lower in the future does not mean investors should stay out of the equity market.
Instead, a period of lower price returns demands greater care by investors in order to reach return goals.
This greater care begins with controlling what you can, such as ensuring portfolios are tax efficient, avoiding unnecessary turnover/capital gains realization and opportunistically harvesting losses. One way to accomplish this is by focusing on quality equities that can be held for long-term periods, allowed to compound through cycles by not being inclined to excessive drawdowns during weak economic and market backdrops.
Investors should also assess their expectations about markets, being careful not to blindly extrapolate the last 15 years of stellar returns perpetually into the future. By stress testing Wealth Strategy projections with lower returns and ensuring right-sized allocations, investors can be prepared for a change in market potential, regardless of whether it materializes.
Relatedly, greater care in a lower return world can also come from security and style selection. Even in “lost decades” for equity index returns (such as the sideways markets of 1968-1982 and 2000-2012 for the S&P 500), there were many stellar investment opportunities for individual securities and equity styles that performed far better than the broad indices, while different time periods within these decades presented unique opportunities as well.
For example, take the 5 years following the bursting of the tech bubble in 2000: the Russell 1000 Growth Index was -47% while the Russell 1000 Value Index was +16%. The broad market struggled during this time period, however selectivity created substantial value.
Greater care also comes from potentially responding to extreme periods in markets, be they expensive/overbought or cheap/oversold conditions, keeping tax efficiency in mind.
These last two points speak to another critical concept when thinking about lower forward returns: the paths to lower forward returns can be varied. Markets can experience a bubble and then a crash, a crash and then a recovery, or a sideways chop, and all end up with similar 10-year annualized return statistics.
These various paths demand that investors keep an open mind about balancing short-term and long-term market drivers, recognizing that factors like valuations and positioning tend to have less impact on short-term returns. Markets can stay frothy/over-owned or cheap/under-owned for some time, which is why it is often said “they don’t ring a bell at the top/bottom” and why we often implore to “respect the trend and momentum in the short term but stay vigilant.”
Further, these varied paths demand that investors work to frame volatility as an opportunity to add to long-term positioning, despite the emotional wear and tear that volatile markets can have.
For example, an investor could have been perfectly spot-on about a future decade and a half of poor annualized returns for the NASDAQ from 2000-2014, but then missed generational buying opportunities in times like 2003 and 2009. Having a plan in advance and being mentally prepared to take advantage of volatility are necessary tools in both low and high return environments.
So, we encourage investors again: just because returns are lower it does not mean to be uninvested.
Starting Points Matter
The core observation in looking at long-term equity returns is acknowledging that starting points matter.
It is far easier and far more likely to have above average returns when equity valuations are cheap/below long-term averages and equities are under-owned.
It is far tougher to sustain above average returns when equity valuations are expensive/above long-term averages and equities are over-owned (we say sustain, because there have been short-term bursts of strong returns even when markets have been expensive and positioning has been crowded, though these periods are typically followed by softer returns; think 1998-2000 and its weak aftermath as an example).
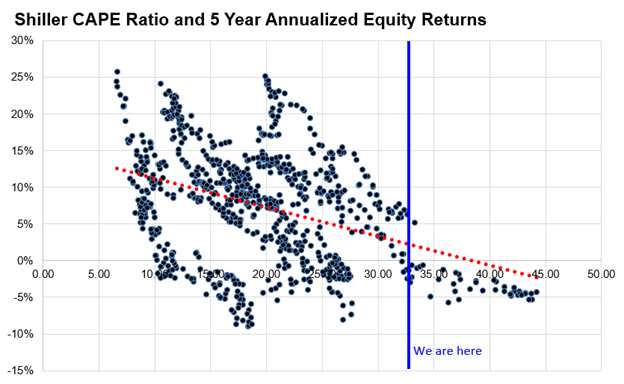
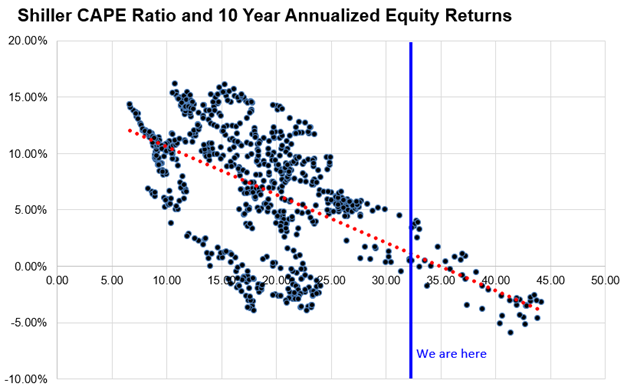
We can compare the year 2000 with its peak 43x PE Ratio (using the Shiller Cyclically Adjusted PE Ratio) and 75% AAII household allocation to equities, to 2009 with its 13x PE ratio and 40% allocation to equities. The 10 Year annualized return was -3% following 2000 and +14% following 2009. Starting points matter.
In the two charts below, we show the relationship between starting valuations and forward returns (5 and 10 years). You can see that we are currently in fairly rarified air at 34x on the CAPE ratio. There have been a handful of occurrences where returns have been roughly average from these valuation levels, as well as a handful of occurrences where returns have been well below average from these valuation levels. Notably, returns have never been well above average from this starting point (the historical average S&P 500 return is 7-10% depending on the starting date used for the S&P 500).
If stocks were to get much more expensive (above 35x forward), the historical precedent for strong 5-and 10-year index returns would evaporate. This would suggest a “be careful what you wish for” for near-term equity rallies that could push valuations further into extreme territory (but always remember, valuations are a poor short-term timing tool, so the prediction of lower 10-year forward returns could have little impact on near-term market action).
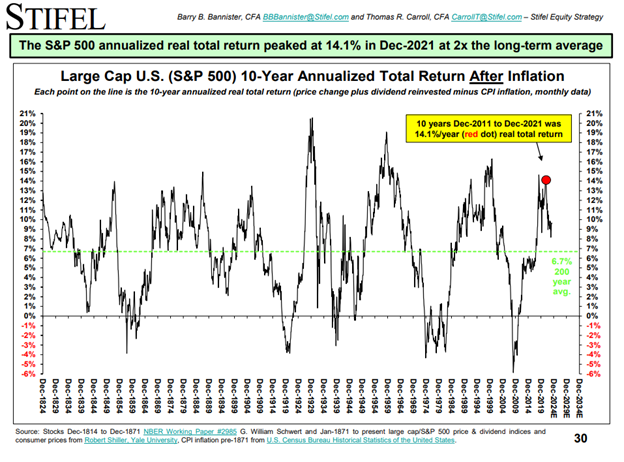
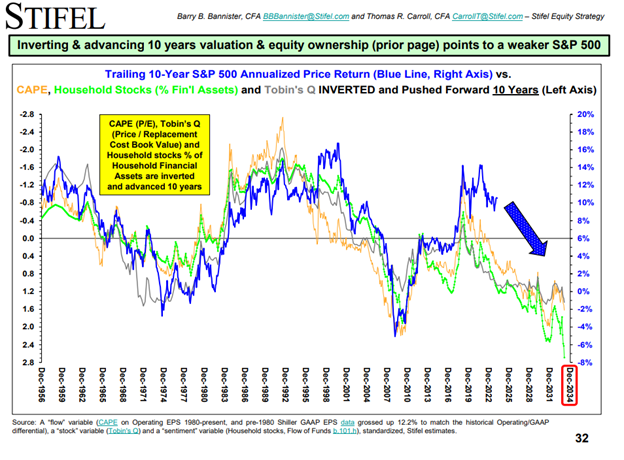
The great Barry Bannister from Stifel expands on this valuation and positioning framework to add his assessment of today’s environment. As the following two charts show, he tends to agree with The Economist’s conclusion, that after 10 years of strong returns (14.1% from 2011-2021), he expects forward returns for the S&P 500 to moderate meaningfully, given the starting point of high valuations and full allocations to equities.
Remember our assertions from above, though, that these are index level returns (so not all stocks and styles could have poor returns over the next decade) and do not necessarily capture the path that the market could take to get to overall lower annualized returns.
This last point is important in today’s market, where momentum, positioning chases, technology optimism, select earnings revisions, stimulus, and liquidity are all boosting equities, despite elevated index valuations, stretched sentiment, and positioning that is getting increasingly crowded.
It is highly uncertain what the timing or cause could be for an end to this recent run for markets, but one thing is for certain- we should not grow complacent, mostly as strategists and investor begin to throw in the towel on caution and embrace higher targets and allocations (there is always a “How I Learned to Stop Worrying and Love the Market” moment in every bull run).
Avoiding complacency means continuously watching data that captures positioning (equity flows, equity allocations, option data, etc.) and sentiment (surveys, credit spreads, performance of the riskiest parts of the market, volatility, etc.), and comparing these factors to underlying fundamentals. For now, strong markets have been accompanied by resilient fundamentals, but if positioning/sentiment and fundamentals diverge in a more meaningful way, equity markets could stall or experience a deeper correction.
Is There a Sea Change, or Do You See Change?
The most prominent counter argument to this long-term historical analysis suggesting lower forward returns is that historical statistics are less relevant in today’s economic and market environment.
If you recall, the “backdrop is different” argument was a common trope to support higher equity valuations during the 2010-2021 period when interest-rates were ultra-low. In fact, Robert Shiller himself, of the CAPE Ratio used above, argued in late 2020 that equity valuations were still attractive because bond yields were so low. Of course, using one arguably mispriced asset (policy suppressed bond yields) to judge the attractiveness of another asset did not turn out to be analytically sound, as interest rates shot higher in 2022 and both bonds and equities struggled.
Today’s higher interest rate environment has led some to argue that markets are in for a major sea change in long-term return profiles. Investors such as Howard Marks of Oaktree Capital have argued (and a follow up here) that an end to the prior 40 years’ persistent march lower in interest rates could shake up the attractiveness and potential of various asset classes.
But equity markets have seemed to care little about interest rates in the past year, with periods of higher interest rates still being accompanied by ever-higher equity valuations (even recently with rallies in low quality pockets of the markets where heavily indebted companies are particularly sensitive to interest rates). This isn’t to say that the interest rate environment will not matter for equities, but there have been more dominant drivers of earnings and sentiment of late.
Technology enthusiasm has enabled markets to look through this interest rate “sea change” and instead to “see change”, with hopes about an AI-related CapEx cycle and productivity boom. For now, the benefits of AI adoption have been narrowly enjoyed by a few major AI-infrastructure players (Nvidia’s EPS estimates for 2025 have increased by 4x in the past year), while the earnings lift from the appliers and users of AI has not yet come in to focus (Microsoft’s 2025 EPS estimates are up just +8% in the past year).
We think a balanced approach between the “sea change” of higher rates and the “see change” of new technology is warranted, as writing off either factor as inconsequential or irrational would be misleading.
Lastly, we must also acknowledge that that S&P 500 index composition has vastly changed over the last 30 years in the U.S., with much higher rates of profitability and cash generation, which do, on balance, typically warrant higher valuations. Mark Mauboussin has been on the forefront of these arguments, focusing in on the value of intangible assets as U.S. tech companies become more dominant in indices. We think these arguments for higher valuations should be balanced with considerations of concentration risk (with the late 1960s Nifty Fifty as a cautionary tale) and the potential for challenges to the future earnings power of tech monopolies.
Conclusion: Be an Alchemist
Overall, given the analysis above, we think it is a logical conclusion that the next 10 years of returns for equities could be lower than the prior 10 years, suggesting a less golden environment for equity investors. However, we do not think investors should conclude to become uninvested in equities because of lower forward returns. Instead, we think investors should think like alchemists, or create their own gold, taking even greater care in building portfolios and wealth strategies, focusing on tax efficiency, security/style selection, and opportunistic allocations.
Top Points of the Week
By Austin Capasso and Ben Lope
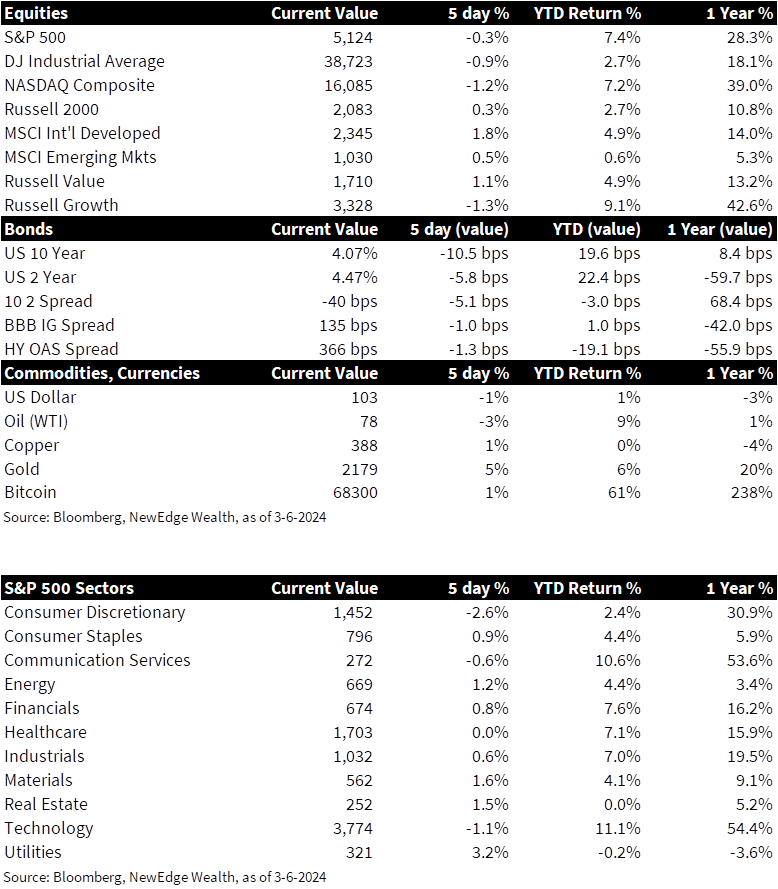
1. Equities – Global equities painted a mixed picture this week. Indices tracking US large and small cap were down slightly, while indices tracking international equities were positive.
2. Rates – The 2-10 year yield curve became slightly more inverted this week, as longer dated yields fell (down ~12bps) fell more than shorter dated yields (down ~7bps).
3. Rise in Gold – Gold rose to an all time high this week on the back of the fall in nominal rates. As inflation expectations have moved higher by a significant amount, the price of gold has also rose. The scare in the financials sector after the New York Community Bank fiasco also added to appetite for gold. Gold is currently up 5% year-to-date and we continue to monitor its movement relative to rates
4. A Somewhat Goldilocks Jobs Report – February’s jobs report came out higher than expected, showing an increase of 275,000 jobs against the expected forecast for 198,000. Although labor participation remained steady, unemployment ticked up slightly to 3.9% versus 3.7% expected. However, workers are still finding jobs as there are still 1.4 open jobs for every worker. Overall, the report further underscores a strong US economy that is not being thrown off course.
5. ECB Leaves Rates Unchanged – The European Central Bank (ECB) left its key interest rate unchanged at 4% as expected. Although the Eurozone’s economy continues to struggle, as things like the significant downturn in Germany’s factory orders continue, the ECB relayed they are in no rush to begin cutting interest rates. Markets have priced in the first interest rate cut from the ECB to be in June or July.
6. China Sets 2024 GDP Target – China have set their 2024 GDP target to around 5%, which economists think is quite ambitious as their housing market continues to struggle. In order to achieve this, China plans to issue ultra long special bonds for major projects and also remove any restrictions for foreign investment in manufacturing. The plan was light on the specifics and if there will be any additional support to their housing market.
7. Upcoming Earnings – Earnings season is coming to a close. The marquee earnings announcements next week come from Oracle, Dollar Tree and Adobe. Dollar Tree will be especially interesting to get a look into the US consumer, who has so far remained resilient.
8. The Week Ahead – Not only is it Fed week where we will hear from Jerome Powell, but we will also get important insight into economic data. Releases include the February Consumer Price Index (CPI), US Federal Budget, Producer Price Index (PPI), and additional data regarding imports and industrial production.
IMPORTANT DISCLOSURES
Abbreviations/Definitions: AI: artificial intelligence; CAPE ratio: cyclically adjusted price-to-earnings ratio, commonly known as CAPE, Shiller P/E, or P/E 10 ratio, is defined as price divided by the average of ten years of earnings (moving average), adjusted for inflation; CapEx: capital expenditures, money invested be a company to acquire or upgrade fixed, physical or nonconsumable assets; CPI: Consumer Price Index; ECB: European Central Bank; CPI: Consumer Price Index; ECB: European Central Bank; PE: price to earnings ratio, the ratio of share price of a stock to its EPS; Powell: Jerome Powell, Chair of the Board of Governors of the Federal Reserve System; PPI: Producer Price Index.
Index Information: All returns represent total return for stated period. S&P 500 is a total return index that reflects both changes in the prices of stocks in the S&P 500 Index as well as the reinvestment of the dividend income from its underlying stocks. Dow Jones Industrial Average (DJ Industrial Average) is a price-weighted average of 30 actively traded blue-chip stocks trading New York Stock Exchange and Nasdaq. The NASDAQ Composite Index measures all NASDAQ domestic and international based common type stocks listed on the Nasdaq Stock Market. Russell 2000 is an index that measures the performance of the small-cap segment of the U.S. equity universe. MSCI International Developed measures equity market performance of large, developed markets not including the U.S. MSCI Emerging Markets (MSCI Emerging Mkts) measures equity market performance of emerging markets. Russell 1000 Growth Index measures the performance of the large- cap growth segment of the US equity universe. It includes those Russell 1000 companies with relatively higher price-to-book ratios, higher I/B/E/S forecast medium term (2 year) growth and higher sales per share historical growth (5 years). The Russell 1000 Value Index measures the performance of the large cap value segment of the US equity universe. It includes those Russell 1000 companies with relatively lower price-to-book ratios, lower I/B/E/S forecast medium term (2 year) growth and lower sales per share historical growth (5 years). The BBB IG Spread is the Bloomberg Baa Corporate Index that measures the spread of BBB/Baa U.S. corporate bond yields over Treasuries. The HY OAS is the High Yield Option Adjusted Spread index measuring the spread of high yield bonds over Treasuries.
Sector Returns: Sectors are based on the GICS methodology. Returns are cumulative total return for stated period, including reinvestment of dividends.
The views and opinions included in these materials belong to their author and do not necessarily reflect the views and opinions of NewEdge Capital Group, LLC.
This information is general in nature and has been prepared solely for informational and educational purposes and does not constitute an offer or a recommendation to buy or sell any particular security or to adopt any specific investment strategy.
NewEdge and its affiliates do not render advice on legal, tax and/or tax accounting matters. You should consult your personal tax and/or legal advisor to learn about any potential tax or other implications that may result from acting on a particular recommendation.
The trademarks and service marks contained herein are the property of their respective owners. Unless otherwise specifically indicated, all information with respect to any third party not affiliated with NewEdge has been provided by, and is the sole responsibility of, such third party and has not been independently verified by NewEdge, its affiliates or any other independent third party. No representation is given with respect to its accuracy or completeness, and such information and opinions may change without notice.
Investing involves risk, including possible loss of principal. Past performance is no guarantee of future results.
Any forward-looking statements or forecasts are based on assumptions and actual results are expected to vary from any such statements or forecasts. No assurance can be given that investment objectives or target returns will be achieved. Future returns may be higher or lower than the estimates presented herein.
An investment cannot be made directly in an index. Indices are unmanaged and have no fees or expenses. You can obtain information about many indices online at a variety of sources including: https://www.sec.gov/answers/indices.htm.
All data is subject to change without notice.
© 2026 NewEdge Capital Group, LLC
