


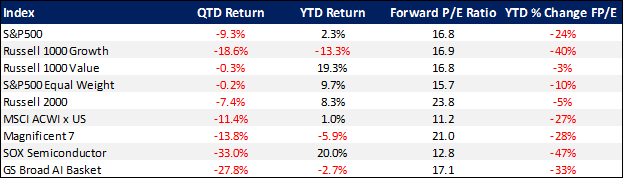
This week we are taking stock of recent market volatility by diving into an assortment of key topics, all of which have been influencing equity markets thus far in the fourth quarter. As we pass the halfway point of the quarter there is certainly no shortage of equity market subjects, as we have had another robust corporate earnings season, a surprising CEO exit, a record-setting IPO, and seen continued outperformance of value over growth companies, where in the large cap space, value has now reached the widest calendar year of outperformance relative to growth in history.
Source: Bloomberg, NewEdge Wealth as of 11/20/26
Given the rough start to the fourth quarter evident in global equity markets, most pronounced in AI-related segments, our theme for this Weekly Edge is “November Rain” alluding to the 1991 Guns N’ Roses epic that explores fragile relationships and the acceptance of finality.
While we agree with Axl Rose that “nothing lasts forever,” we do not believe we are witnessing the end of the current four-year bull market or the AI buildout, which has been the dominant driver of global markets and U.S. economic activity in recent years. Instead, in our view, the broad “November Rain” slump markets are exhibiting is the result of a confluence of factors, including tighter monetary policy and liquidity, the unwinding of crowded positioning and excess leverage, and the indigestion stemming from several surprising events over the past month, notably the midterm “blue wave,” Nvidia’s change in leadership, and the growing possibility that earnings estimates for future years may be too optimistic.
Ultimately, these factors are overshadowing what continues to be a solid corporate earnings and economic environment, creating a growing divergence between price and fundamentals, and while we can debate whether we are nearing an inflection point or fundamentals will eventually catch up with prices, this dynamic is another good reminder that patience, diversification, and steady hands are all valuable tools in periods of heightened uncertainty.
“When I Look Into Your Eyes” – Q3 Earnings Season Recap
Taking a step back from the tidal wave of macro headlines and events over the past few weeks, from a fundamental perspective we are once again on track for another quarter of robust corporate profit growth. With over 90% of companies reporting, the S&P 500 is on pace to deliver 32% YoY earnings growth for the quarter, our third straight quarter of more than 25% earnings growth. In aggregate 84% of companies are beating bottom line estimates and 74% of companies are beating top line estimates, both of which are above long-term averages.
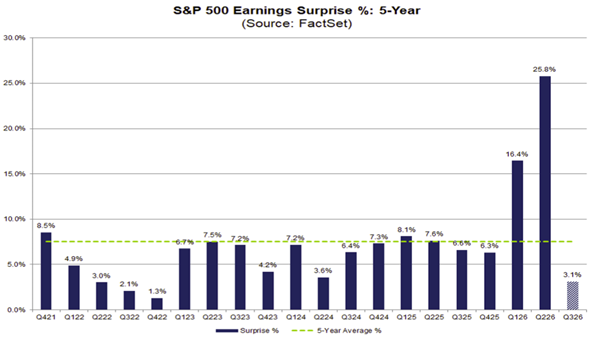
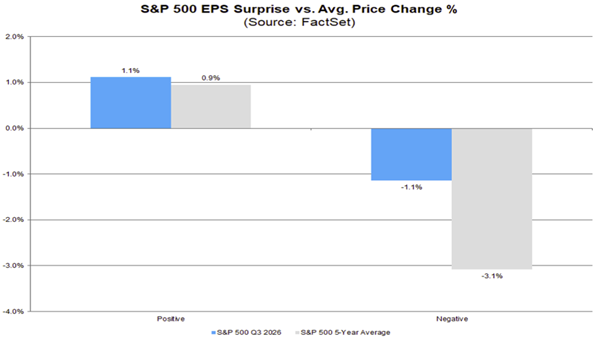
In addition to the near-record 15% net profit margins we are seeing this quarter, two interesting observations are the magnitude of earnings beats and the price reactions to earnings results. In aggregate companies are beating estimates by just 3% this quarter, well below the average beat rate of 8% over the past 5 years and the lowest since 2022. This could suggest that lofty estimates are getting tougher to exceed and may point to a more difficult operating environment ahead. This signal, combined with the relatively muted reactions we are seeing to earnings beats and misses, the latter of which is well below average, suggests investors recognize the high bar and that robust earnings growth is likely to begin to normalize in the coming quarters. As a result they are placing greater emphasis on guidance and the path forward for many companies, and the uncertainty around this path is certainly contributing towards the multiple compression we have seen lately.
Source: FactSet as of 11/13/26
Source: FactSet as of 11/13/26
“Nothing Lasts Forever” – Nvidia Under New Leadership
The most surprising event of the quarter and year has been the recent resignation of long-term Nvidia founder and CEO Jensen Huang, a result of several well-documented missteps. It is hard to overstate Jensen’s impact on the world of AI technology. Known as the central banker of AI, he is one of a handful of the most prominent faces and supporters of the AI infrastructure buildout, and a figure who has long inspired confidence in the long-term benefits of AI investment and technology. Clearly Nvidia’s shares have borne the brunt of this transition, as the pricing out of the “Jensen Premium” and pricing in of added regulatory scrutiny have erased 40% of the company’s market capitalization since the news broke; however, the impact on the broader AI ecosystem, given Nvidia’s central role in financing, has also been substantial.
This downturn in a company that was already inexpensive by traditional metrics leaves Nvidia trading at just 9x calendar year 2027 earnings, roughly a 45% discount to the valuation of the average S&P 500 company. While the situation remains fluid and there are potentially more headlines that could weigh on performance, a comparison could be drawn to Apple following the departure of Steve Jobs in 2011. At that time Apple was trading at 10x earnings, dealing with heightened uncertainty around succession, competition, and peak cycle fears. Obviously these are unique businesses and this isn’t to suggest Nvidia is about to return 3,000% as Apple has done since 2011, but it is a good reminder that strong companies can adapt and near-term narratives aren’t always accurate. Ultimately though, it will take time for investors to digest an Nvidia and AI landscape without one of its most prominent supporters, adding uncertainty to an already jittery AI ecosystem for the foreseeable future.
Source: Company filings, NewEdge Wealth as of 11/17/26
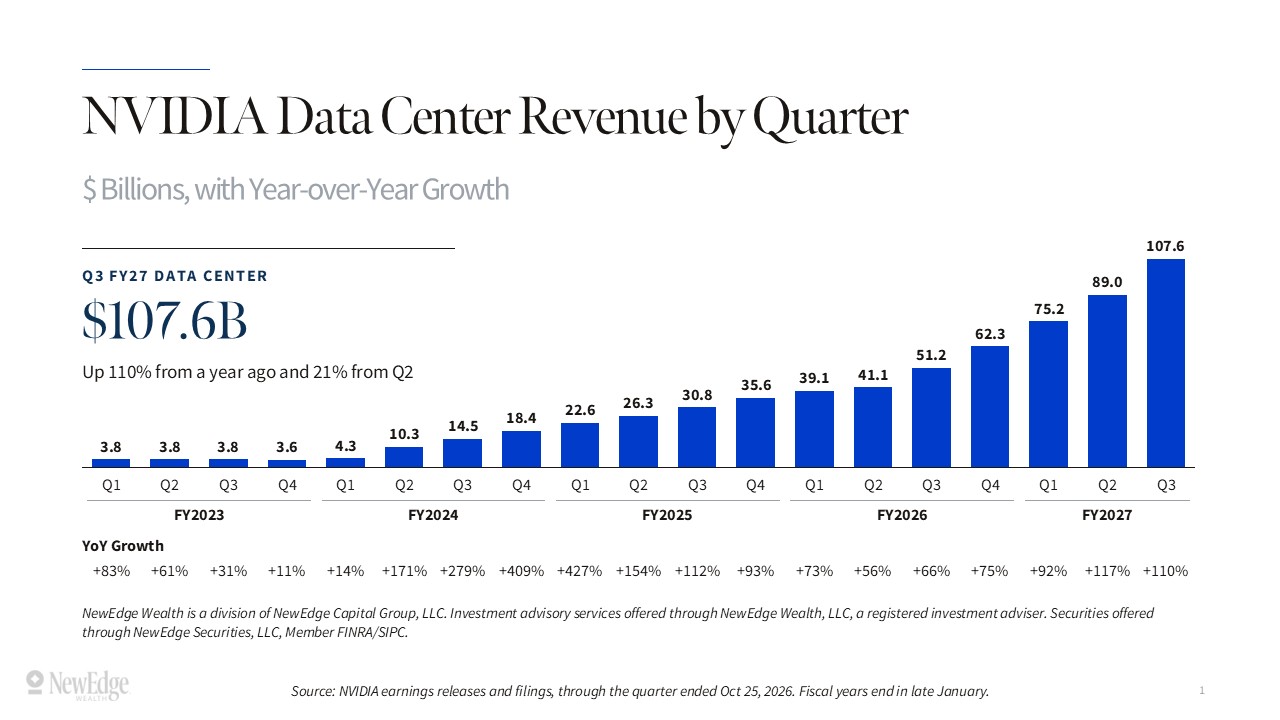
Right on the heels of the resignation announcement were the Nvidia quarterly earnings, which suggested that the show goes on at the company, at least in the near term. Nvidia once again delivered a stellar set of results, beating top and bottom line expectations, and raised 2027 revenue guidance to 75% YoY growth, fueled by the continued robust demand for the world’s most advanced AI chips. Despite the solid fundamental results, and a reassuring tone provided by Nvidia’s new management team, shares continued their slide throughout the week, as concerns around the ability to deliver this growth in an increasingly challenging environment (evident by credit stress, potentially stronger export controls, and a less supportive political environment) weighed on Nvidia and the majority of AI-related equities. In our view this illustrates how news flow and sentiment are likely to continue to be the dominant driver of Nvidia shares and many AI plays in the near term, and while we believe the long-term risk/reward in Nvidia is attractive today, overall we continue to wait for further clarity and are monitoring the situation closely.
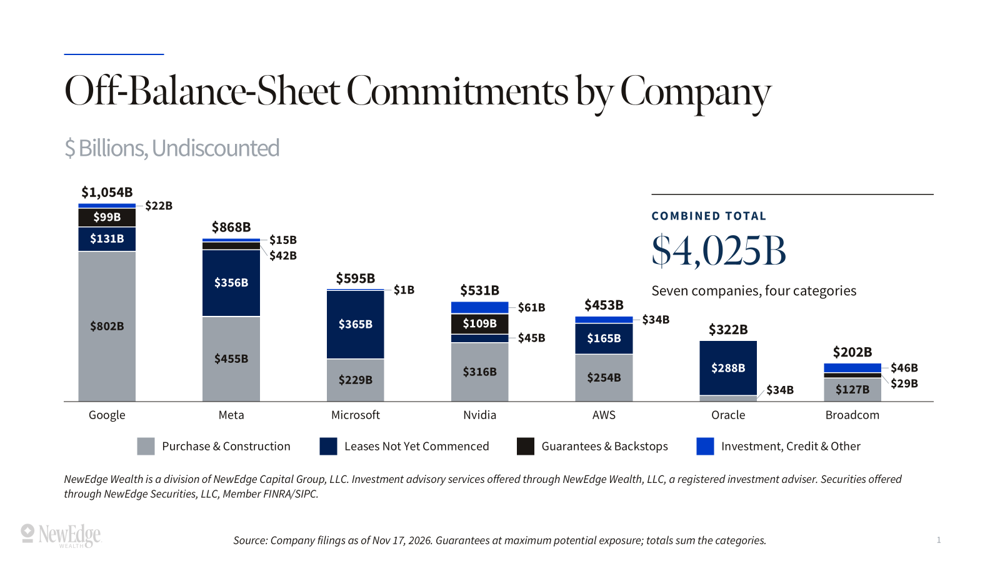
One of the more interesting topics from the Nvidia earnings call was the transparency provided into financing arrangements. Circular financing and off-balance-sheet liabilities have been one of many growing concerns with the AI infrastructure build out in recent quarters, and while Nvidia is considered the face of these arrangements, we find that in aggregate the financing and backstops they have detailed are actually smaller than other large technology peers. New Nvidia CEO Colette Kress noted that purchase guarantees (where Nvidia is the largest guarantor in the market and has agreements to buy any unsold capacity from customers) only take effect once a powered data center shell has been delivered, shifting the construction risk and some liability back to their customers. While this is reassuring, and likely means circular financing concerns may be more bark than bite for the largest companies as long as growth and profitability remain robust, it does raise questions about the marginal demand for Nvidia chips in the future if these weaker customers are unable to deliver compute capacity.
Source: Bloomberg as of 11/18/26
“Love is Always Coming, Love is Always Going” – The Record-Setting Anthropic IPO
This week investors also welcomed another AI company to the public markets with the record-setting debut of frontier AI company Anthropic. While the $107B raise and $1.5T initial valuation are eye-popping (making the 5-year-old company one of the 10 largest public companies in the world), investors initially cheered the new listing. Anthropic shares immediately jumped 40% from their $83 list price, yet this enthusiasm quickly faded and by midday Friday shares were up less than 10% from the list price. While institutional and retail investors are clearly evaluating their love for the company in the near term, in our view this was a successful debut and structurally supportive for the AI infrastructure ecosystem, given Anthropic is one of the largest consumers of computing infrastructure with over $900B of future compute commitments.
In addition, the ability to execute this massive offering and the healthy demand for shares suggest investor appetite for AI leaders may not be as weak as recent public market performance suggests. We would note, however, that historically the largest IPOs do endure some digestion and price discovery in the days and months following an initial launch. In aggregate the 20 largest IPOs in history have seen a median peak-to-trough decline of over 30% in the subsequent 3-6 months, most recently seen following the June IPO of SpaceX which declined 40% from its IPO day high over the following month.
“Sometimes I Need Some Time on My Own” – The Surprising Performance Deviation Between Value and Growth Companies in 2026
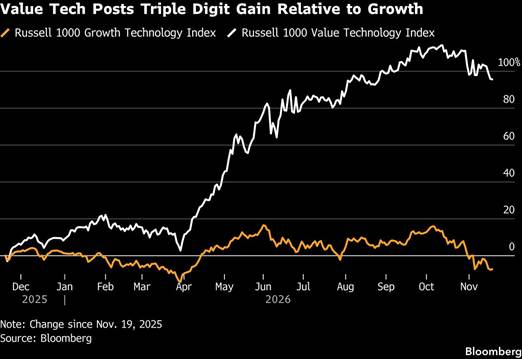
One of the more remarkable trends in equity markets this year has been the sustained outperformance of value companies over their growth counterparts. With the Russell 1000 Value Index +19%, and the Russell 1000 Growth Index -13% YTD, the resulting spread is the widest we have seen it on a calendar year basis since 2000. In fact, if this spread were to hold through year end, it would place value’s outperformance over growth in the 98th percentile of rolling 12-month periods since the indices were created in 1978.
This performance spread is fascinating considering both the Russell 1000 Growth Index and Russell 1000 Value Index have each delivered a little over 20% growth in operating income over the past year (operating income removes the effects of one-time items and investment revaluations which have distorted EPS growth for some of the largest index weights). In addition, over the past year we have seen positive revisions heavily favor the growth segment, with 2027 estimates rising by 60% for the Russell 1000 Growth Index vs just 9% for the Russell 1000 Value Index. Lastly, the biggest surprise within the value universe has been the outperformance of the technology sector, which has outperformed its growth counterpart by nearly 100% this year. Technology companies in the value index comprise 15% of the index weight, yet they account for more than half the index return this year, the result of a surge in performance of many highly cyclical hardware companies, many of which are benefitting from strong demand for data center components and limited supply.
Russell 1000 Value & Growth Index – Technology Sector YTD Performance
Source: Bloomberg as of 11/18/26
While the recent rotation into defensive sectors, the derating in many high-flying growth companies, and the surge in cyclical technology companies, explains some of this performance spread, a significant amount can be attributed to the second quarter Russell Index reconstitution. At the end of June, seven of the Russell 1000 Value Index’s best performers (a group that accounted for 40% of the index’s 16% H1 return) migrated to the Russell 1000 Growth Index. Since that date, those same seven companies (all semiconductors or AI plays) have detracted 30% from the Russell 1000 Growth Index’s -17% H2 return. All in a remarkable swap for a passive index but a good reminder that headline performance often doesn’t tell the complete story.
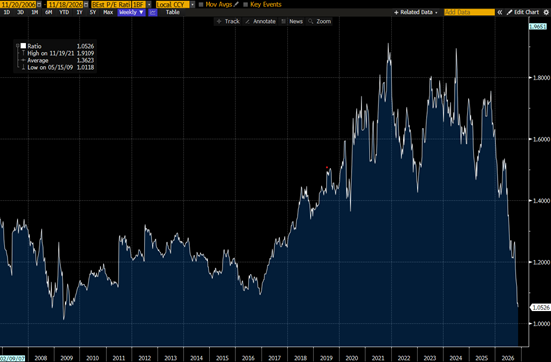
Lastly, the performance spread between value and growth has created an interesting setup from a valuation standpoint. Today the Russell 1000 Growth Index trades at a forward P/E that is nearly on par with the forward P/E for the Russell 1000 Value Index. This is the cheapest growth has been relative to value since 2009, and it is a substantial discount to the 37% average valuation premium growth has commanded over value during this period.
Forward Price/Earnings Ratio: Russell 1000 Growth to Russell 1000 Value
Source: Bloomberg, NewEdge Wealth as of 11/18/26
“So Never Mind the Darkness, We Can Still Find a Way” – Closing Thoughts
While the fourth quarter has felt darker than usual for equity investors (as Q4 has historically been the best performance quarter of the year), we believe the heightened (mostly headline-driven) volatility over the past few months is creating some interesting opportunities for long-term investors. At the end of the day, fundamentals and earnings growth are the long-term drivers of equity market performance, markets are known to climb walls of worry as uncertainty eases, and while we don’t know when the inflection point for equity markets will come, we remain broadly constructive and continue to take a long-term view, grounded in the solid fundamental backdrop.
Things can certainly get darker, but we would close by reiterating that the economic and earnings trajectory remains sound today, valuations in many areas that have borne the brunt of selling pressure are discounting a wide range of concerns, and lastly periods of heightened uncertainty, light positioning, and weak sentiment (as we are seeing today) have historically created attractive entry points for long-term investors, ultimately a combination that can reward patient investors until headlines are digested and fundamental drivers can take a more prominent role.
IMPORTANT DISCLOSURES
The views and opinions included in these materials belong to their author and do not necessarily reflect the views and opinions of NewEdge Capital Group, LLC.
This information is general in nature and has been prepared solely for informational and educational purposes and does not constitute an offer or a recommendation to buy or sell any particular security or to adopt any specific investment strategy.
NewEdge and its affiliates do not render advice on legal, tax and/or tax accounting matters. You should consult your personal tax and/or legal advisor to learn about any potential tax or other implications that may result from acting on a particular recommendation.
The trademarks and service marks contained herein are the property of their respective owners. Unless otherwise specifically indicated, all information with respect to any third party not affiliated with NewEdge has been provided by, and is the sole responsibility of, such third party and has not been independently verified by NewEdge, its affiliates or any other independent third party. No representation is given with respect to its accuracy or completeness, and such information and opinions may change without notice.
Investing involves risk, including possible loss of principal. Past performance is no guarantee of future results.
Any forward-looking statements or forecasts are based on assumptions and actual results are expected to vary from any such statements or forecasts. No assurance can be given that investment objectives or target returns will be achieved. Future returns may be higher or lower than the estimates presented herein.
An investment cannot be made directly in an index. Indices are unmanaged and have no fees or expenses. You can obtain information about many indices online at a variety of sources including: https://www.sec.gov/answers/indices.htm.
All data is subject to change without notice.
© 2026 NewEdge Capital Group, LLC
