


I got my hands up, they’re playin’ my song
They know I’m gonna be okay
Yeah, it’s a party in the U.S.A.
“Party in the U.S.A.” – Miley Cyrus
All data is as of June 30, 2023 unless otherwise stated.
Another week, another string of better than expected data in the U.S., suggesting that forecasts for economic growth in the second half of 2023 remain far too low. It’s a growth party in the U.S.A.
1Q23 GDP was revised higher to +2.0% (vs. +1.4% prior), led by consumer spending showing the strongest growth since 2Q21. New home sales surged 12% and home prices rose +0.9% on a month-over-month basis, despite mortgage rates climbing to 7.2% for a 30-year fixed. Consumer confidence (Conference Board) jumped to the highest level since 2021. Business investment, measured by durables goods and capital goods orders, trounced expectations.
Friday’s inflation further stoked a Goldilocks mood, with May’s PCE (Personal Consumption Expenditures) inflation data showing moderation in line with expectations (Core PCE MoM +0.3% vs. +0.4% prior).
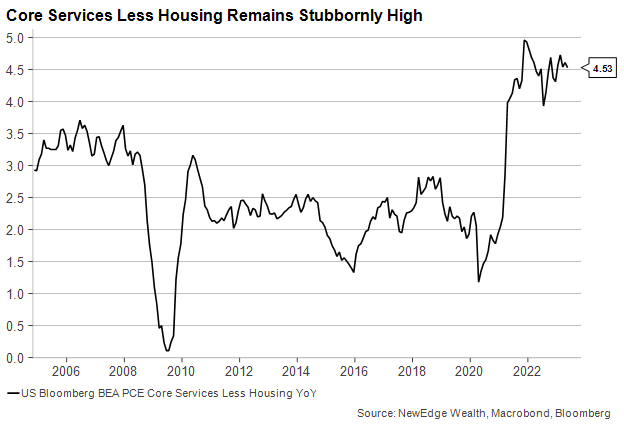
There are certainly items to watch and monitor amidst this rosy data: May Personal Spending in Friday’s report slowed more than expected (+0.1% vs. +0.2% consensus and +0.6% prior), while the Fed’s closely watched Core Services Ex Housing did not moderate, remaining stubbornly high all year.
Even with these watch items, data coming in better than expected suggests that current estimates for U.S. real GDP growth in 2H23 remain too low (3Q23E 0.0%, 4Q23E -0.5%). Effectively, economic forecasters have a mild recession beginning in the 3Q23, which is not supported by the current trajectory of data. The Fed’s forecast of 2023 GDP growth also remains too low, even after revising it higher in June from +0.4% to +1.0%. Given 1Q23’s +2% growth rate, and 2Q23 tracking at +1.8% based on GDPNow, the Fed’s forecast implies a sharp slowdown in 2H23 which is not reflective of the current trends in growth.
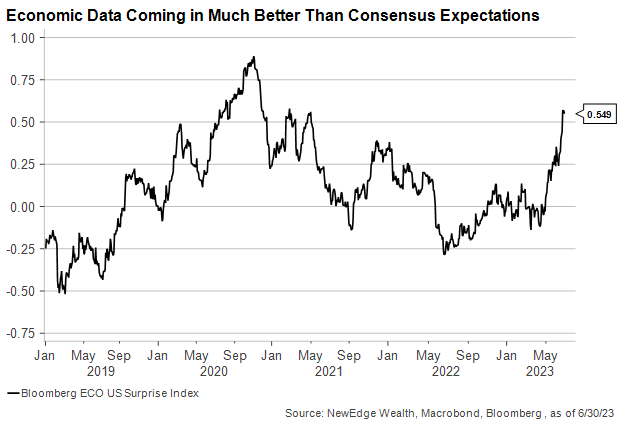
Overall, this better data has led to a surge in economic surprises (a reading above 0 in an economic surprise index indicates data coming in better than expected).
How should equity investors interpret this string of better data, mostly in a world where we seem to flip back and forth from “good news is bad news” (better data means more Fed hikes and slower growth to come) to “good news is good news” (better data simply means better growth)?
Earnings Impact
First, better data and higher economic surprises have typically led to earnings being revised higher.
Interestingly, throughout the second quarter of 2023, with its more resilient data and surging optimism related to tech, broad S&P 500 earnings estimates have been fairly stagnant all quarter and even revised slightly lower (based on Bloomberg Intelligence consensus). The current forecast for 2023 earnings growth is -2.7% vs. -2.3% to start 2Q23. Further, even after a strong 1Q23 earnings season that surprised meaningfully to the upside, 2Q23 estimates have continued to be revised lower (-8.2% expected at the start of 2Q23 vs. -8.7% expected today).
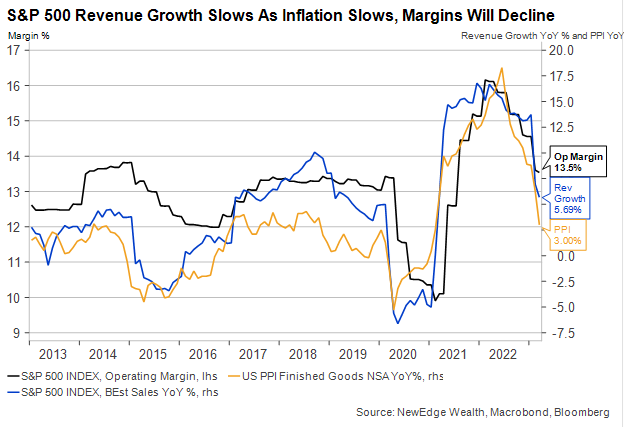
We see upside to 2Q23 EPS forecasts, mostly on the revenue line. Analysts have revenues dropping -0.5% in 2Q23, which could be far too low in a world where nominal GDP for the quarter is likely running +4-6% (remember revenues are a nominal number and benefit from higher inflation/prices). This would also be a marked slowdown from 1Q23’s +4.5%.
We still expect margins to be a challenge in 2Q23 simply because of the slowdown in revenue growth as inflation moderates. 2022’s record margins were made possible by powerful, inflation fueled revenue growth (2Q22’s revenues grew +14%!), which as top line slows, it is likely margins will continue to normalize.
Notably, equity analysts have not been as sour on their outlooks as economic forecasters, with a rebound in earnings already reflected for 2H23 (+6% growth expected for 4Q23), 2024 (+10%), and 2025 (+10%). This means that the recession economists were predicting is not reflected in current EPS estimates.
We do see upside to 2023 and 2024 numbers, but note that the margin dynamic detailed above suggests that growth forecasts that require a return to 2022’s record margin levels are likely too aggressive as we are unlikely to see the pace of revenue growth that made those record margins possible.
All in, better growth is supportive of earnings being revised higher, but given the rebound in earnings already reflected in forecasts, we expect just moderate upside to these earnings forecasts.
Valuation Impact
The second portion of the impact of better growth on equities is how resilient data, with persistent core inflation, leads to higher-for-longer Fed policy, upward pressure on interest rates, and thus some concern, or at least awareness, that current equity valuations are stretched versus history and the level of rates.
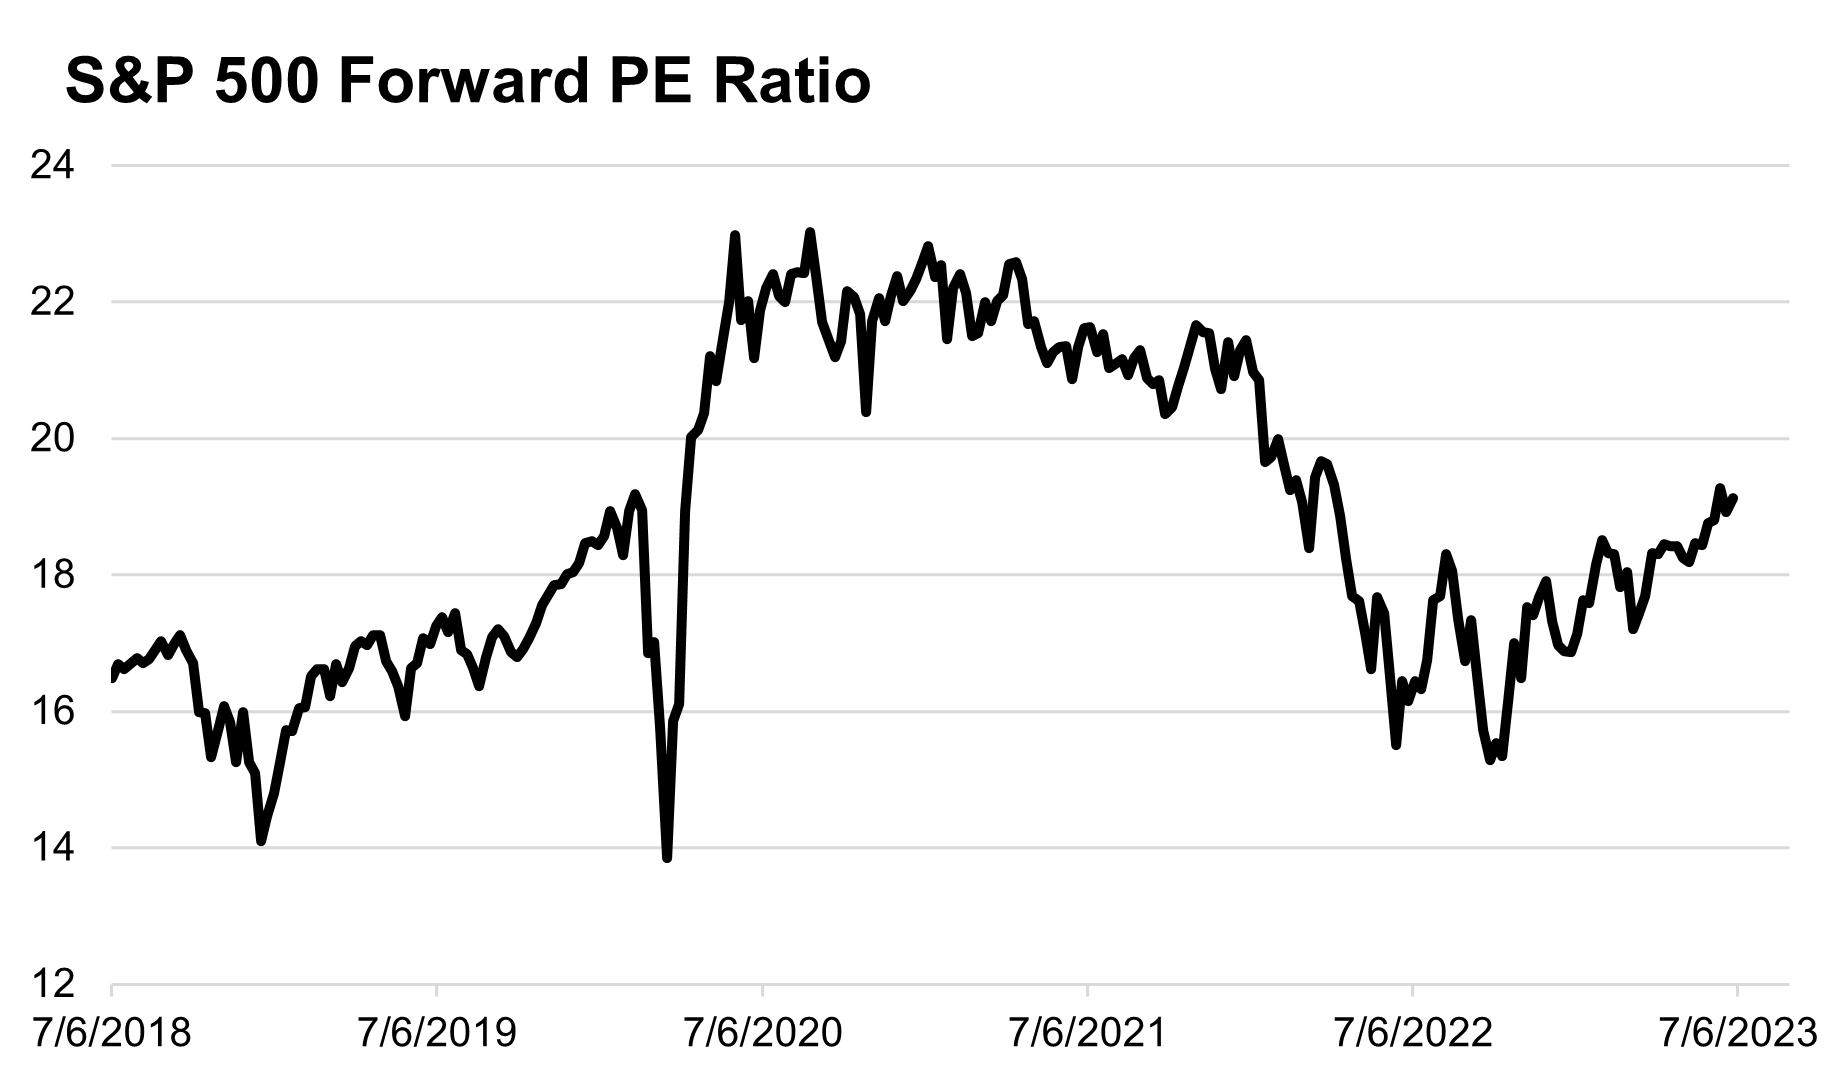
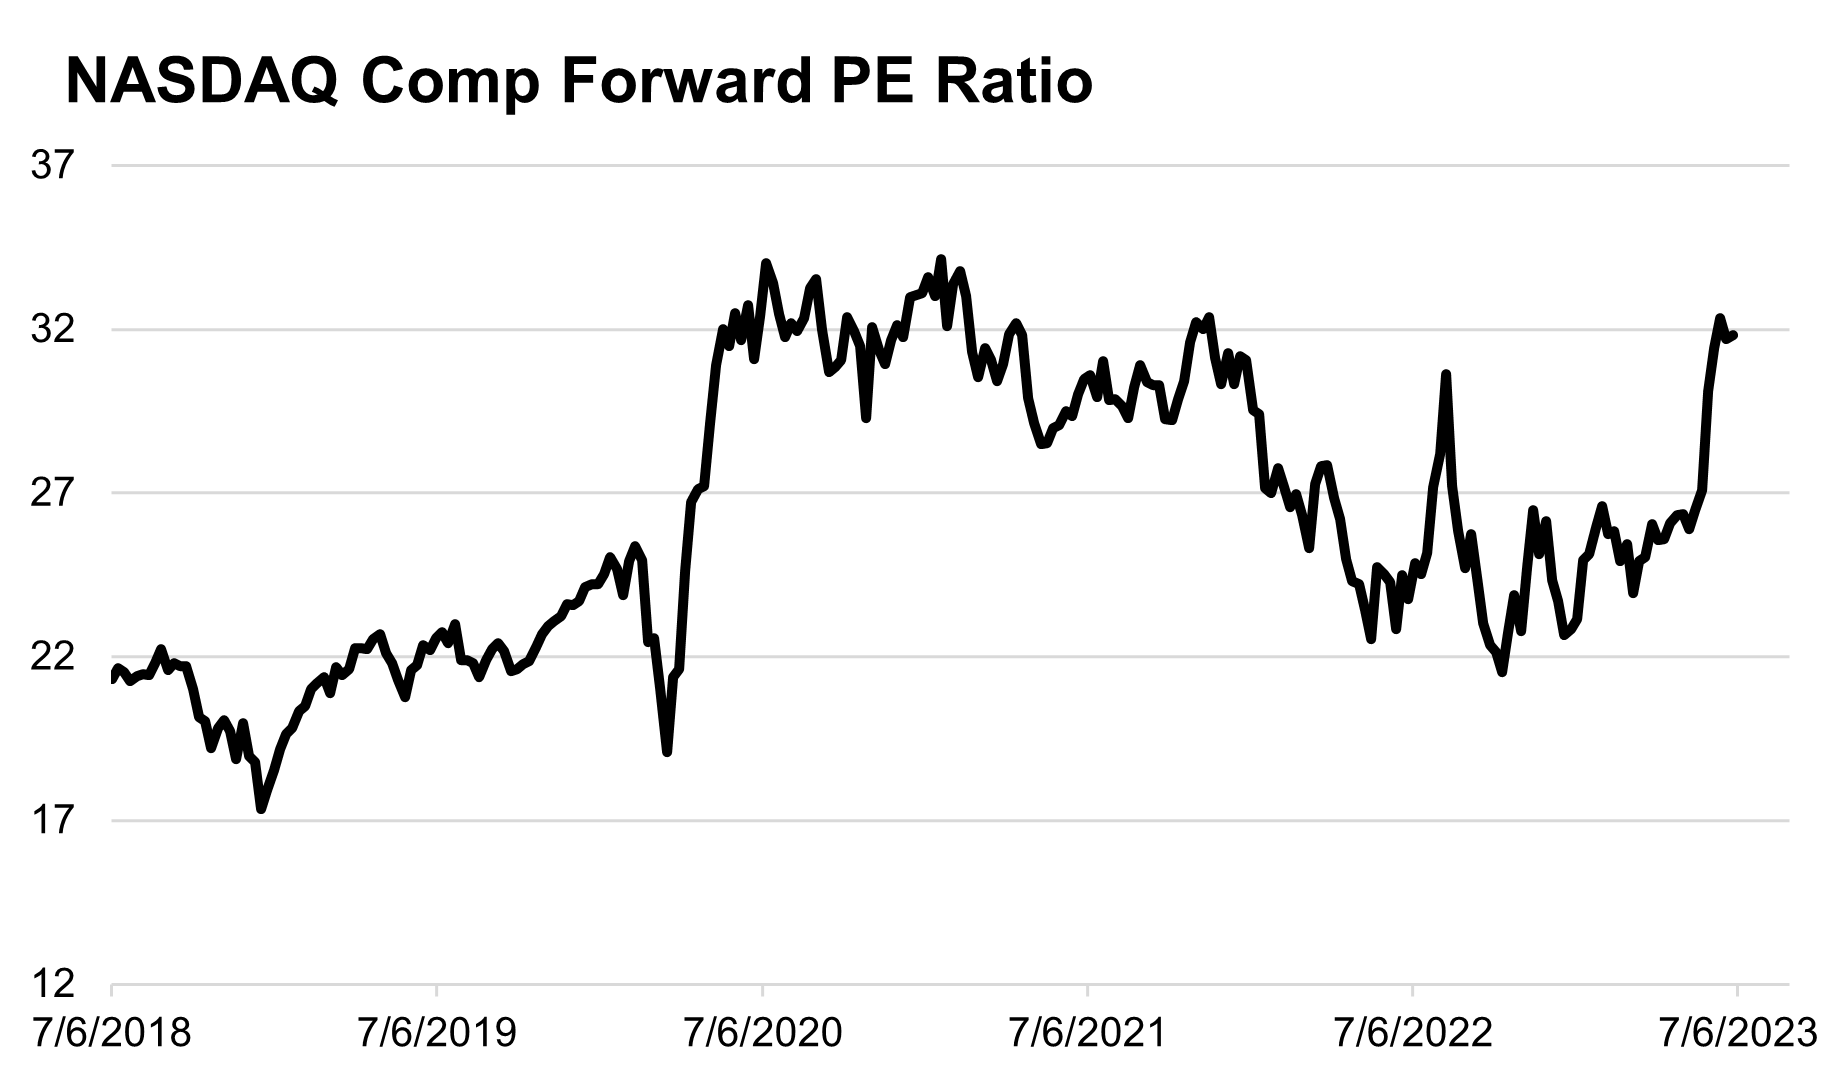
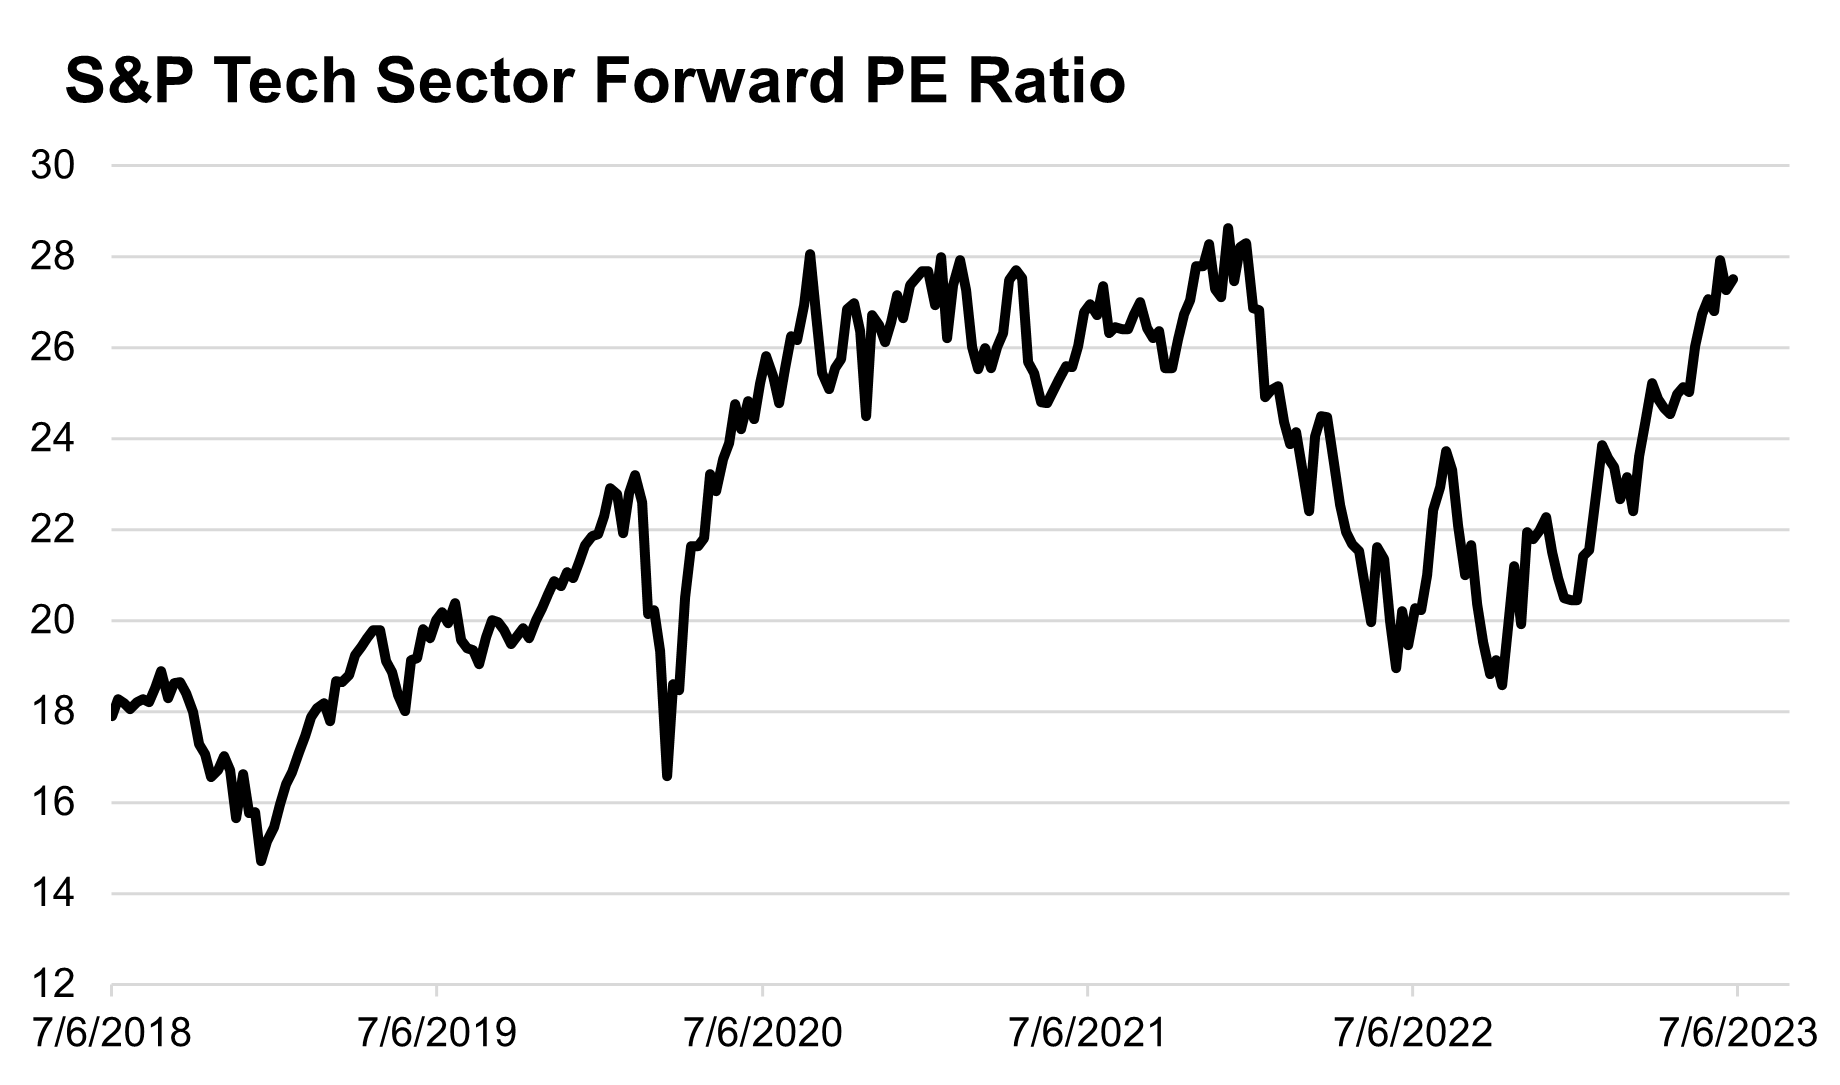
As shown in the charts below, today’s S&P 500 forward PE multiple is back to its pre-pandemic high of 19.5x (reached in early 2020 when growth was turning higher and the Fed was easing policy). The NASDAQ is nearing its pandemic era highs, while the S&P 500 Technology sector is already back to its 2021 high (when the Fed was aggressively easing policy and real interest rates were deeply negative). These elevated valuations certainly reflect optimism that we are about to enter some “paradigm shift” in earnings, but we cannot ignore how much potential good news could already be captured in these sky-high valuations.
In last week’s update, we unpacked why we have seen such a big divergence between valuations and interest rates/Fed policy. Today, we add one more consideration with the observation that investors may not care about the level of rates today (whether it’s one or two more hikes), as long as they can count on easier policy in 2024. In fact, the Fed itself has interest rate cuts forecasted for 2024, with 100 bps of cuts reflected in the median Dot Plot forecast for a 4.6% policy rate next year.
We are of the view that due to continued high inflation and the concern that inflation could return, the Fed will need a “good reason” to begin cutting policy (much weaker growth or some kind of financial system distress that is even bigger than the recent bank failures). This means that high valuations expecting interest rate cuts in the next 12 months are incongruous with earnings forecasts that expect a strong reacceleration in growth.
Overall on valuations, we continue to emphasize that valuation is a poor short term timing tool, but is a helpful predictor of forward returns in the medium term. Today’s stretched valuations, mainly for growth and Technology shares, do not have to spell impending doom for the powerful rally, but they suggest that as we look out 1-3 years, we may need to moderate our return expectations.
Conclusion
Strong data and moderating inflation certainly have markets partying as we head into the holiday weekend. We see potential for upward revisions to earnings in the near term, as growth is stronger than expected, but note the recovery in earnings that is already reflected in current forecasts. We are wary of overly stretched valuations as longer term investors, mostly in the context of a Fed that is likely going to need to keep policy tighter-for-longer given these strong growth trends. These two factors, higher earnings and lower valuations, could cancel each other out in the second half of the year, leading to lower total returns for equities than what was experienced in this blockbuster first half.
Top Points of the Week
By Ben Lope
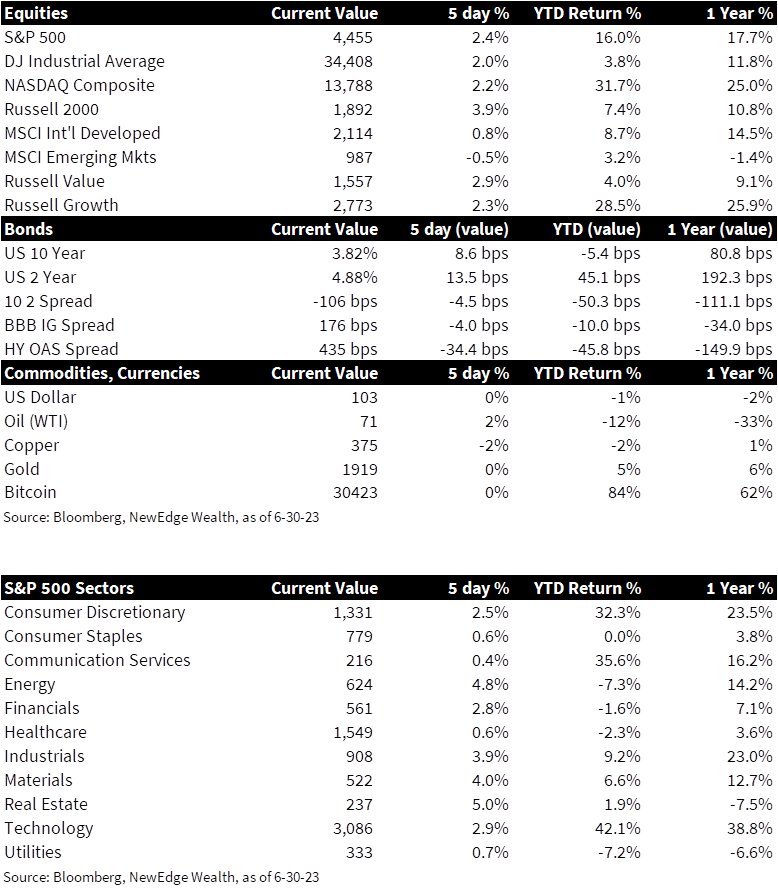
1. Global equities recap – After taking a week off, US equities continued their march higher, led by small cap names tracked by the Russell 2000. US equities ended the week on a high note after a goldilocks PCE report showed personal income figures notching higher than expected gains as inflation moderated more than expected. International equities painted a more muddled picture, with developed markets notching modest gains as emerging markets declined slightly.
2. Yield curve inversion continues, approaching the March lows – The market has been repricing expectations back in line with the Fed’s forecast. On the week, the 2-year Treasury yield rose 11 basis points as the market factored in the possibility of an additional hike beyond July. The 5-year yield, however, went up by more, reflecting a change in views about economic growth. The 10-year yield reached a 3.88% high, nearly erasing the fall in rates seen during the March banking crisis. As a result, the yield curve inverted to -1.05%, the deepest since June of 1981.
3. Oil solidifies quarterly decline – Oil prices held steady through the final week of Q2, solidifying the fourth straight quarterly decline for Brent and the second straight quarterly decline for WTI. Oil spiked in mid-2022 following the geopolitical uncertainty brought about by Russia’s invasion of Ukraine, but has since moderated as Russia has maintained high export levels and China’s post-pandemic recovery has sputtered.
4. Powell flags more than two hikes could be coming – On the panel at the ECB conference in Sintra, Portugal, Powell warned that investors should not exclude the possibility of interest rate hikes at “subsequent meetings.” In a follow-up speech about financial stability, Powell signaled that “a strong majority on the Committee expects two or more hikes to be appropriate.” The Fed views it has more work to do to get inflation down, and the markets have priced the July meeting at 83% probability for a 25 basis-points rate hike.
5. US GDP surprises and PCE is a Goldilocks – It is rare that markets react to backward-looking data such as Gross Domestic Product (GDP). The first quarter estimate of growth came out surprisingly strong at 2%, driven by consumption at 4.2% (vs. 3.8% expected) and exports at 7.8% (vs. 5.2% expected). Personal income was up by 0.4% on the month (vs. 0.3% expected) while core PCE annualized was 4.6% (vs.4.7% Y/Y expected). The US economy appears less affected by higher interest rates and is supported by the weaker dollar and robust services activity. The jobless claims fell back to 239K, the lowest since late May.
6. Global stickier core inflation– CPI releases show a continuation of the trend of falling headline inflation, with Eurozone energy CPI in -0.3% deflation, while core inflation (CPI ex-energy, ex-food) is showing signs of broadening pricing pressures. Germany’s regional consumer prices and Eurozone core CPI were higher than the previous release (6.8% Y/Y vs. 6.3% Y/Y, and 5.4% Y/Y vs. 5.3% Y/Y), driven by services, recreation, and food-related prices. Tokyo CPI accelerated to 5.3% from May, with components such as housing, leisure, and accommodation rising.
7. The liquidity drain update – The Fed’s balance sheet data showed that bank reserves declined for a third consecutive week. Since mid-June, reserves are down by $175 billion as the Treasury continues to rebuild the balance in its account at the Fed (called the “TGA”) which now totals $475 billion. The net effect on financial markets continues to be benign in part as the Fed’s reverse repo facility—a vehicle where money market funds park cash at the Fed—has also fallen by more than $250 billion. The large issuance of Treasury bills has so far been mainly absorbed by money market funds, which has had less of an effect on the financial system’s overall liquidity.
8. NKE & WBA report earnings misses – Shares of Nike (NKE) and Walgreens (WBA) were punished intraweek as both companies reported earnings misses for the first time in three years. NKE was able to mostly reverse the loss by Friday, but shares of WBA remained depressed after the company’s miss was accompanied by lowered full year earnings guidance in the face of a customer that is “feeling the strain of higher inflation and interest rates” and “pulling back on discretionary and seasonal spending.” Q2 earnings season will kick off in about two weeks. Consensus forecasts are predicting Q2 earnings to come in 8% below last year’s levels.
9. Bank stress tests – All 23 banks subject to the Fed’s annual stress test passed a hypothetical combination of stressors meant to test each bank’s resiliency in the face of a “severe global recession” where unemployment more than doubles from current levels as real estate values plummet. Bank shares broadly rose on the announcement and could continue to rise if some banks begin announcing plans for increased dividend payout ratios after Friday’s close, as expected. However, if separate expectations for new regulations stipulating increased capital requirements are enacted later this year these recent gains could be crimped.
10. Economic events next week – Despite the shortened trading week due to markets closing early on Monday and remaining closed on Tuesday in celebration of Independence Day, investors will receive many key pieces of data as we officially enter Q3. Ahead of Friday’s hotly anticipated Jobs report, the ISM will release June manufacturing and services PMIs, the Fed will release their most recent minutes, and the BLS will release May JOLTS figures.
IMPORTANT DISCLOSURES
Abbreviations: Consumer Confidence Survey: measures the level of consumer confidence in economic activity; Core PCE: personal consumption expenditures prices excluding food and energy prices; CPI: Consumer Price Index; ECB: European Central Bank; EPS: earnings per share; ISM Manufacturing PMI: Institute for Supply Management Purchasing Managers Index; JOLTS: Job Openings and Labor Turnover Survey; PCE: personal consumption expenditures; Powell: Jerome Powell, Chair of the Board of Governors of the Federal Reserve System; Treasury General Account (TGA): Treausry’s cash balance held at the Fed; West Texas Intermediate (WTI) Crude: refers to a grade or a mix of crude oil, and/or the spot price, the futures price, or the assessed price for that oil; colloquially WTI usually refers to the price of the New York Mercantile Exchange WTI Crude Oil futures contract or the contract itself.
Index Information: All returns represent total return for stated period. S&P 500 is a total return index that reflects both changes in the prices of stocks in the S&P 500 Index as well as the reinvestment of the dividend income from its underlying stocks. Dow Jones Industrial Average (DJ Industrial Average) is a price-weighted average of 30 actively traded blue-chip stocks trading New York Stock Exchange and Nasdaq. The NASDAQ Composite Index measures all NASDAQ domestic and international based common type stocks listed on the Nasdaq Stock Market. Russell 2000 is an index that measures the performance of the small-cap segment of the U.S. equity universe. MSCI International Developed measures equity market performance of large, developed markets not including the U.S. MSCI Emerging Markets (MSCI Emerging Mkts) measures equity market performance of emerging markets. Russell 1000 Growth Index measures the performance of the large- cap growth segment of the US equity universe. It includes those Russell 1000 companies with relatively higher price-to-book ratios, higher I/B/E/S forecast medium term (2 year) growth and higher sales per share historical growth (5 years). The Russell 1000 Value Index measures the performance of the large cap value segment of the US equity universe. It includes those Russell 1000 companies with relatively lower price-to-book ratios, lower I/B/E/S forecast medium term (2 year) growth and lower sales per share historical growth (5 years). The BBB IG Spread is the Bloomberg Baa Corporate Index that measures the spread of BBB/Baa U.S. corporate bond yields over Treasuries. The HY OAS is the High Yield Option Adjusted Spread index measuring the spread of high yield bonds over Treasuries. Atlanta Fed GDPNow index is a “nowcast” of real GDP growth based on available economic data for the current measured quarter. ISM manufacturing prices paid is a diffusion index of ISM Manufacturing PMI calculated by adding the percent of responses indicating they paid more for inputs plus one-half of those responding that they paid the same for inputs. The Services ISM Report on Business is based on data compiled from purchasing and supply executives nationwide. Membership of the Services Business Survey is diversified by NAICS, based on each industry’s contribution to gross domestic product (GDP).
Sector Returns: Sectors are based on the GICS methodology. Returns are cumulative total return for stated period, including reinvestment of dividends.
The views and opinions included in these materials belong to their author and do not necessarily reflect the views and opinions of NewEdge Capital Group, LLC.
This information is general in nature and has been prepared solely for informational and educational purposes and does not constitute an offer or a recommendation to buy or sell any particular security or to adopt any specific investment strategy.
NewEdge and its affiliates do not render advice on legal, tax and/or tax accounting matters. You should consult your personal tax and/or legal advisor to learn about any potential tax or other implications that may result from acting on a particular recommendation.
The trademarks and service marks contained herein are the property of their respective owners. Unless otherwise specifically indicated, all information with respect to any third party not affiliated with NewEdge has been provided by, and is the sole responsibility of, such third party and has not been independently verified by NewEdge, its affiliates or any other independent third party. No representation is given with respect to its accuracy or completeness, and such information and opinions may change without notice.
Investing involves risk, including possible loss of principal. Past performance is no guarantee of future results.
Any forward-looking statements or forecasts are based on assumptions and actual results are expected to vary from any such statements or forecasts. No assurance can be given that investment objectives or target returns will be achieved. Future returns may be higher or lower than the estimates presented herein.
An investment cannot be made directly in an index. Indices are unmanaged and have no fees or expenses. You can obtain information about many indices online at a variety of sources including: https://www.sec.gov/answers/indices.htm.
All data is subject to change without notice.
© 2026 NewEdge Capital Group, LLC

