1. Headline Inflation Finally Peaked in July
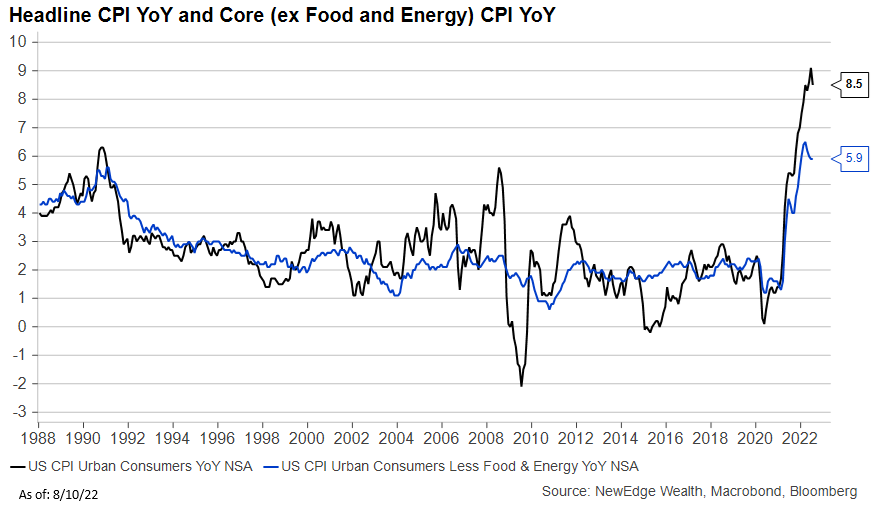
Thanks to the recent drop in energy prices, as well as the slowing in a few high-flying areas like used cars and airfares, July’s Consumer Price Index finally began to moderate to 8.6% (vs. 9.1% in June). Importantly, inflation did not accelerate month-over-month from June into July, which again was largely thanks to the drop in energy prices (energy swung from adding +60 bps to MoM inflation in June to detracting -40 bps from MoM inflation in July). Even with this moderation, the 8.6% YoY rate remains well above the Fed’s 2% target.
2. Inflation Remained Broad and Sticky, Making the Path to 2% Inflation a Long One
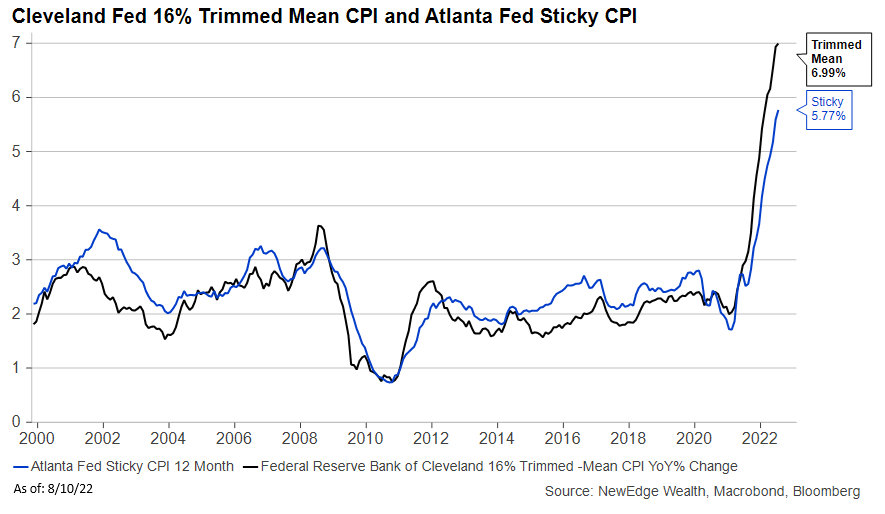
Measures of inflation breadth (how many items are seeing big jumps in prices) and stickiness (those items that tend to see slower price changes) remain elevated. This makes the Fed’s job difficult, as it points to a long journey to get back towards 2%. Factors like housing/shelter costs, running at +5.7%, and wages, running at +6.7%, point to the sticky nature of this heightened inflation, making the prospect of a Fed pivot in the next six months more challenging.
3. The Markets Think They Can Have Their Cake and Eat it Too
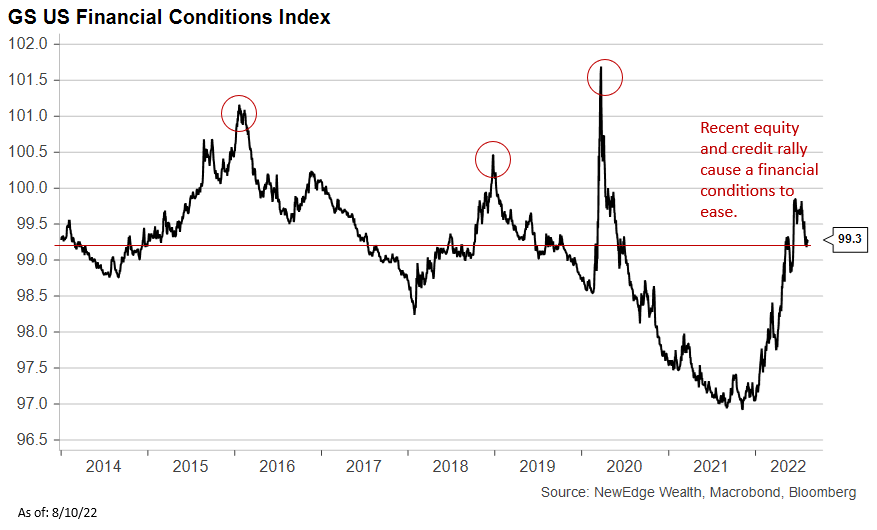
Markets rejoiced at the slower inflation data, which was interpreted as a signal that the Fed would not have to tighten policy as much to get inflation under control. Less tightening means the risk of a “hard landing” (or a big drop off in economic activity) has dropped. At the same time, parts of the bond market are still pricing in a start to rate cuts in early 2023. It is difficult to imagine the Fed pivoting to accommodation in early 2023 if the economy is resilient while inflation remains elevated (thanks to the sticky components mentioned above). Further, recent rallies in equity and credit markets have caused financial conditions to ease back to levels that are well below prior peaks that got the Fed to act and support markets.
4. Valuation is a Ceiling for Equities
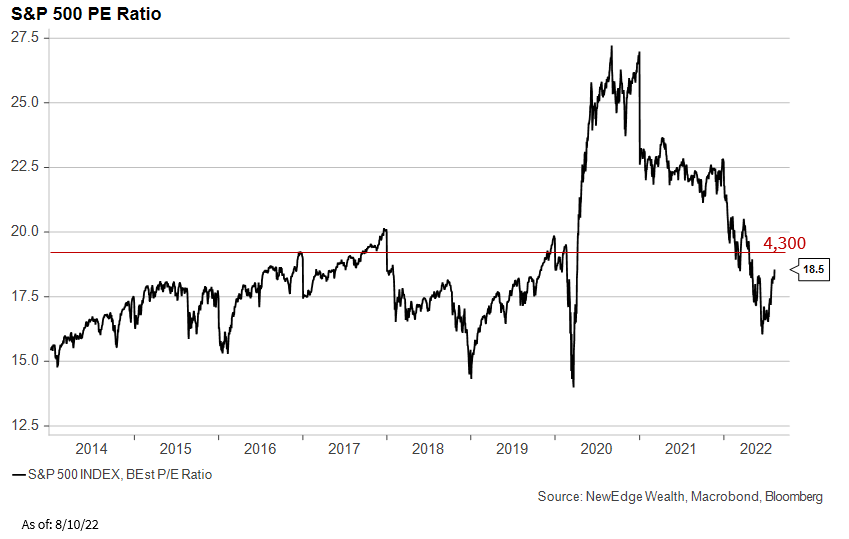
The recent rally in equities looks set to continue in the very near term (powered through resistance with strong momentum and breadth, meaning many names are participating in this rally). But we see valuation as a potential ceiling for equities. If we rally to 4,300 (the 200 day moving average), the S&P 500 will be trading at 19x earnings. This is expensive by any historical standard outside of the 2020/2021 experience, when both fiscal and monetary policy were running at full crisis levels, providing a boost to both earnings and valuations. We struggle to see how the market can justify paying much more than 19x earnings given the Fed’s continued path of tightening liquidity and the fact that today’s earnings estimates are not depressed (current estimates are for +11% growth in 2022 and +8% growth in 2023).
5. Non-US Markets Continue to Struggle, Watch the USD
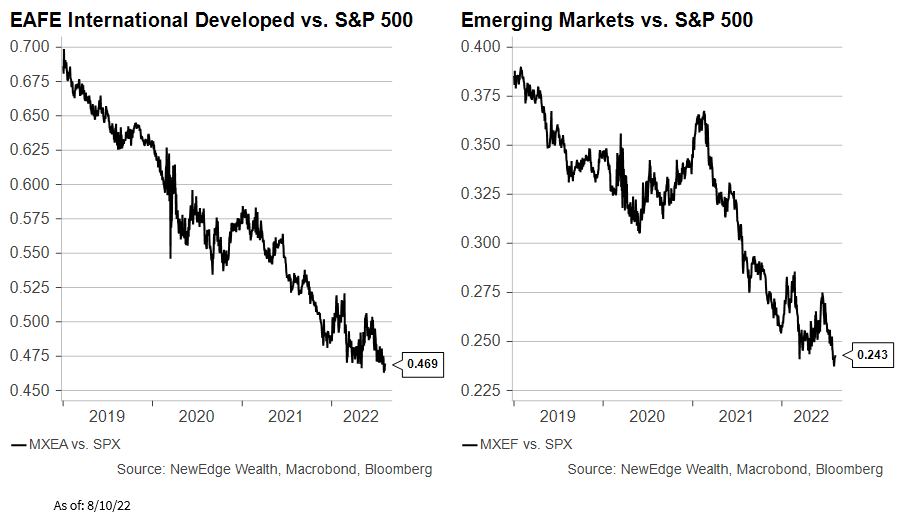
International developed and emerging markets have continued to make new relative lows of underperformance vs. the US’s S&P 500. This weak trading is despite valuations that have been at 30-40% discounts to the US for an extended period of time. This highlights that valuation is not a catalyst. Instead, the catalyst for better non-US performance would be a much weaker USD (for example, the USD depreciated by 40% in the mid-2000s, driving the huge rally in non-US stocks). The USD was weak following Wednesday’s muted CPI report, but remains in an uptrend and is not oversold yet. To rotate into an overweight in Int’l and EM, we need to see a protracted and prolonged period of USD weakness.
IMPORTANT DISCLOSURES This information is general in nature and has been prepared solely for informational and educational purposes and does not constitute an offer or a recommendation to buy or sell any particular security or to adopt any specific investment strategy. NewEdge and its affiliates do not render advice on legal, tax and/or tax accounting matters. You should consult your personal tax and/or legal advisor to learn about any potential tax or other implications that may result from acting on a particular recommendation. The trademarks and service marks contained herein are the property of their respective owners. Unless otherwise specifically indicated, all information with respect to any third party not affiliated with NewEdge has been provided by, and is the sole responsibility of, such third party and has not been independently verified by NewEdge, its affiliates or any other independent third party. No representation is given with respect to its accuracy or completeness, and such information and opinions may change without notice. Investing involves risk, including possible loss of principal. Past performance is no guarantee of future results. Any forward-looking statements or forecasts are based on assumptions and actual results are expected to vary from any such statements or forecasts. No assurance can be given that investment objectives or target returns will be achieved. Future returns may be higher or lower than the estimates presented herein. An investment cannot be made directly in an index. Indices are unmanaged and have no fees or expenses. You can obtain information about many indices online at a variety of sources including: https://www.sec.gov/fast-answers/answersindiceshtm.html or http://www.nasdaq.com/reference/index-descriptions.aspx. All data is subject to change without notice. © 2024 NewEdge Capital Group, LLC
The views and opinions included in these materials belong to their author and do not necessarily reflect the views and opinions of NewEdge Capital Group, LLC.


