


Prove It All Night: U.S. Equity 1Q23 Earnings Outlook
Everybody’s got a hunger, a hunger they can’t resist
There’s so much that you want, you deserve much more than this
But if dreams came true, oh, wouldn’t that be nice
But this ain’t no dream we’re living through tonight
– “Prove it All Night”, Bruce Springsteen
The return of Bruce Springsteen to New York City last weekend reminded us of his 1978 song “Prove it All Night”, which he has said conveys the message “success requires sacrifice”. This is a fitting analogy for the coming U.S. corporate earnings season, which kicks into gear next week with some of the largest index constituents and economic bellwethers reporting first quarter results on April 14th.
Historically, corporate earnings are always a key market driver, however we would argue they are even more important today, given elevated valuations and amidst an environment of tightening financial liquidity, which has not been the case in recent earnings recessions. As margin pressures increasingly weigh on profitability, the winners of this earnings season may ultimately be those companies that can make sacrifices to defend their profit margins.
Aggregate Earnings
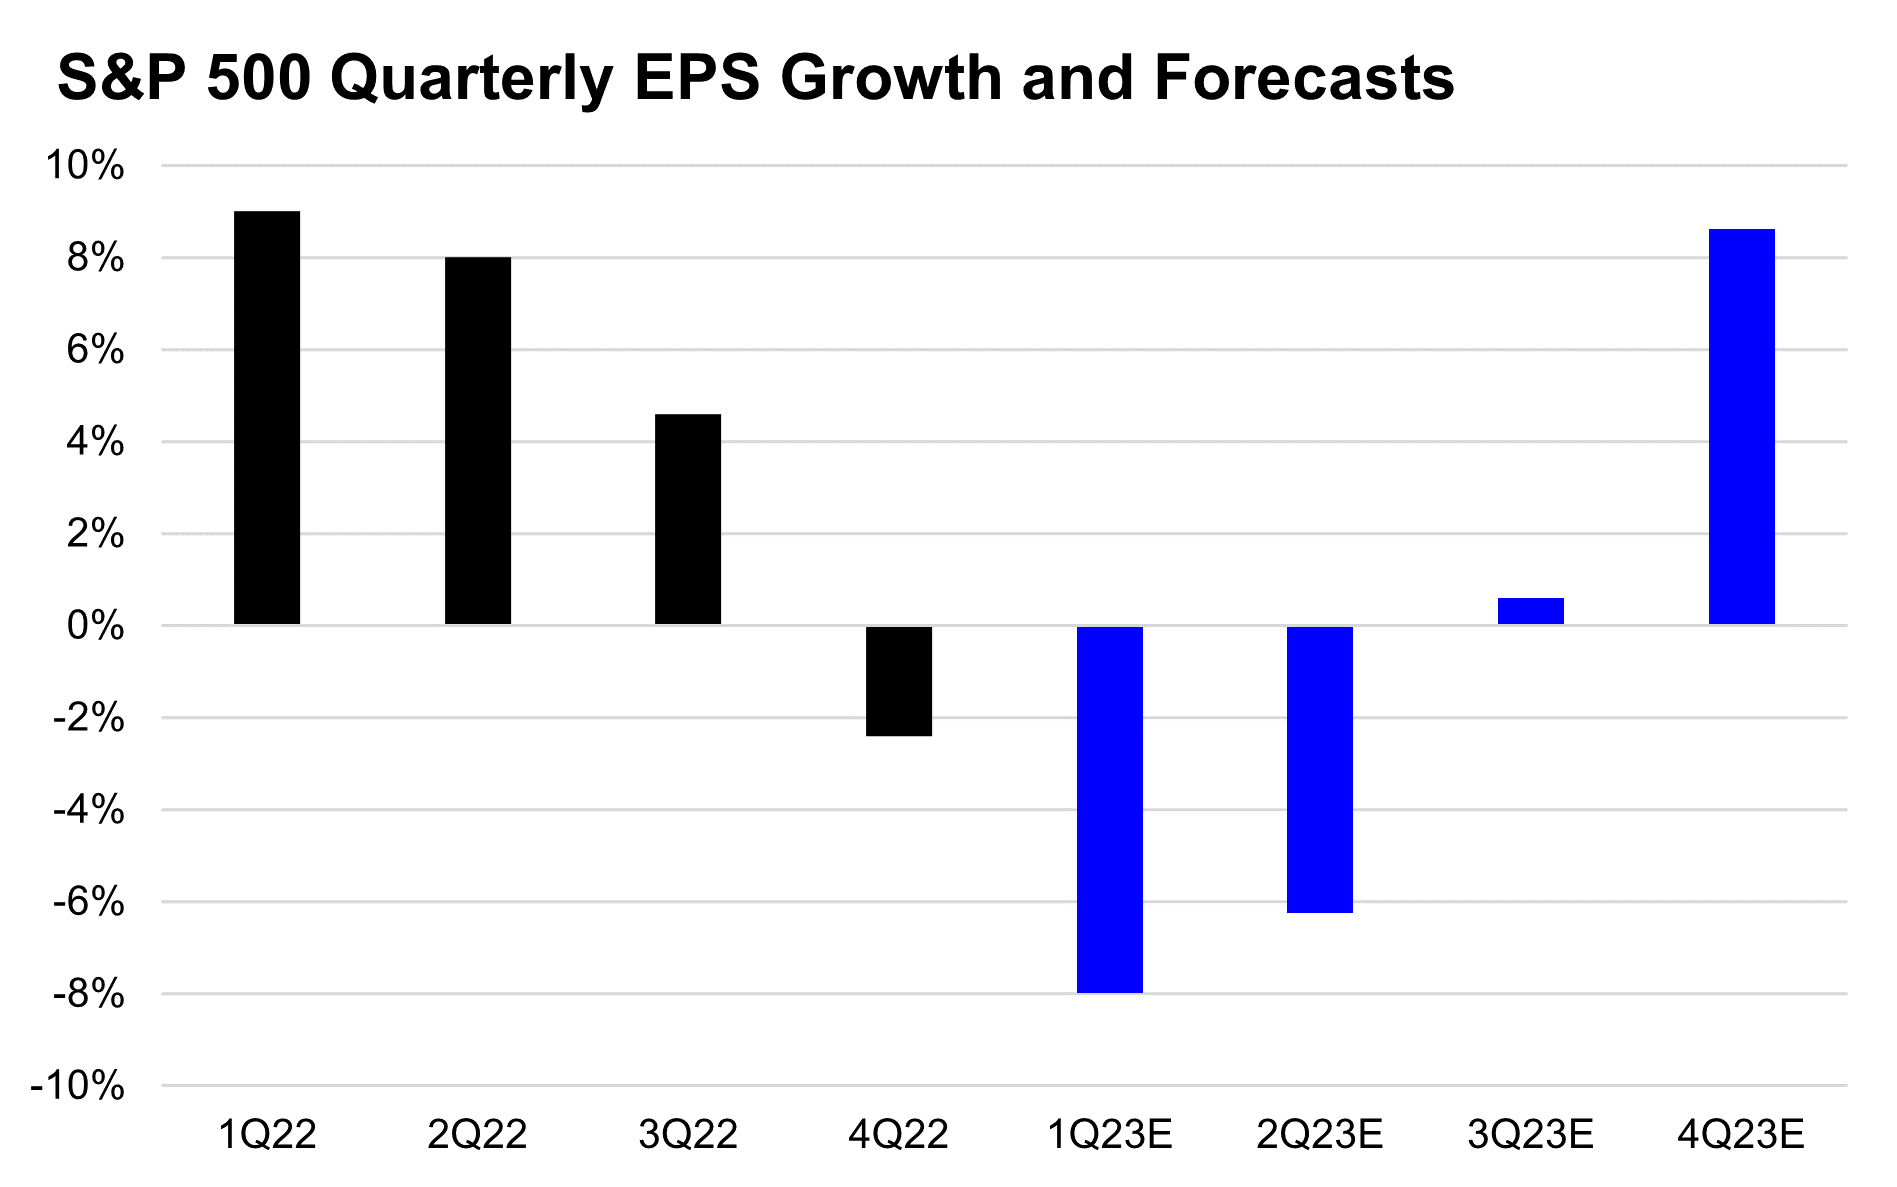
According to Bloomberg, aggregate earnings for the S&P500 are expected to decline -8.0% year over year in Q1. This follows the -2.1% year over year earnings decline in Q4 2022 and represents continued weakening on the corporate earnings front, driven by falling margins, with revenues expected to have grown in both quarters. If -8.0% is the actual decline in Q1 earnings, it would represent the largest year over year decline in EPS growth since Q2 2020 when earnings fell -33% year over year at the height of pandemic driven lockdowns.
Aggregate Revenues & Operating Margins
While blended revenues are expected to rise +3.1% for the quarter (down from +6.1% in Q4 2022), continued pressures on margins look to be the primary driver behind falling earnings. In aggregate, operating margins are forecast to decline 60bps in Q1, to an average of 14.3%. This follows the 90bps operating margin decline in Q4 2022. If 14.3% is the actual operating margin posted by the S&P500 constituents, it would also represent the least profitable quarter since Q4 2020 according to Bloomberg.
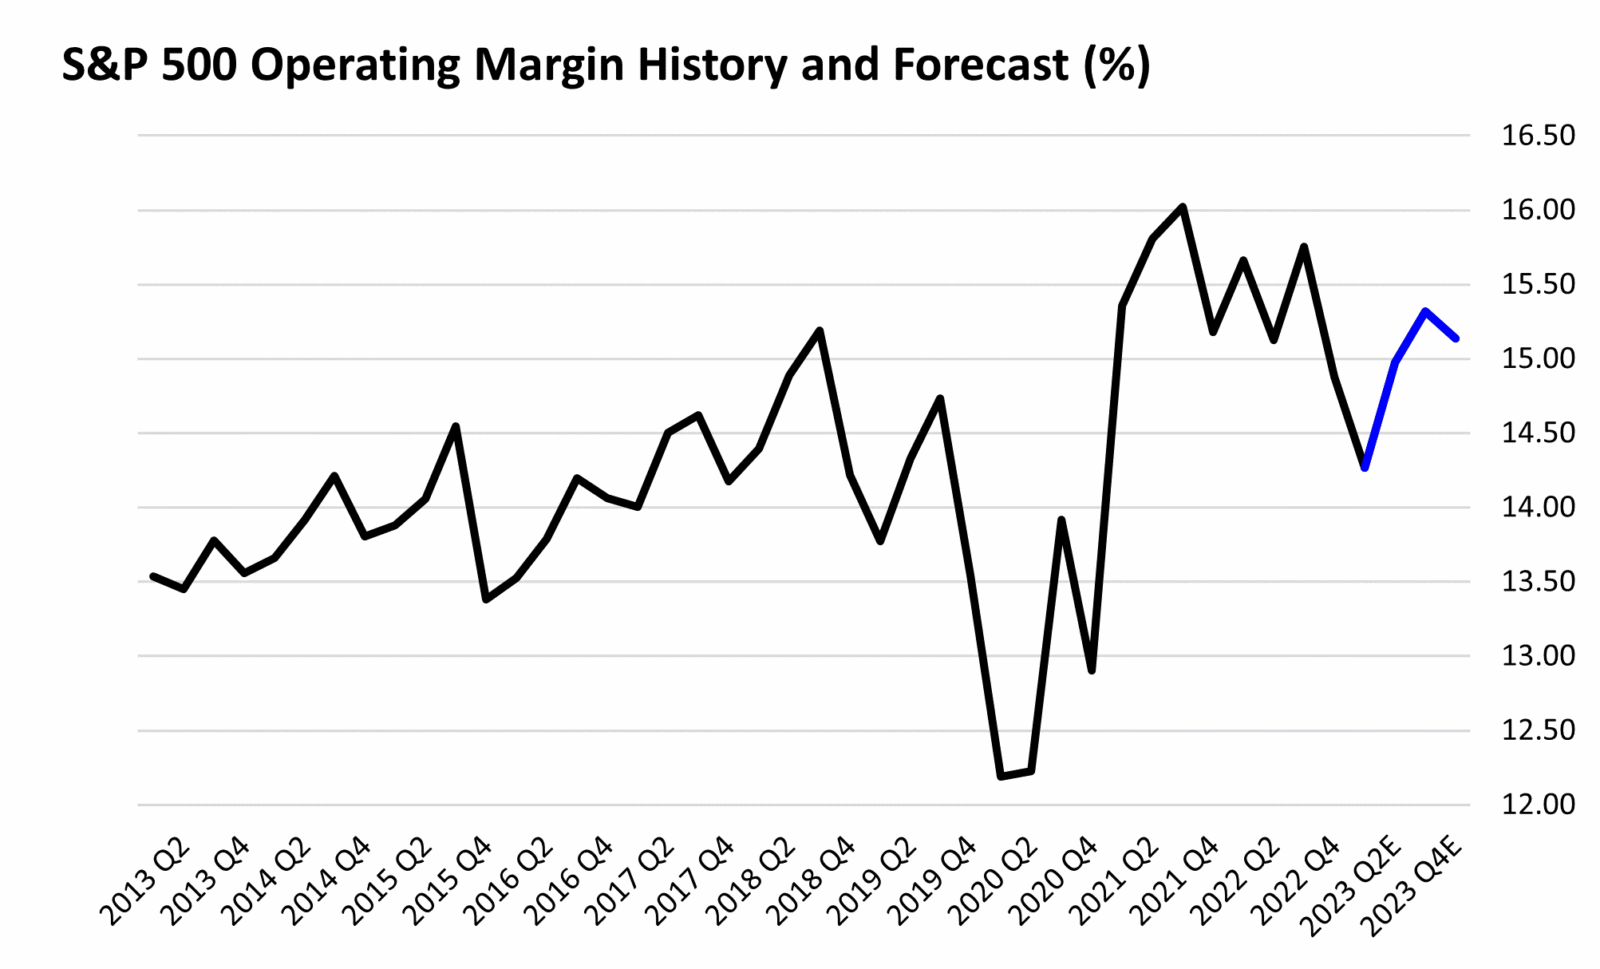
Profit margins continue to be squeezed be slowing revenue growth (related to moderating inflation and waning pricing power), elevated input and labor costs, and growth in capital expenditures, which is one reason why we continue to hear management teams highlighting efficiency and expense management goals in 2023.
Sector Trends
At the sector level analysts expect to see wide dispersion in earnings growth, led by the Energy sector with expected EPS growth of 10.0% year over year, while the Materials sector is expected to post the largest earnings decline at -35.2% year over year. In aggregate 6 of 11 S&P500 sectors are expected to post year over year declines in earnings according to Bloomberg.
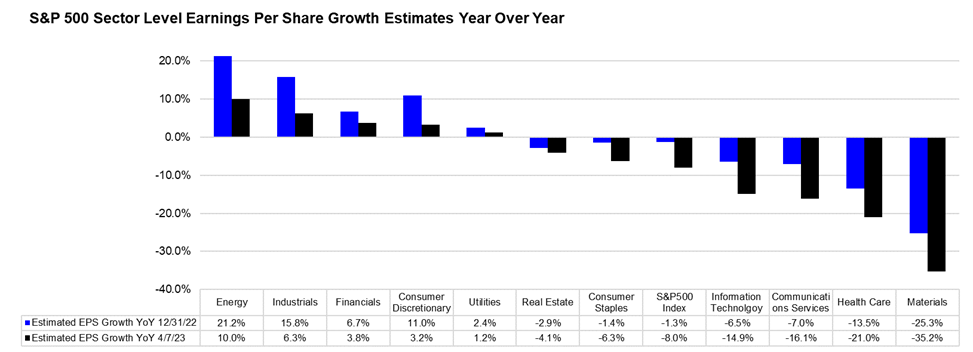
Expected revenue growth tells a different story, as the Financials sector is expected to be among the top performers with +9.1% year over year revenue growth, while the Materials sector is expected to post the largest year over year revenue decline of any sector at -8.0%.
The near double digit top line growth in the Financials sector represents the highest year over year revenue growth rate since mid-2021, as large cap banks are expected to generate over 30% year over year growth in net interest income, and net interest margins are expected to be up 65bps year over year, more than offsetting continued weakness in investment banking and capital markets activity. This quarter may represent a peak in net interest margins for large cap banks as increased competition for deposits, such as from higher Treasury and money market yields, may require incremental increases in deposit rates. Analysts are likely to focus on management teams’ commentary about how recent regional banking issues and potential slowing economic growth are impacting deposit flows, loan growth, credit quality, and more.
Analyst Revisions
Recent concerns about bank liquidity and potential declines in small business lending have led to increased expectations of a broader economic recession on the horizon. While it is unlikely that this will have a substantial impact on Q1 earnings, mostly in the context of relatively resilient economic data to start the quarter, analysts did trim estimates for both Q1 and the full year.
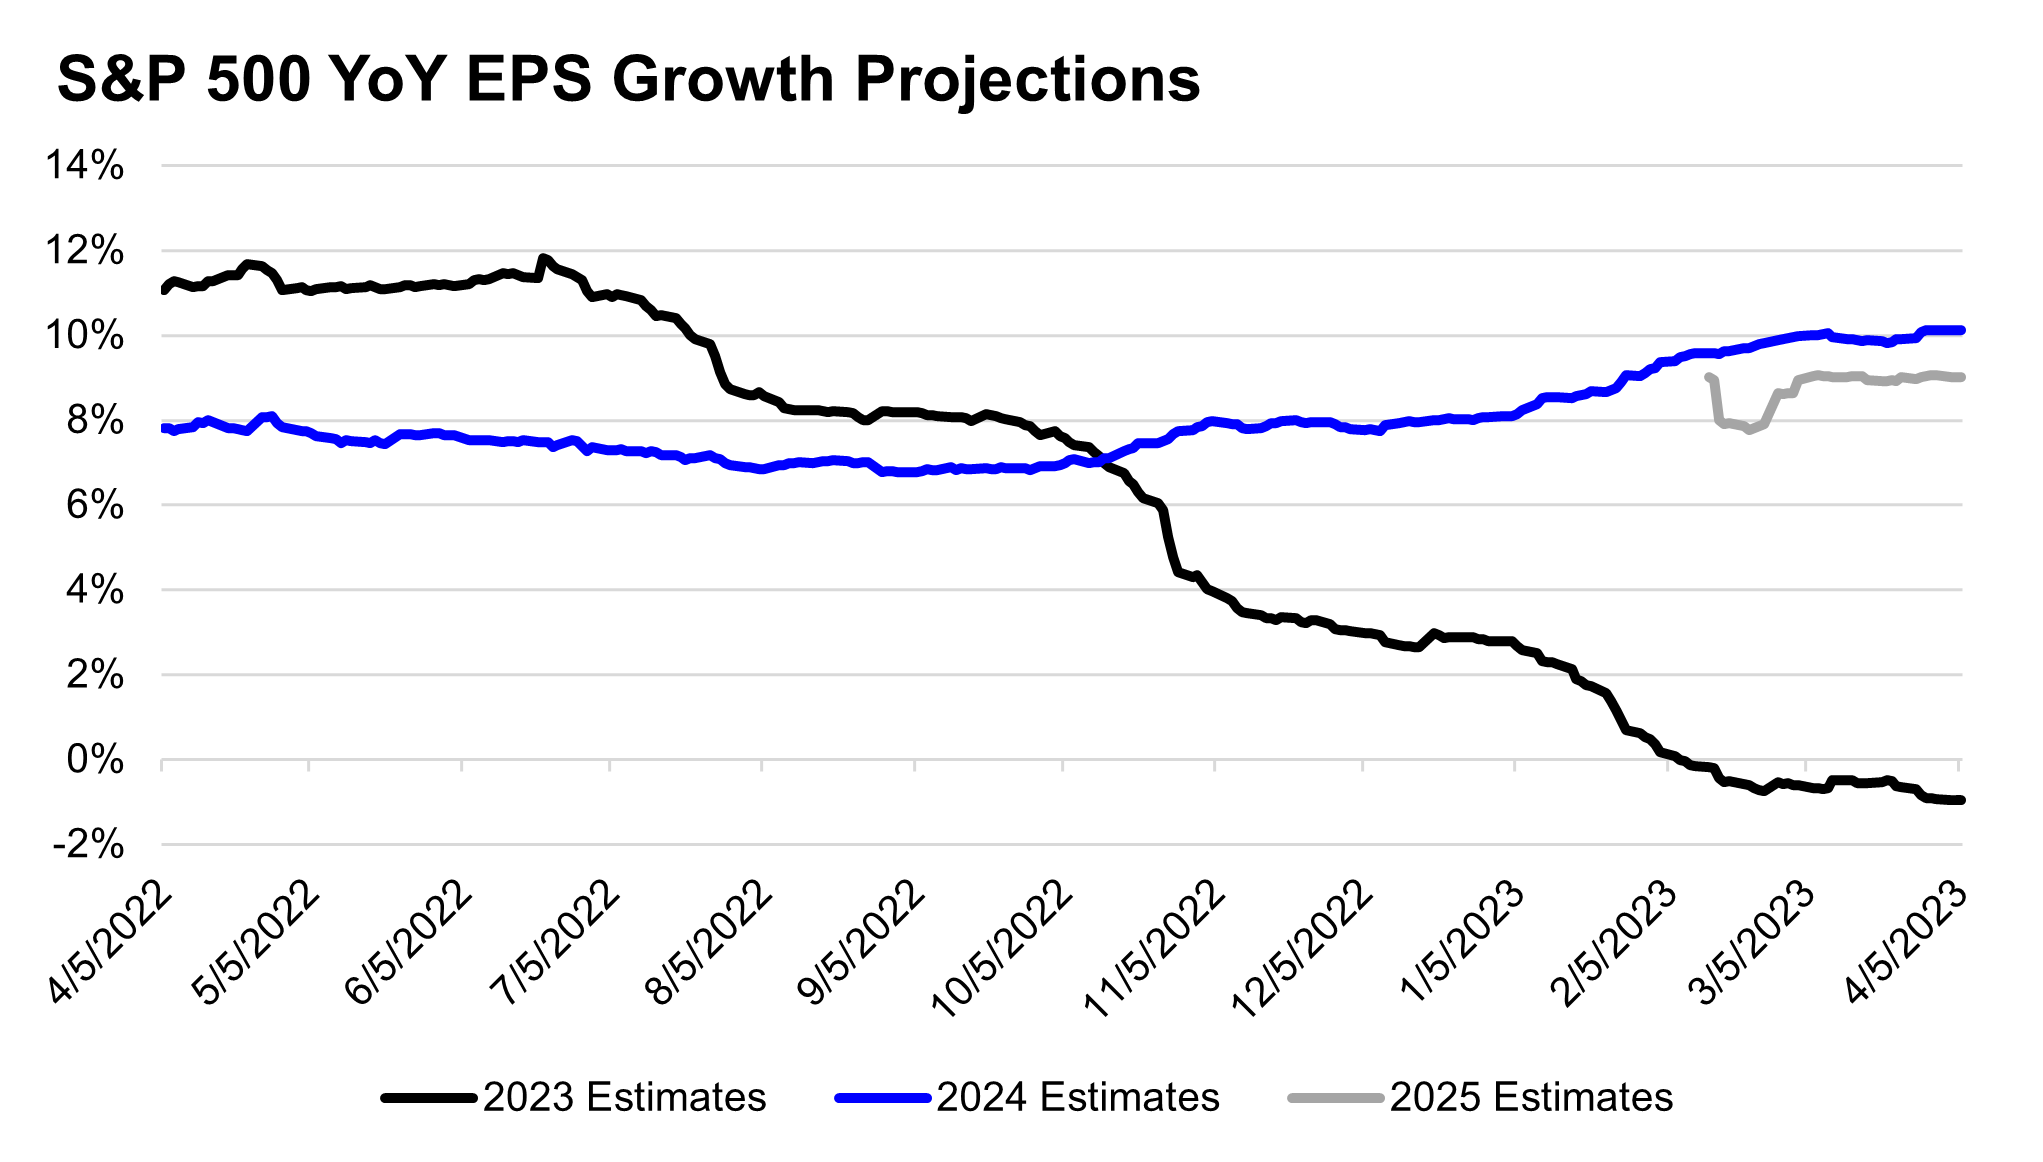
During the first quarter, analysts lowered their 1Q23 EPS estimates by over 6%, nearly double the average decline in quarterly earnings estimates seen over the past ten years. Analysts have also lowered their full calendar year 2023 estimates as well, reducing estimates by a larger than average measure of -3.8% to $221.44 (reflecting 0% growth over 2022’s earnings).
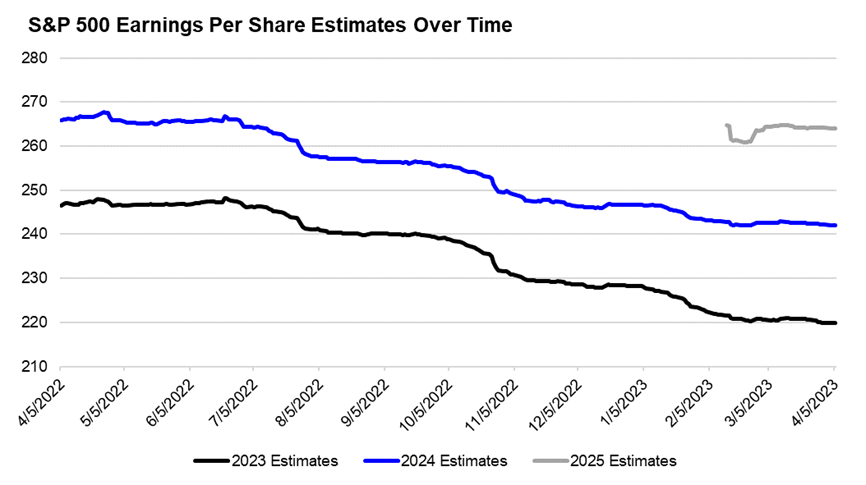
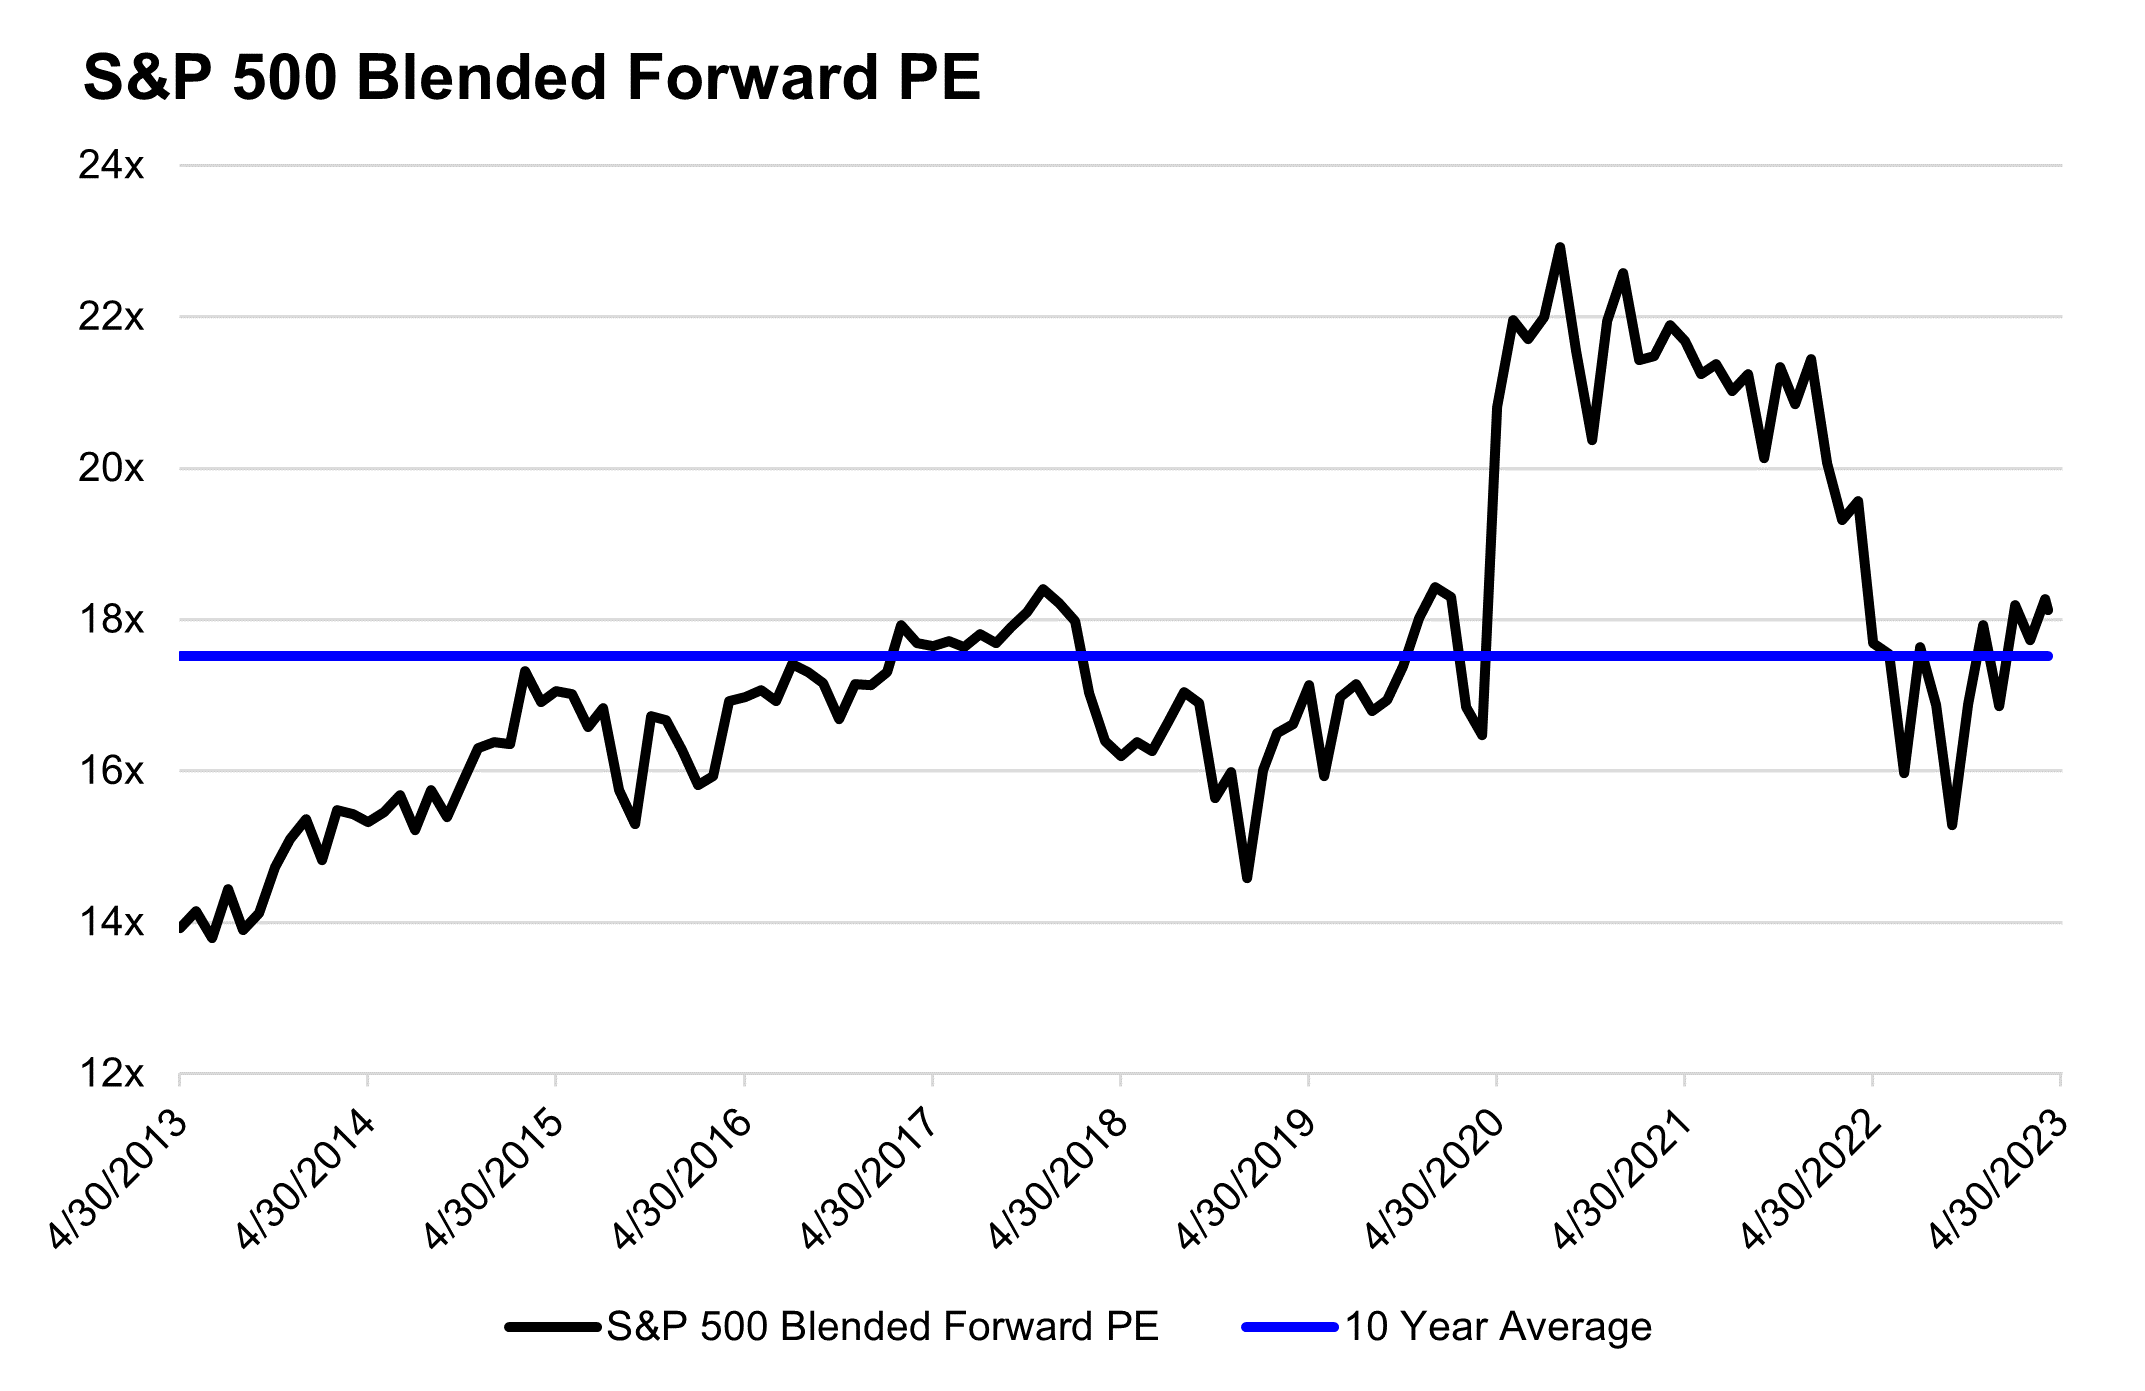
If this were the full year earnings result for the S&P500 for 2023, it would put the broader index at roughly 18.4x (4,070 as of 4/6/23), which is a 10% premium to the average Forward P/E multiple on the index over the past 25 years.
Looking even further ahead, we have seen a meaningful reset of analyst expectations for 2024 earnings, which have declined -10% over the past year to $243 currently. Even with this estimate decline, $243 for 2024 implies ~10% year over year earnings growth which in our view may be difficult to attain given continued pressures on profitability and if the U.S. economy were to experience a recession at some point in 2023 or 2024.
Management Guidance
Management guidance suggests an increasingly conservative outlook and may hint that even revised analyst expectations are too rosy. Of the 106 companies that have published Q1 guidance, 75% have guided below analyst expectations, which is well above both the five- and ten-year averages according to FactSet. In general, management teams continue to focus on operational efficiency in the face of economic headwinds and slowing top line growth; however, their overall guidance suggests these headwinds may not be fully reflected in analyst estimates.
Outlook
As we mentioned earlier, corporate earnings trends are even more under the microscope today given recent stresses in financial markets and growing uncertainty about the future path of economic growth., Given this uncertainty, it is possible that we will see magnified price reactions to both earnings surprises and earnings misses compared to prior quarters.
At the same time, forward guidance around top line growth and management’s ability to defend profit margins will be highly scrutinized. While Q1 may mark the start of a technical “earnings recession”, defined as two consecutive quarters of negative year over year earnings growth, we may not yet be at the ultimate trough in this earnings cycle, as early expectations for Q2 earnings call for a -6.3% year over year decline.
To end on a positive note, this challenging earnings environment and ensuing reset of analyst expectations does set up easier year over year comparisons in the quarters ahead, and those companies that are able to drive operational efficiency now, may ultimately be well positioned for a more favorable macro environment down the road, underscoring our introductory message that success requires sacrifice.
Top Points of the Week
By Cameron Dawson, CFA®
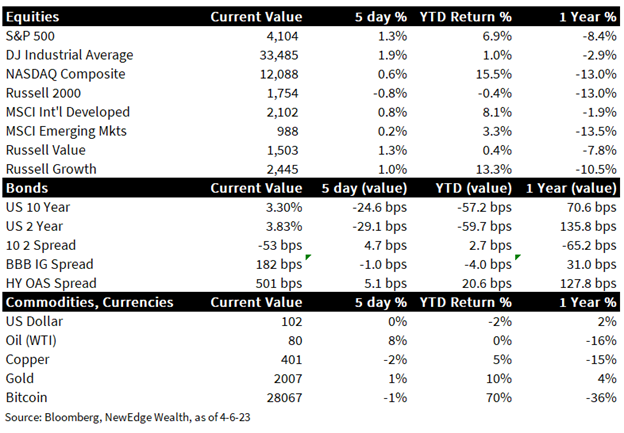
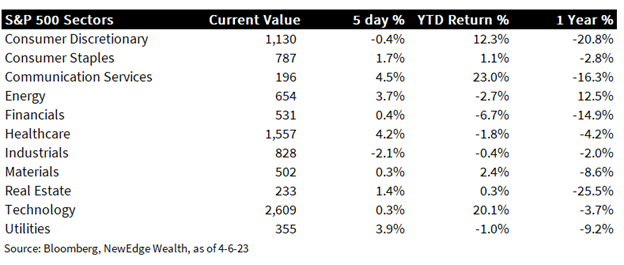
- Equites Rise for the Week: Despite softer trading mid-week on growth fears, broad equity indices continued their winning streak for the full week, with the only exception being the Russell 2000 Small Cap Index, which ended the week in negative territory. In the U.S., Value oriented indices (Russell 1000 Value and Dow Jones Industrial Average) outperformed Growth oriented indices (Russell 1000 Growth and NASDAQ Composite), while the S&P 500 outperformed non-U.S. indices. On S&P 500 sectors, Energy and Communication Services were leaders, while Technology and Materials were laggards.
- Yields Slip on Growth Fears, High Yield Spreads Widen: Treasury yields fell across the yield curve on the week, as U.S. economic data come in softer than expected. Despite the resilient trading in equities, high yield bond spreads widened slightly on the week, likely driven by heightened concerns about growth.
- Oil Jumps on OPEC+ Cut: WTI Crude Oil prices rose +8% to $80/barrel in response to a surprise production cut from OPEC+, which expressed a desire to reduce output by 1 million barrels a day. Half of this production cut is expected to come from Saudi Arabia, which has fiscal budget pressure as oil prices fall (the Kingdom is estimated to have a $73 fiscal breakeven for oil prices). This cut was thought to be in response to the White House saying it would delay replenishing the Strategic Petroleum Reserve, after selling 221 million barrels from the inventory in 2022, leaving 370 million barrels, the lowest since 1983.
- Gold Nears an All–Time High: Gold rose slightly on the week to $2,010/ounce, nearing its all-time high of $2,042. Gold’s strength in 2023 has been driven by falling real yields, USD weakness, central bank buying, and likely risk-off demand from uncertainty about the future path of growth, inflation, and monetary policy.
- U.S. PMIs Disappoint, Sparking Growth Fears: Purchasing Managers Indices (PMI) from the Institute of Supply Management (ISM) disappointed this week. Manufacturing came in lower than expected (46.3 vs. 47.5 consensus) with distinct softness in New Orders (44.3 vs. 47.5 consensus). Services was weaker than expected (52.6 vs. 53.8 consensus), with New Orders falling sharply vs. February (52.2 vs. 62.6 prior). The bright point for both readings was lower prices paid vs. February (Manufacturing 49.2 vs. 51.3; Services 59.5 vs. 65.6 prior). Note that PMIs above 50 signal expansion, and below 50 contraction.
- Labor Data Weakens, But Still Historically Tight: Labor data came in slightly softer than expected on the week, with JOLTS Job Openings for February falling more than expected (9.93 million vs. 10.5m consensus), ADP Employment Change for March lower than expected (145k vs. 210k consensus), and Initial Jobless Claims for the week higher than expected (228k vs. 200k consensus). Note the labor market is still historically tight, with JOLTS still showing 2 million more job openings vs. the pre-pandemic peak and ADP reporting 7.2% and 14.2% wage growth for job stayers and switchers, respectively. March Nonfarm Payrolls are reported on Friday 4/7/23 when the market is closed.
- Fed Speak Pushes Back Against Bond Market: Fed speakers continued to emphasize the need to prioritize the fight against inflation in deciding the path forward for monetary policy. Non-voting Loretta Mester of the Cleveland Fed outlined the need for rates to go above 5% and stay there for “some time” to ensure confidence that inflation was defeated. Non-voting, and noted hawk, James Bullard of the St. Louis Fed said that he does not expect an imminent credit crunch from bank issues to derail the Fed’s fight against inflation.
- Chinese PMI Data Stronger: The China Caixin Services PMI jumped in March (57.8 vs. 55 prior), a 28 month high, and reflecting the recovery in activity as China reopens its economy after prolonged COVID lockdowns.
- Japan Yield Curve Control Debated: A former Bank of Japan (BOJ) director, Kazuo Momma, discussed that Japan could end its Yield Curve Control (YCC) policy as soon as April as the new BOJ governor, Kazuo Ueda, takes over leadership of the central bank. This policy change could have significant implications on global markets, as Japanese investors may lose their appetite for foreign bonds if local yields rise, and the BOJ reduces how much liquidity it is injecting into global markets in order to defend the interest rate peg (the BOJ has expanded its balance sheet by $1 trillion USD since October of 2022 in order to defend YCC).
- Coming up Next Week: For economic data, investors will focus on CPI data on Wednesday (current consensus is for 5.2% headline and 5.6% core) and PPI on Thursday (current consensus is for 3.2% headline). Earnings season kicks off with the Financials (JPM, WFC, PNC, and C), which will be watched closely for commentary about the impact of recent regional banking stress on the broader industry, as well as the banks’ assessments of current economic health.
IMPORTANT DISCLOSURES
Abbreviations:
BOJ: Bank of Japan; China Caxin Services PMI: Caixin China General Services PMI seeks to provide the most up-to-date possible indication of what is happening in the country’s growing services industry by tracking variables such as sales, employment, inventories and prices; CPI: Consumer Price Index; EPS: Earnings per Share; ISM Manufacturing PMI: Institute for Supply Management Purchasing Managers Index; JOLTS: Job Openings and Labor Turnover Survey; PE: Price to Earnings Ratio, the ratio of share price of a stock to its EPS; PPI: Producer Price Index; Ueda: Kazuo Ueda, nominee for governor of the Bank of Japan; West Texas Intermediate (WTI) Crude: West Texas Intermediate can refer to a grade or a mix of crude oil, and/or the spot price, the futures price, or the assessed price for that oil; colloquially WTI usually refers to the price of the New York Mercantile Exchange WTI Crude Oil futures contract or the contract itself; YCC: Yield Curve Control is a monetary policy action whereby a central bank purchases variable amounts of government bonds or other financial assets in order to target interest rates at a certain level .
Index Information: All returns represent total return for stated period. S&P 500 is a total return index that reflects both changes in the prices of stocks in the S&P 500 Index as well as the reinvestment of the dividend income from its underlying stocks. Dow Jones Industrial Average (DJ Industrial Average) is a price-weighted average of 30 actively traded blue-chip stocks trading New York Stock Exchange and Nasdaq. The NASDAQ Composite Index measures all NASDAQ domestic and international based common type stocks listed on the Nasdaq Stock Market. Russell 2000 is an index that measures the performance of the small-cap segment of the U.S. equity universe. MSCI International Developed measures equity market performance of large, developed markets not including the U.S. MSCI Emerging Markets (MSCI Emerging Mkts) measures equity market performance of emerging markets. Russell 1000 Growth Index measures the performance of the large- cap growth segment of the US equity universe. It includes those Russell 1000 companies with relatively higher price-to-book ratios, higher I/B/E/S forecast medium term (2 year) growth and higher sales per share historical growth (5 years). The Russell 1000 Value Index measures the performance of the large cap value segment of the US equity universe. It includes those Russell 1000 companies with relatively lower price-to-book ratios, lower I/B/E/S forecast medium term (2 year) growth and lower sales per share historical growth (5 years). The BBB IG Spread is the Bloomberg Baa Corporate Index that measures the spread of BBB/Baa U.S. corporate bond yields over Treasuries. The HY OAS is the High Yield Option Adjusted Spread index measuring the spread of high yield bonds over Treasuries. ISM manufacturing prices paid is a diffusion index of ISM Manufacturing PMI calculated by adding the percent of responses indicating they paid more for inputs plus one-half of those responding that they paid the same for inputs. The Services ISM Report on Business is based on data compiled from purchasing and supply executives nationwide. Membership of the Services Business Survey is diversified by NAICS, based on each industry’s contribution to gross domestic product (GDP).
Sector Returns: Sectors are based on the GICS methodology. Returns are cumulative total return for stated period, including reinvestment of dividends.
The views and opinions included in these materials belong to their author and do not necessarily reflect the views and opinions of NewEdge Capital Group, LLC.
This information is general in nature and has been prepared solely for informational and educational purposes and does not constitute an offer or a recommendation to buy or sell any particular security or to adopt any specific investment strategy.
NewEdge and its affiliates do not render advice on legal, tax and/or tax accounting matters. You should consult your personal tax and/or legal advisor to learn about any potential tax or other implications that may result from acting on a particular recommendation.
The trademarks and service marks contained herein are the property of their respective owners. Unless otherwise specifically indicated, all information with respect to any third party not affiliated with NewEdge has been provided by, and is the sole responsibility of, such third party and has not been independently verified by NewEdge, its affiliates or any other independent third party. No representation is given with respect to its accuracy or completeness, and such information and opinions may change without notice.
Investing involves risk, including possible loss of principal. Past performance is no guarantee of future results.
Any forward-looking statements or forecasts are based on assumptions and actual results are expected to vary from any such statements or forecasts. No assurance can be given that investment objectives or target returns will be achieved. Future returns may be higher or lower than the estimates presented herein.
An investment cannot be made directly in an index. Indices are unmanaged and have no fees or expenses. You can obtain information about many indices online at a variety of sources including: https://www.sec.gov/answers/indices.htm.
All data is subject to change without notice.
© 2026 NewEdge Capital Group, LLC

