


“It is far better to buy a wonderful company at a fair price than a fair company at a wonderful price.” – Warren Buffett
This simple statement is a fitting analogy for our equity investing philosophy at NewEdge, where we manage portfolios focused on what we believe are the highest-quality companies in their respective industries. Central to this philosophy is our belief that owning quality companies over the long term can ultimately lead to better outcomes for our clients, as quality investing can offer tax-efficient returns powered by resilient compound earnings growth. In this piece, we will dive into the rationale behind investing in quality companies, detail how we identify these companies, and illustrate how our approach can be beneficial for long-term investors.
Key Points:
- Quality investing harnesses the value of time in the market as opposed to timing the market, capturing the benefits of tax-efficient long-term growth.
- Quality companies can provide reduced economic sensitivity, historically outperforming in down markets, which can help investors stay the course in volatile periods.
- Corporate earnings drive nearly all equity market performance in the long term, and prioritizing companies with the most durable earnings growth can help to generate better long-term results.
Why We Believe in Quality Investing
We believe the best way to generate long-term growth in equities is to capitalize on time in the market, allowing the compounding of after-tax and after-fee returns to drive long-term portfolio growth. Combining this approach with an emphasis on quality companies creates two structural advantages:
- Quality companies tend to outperform in down markets and over full market cycles due to the durability of their earnings growth. This helps remove emotion from the investing experience while mitigating common behavioral finance errors such as loss avoidance or short-term thinking, allowing investors to preserve and grow wealth over time.
- Quality companies are well suited for a longer-term buy-and-hold approach due to their ability to generate more consistent profitability, which allows for compound value creation, lower investment turnover, and, ultimately, better after-tax returns.
At the end of the day, a portfolio of quality companies can be more economically resilient, can provide a more emotionally comfortable investing experience, and may result in greater after-tax investment appreciation. These traits alone support our thesis for quality as a core equity holding; however, as historical data illustrates, quality investing has offered consistent alpha generation as well.
The Results of Investing in Quality Companies
While equity market returns are positively biased, they are inherently volatile. Since 1929, the S&P500 Index has posted positive calendar year returns 72% of the time, yet in fourteen calendar years during this period, the index posted declines of -10% or greater1. Intra-year declines are even more common; historically, equity investors have experienced peak-to-trough declines of -10% or more about once a year and peak-to-trough declines of -20% or more about once every six years2. These drawdowns can trigger behavioral responses such as loss avoidance or short-term thinking, which can be detrimental to an investor’s long-term performance.
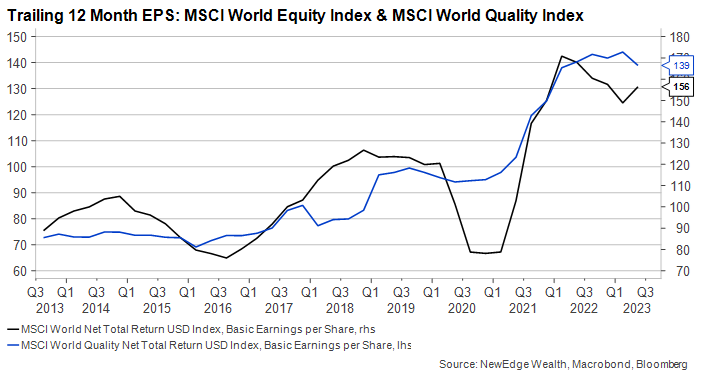
Quality companies have proven to be among the market’s best performers across economic cycles, as we will illustrate below. While they are often less economically sensitive, it is important to note that they are not necessarily defensive companies, which tend to lag in bull markets due to the nature of their industries. Instead, quality companies are less economically sensitive because they are able to deliver more consistent earnings growth, which can provide a degree of capital protection during difficult markets. In the below chart, we highlight how the earnings for quality companies (illustrated by the MSCI World Quality Index) over the past ten years have proven to be more resilient than the broader market (illustrated by the MSCI World Equity Index), especially during earnings recessions, which ultimately can lead to higher compound growth.
To illustrate how the quality factor has performed over time, our team analyzed the weekly historical performance of the MSCI World Quality Equity Index relative to the MSCI World Equity Index over rolling 3-year periods over the past two decades. The MSCI World Quality Index is comprised of the 300 highest-rated, large-cap quality companies around the world according to MSCI’s framework, prioritizing metrics like profitability, free cash flow, relative valuation, and balance sheet stability, while the MSCI World Equity Index is comprised of the 1,500 largest companies in the world by market capitalization.
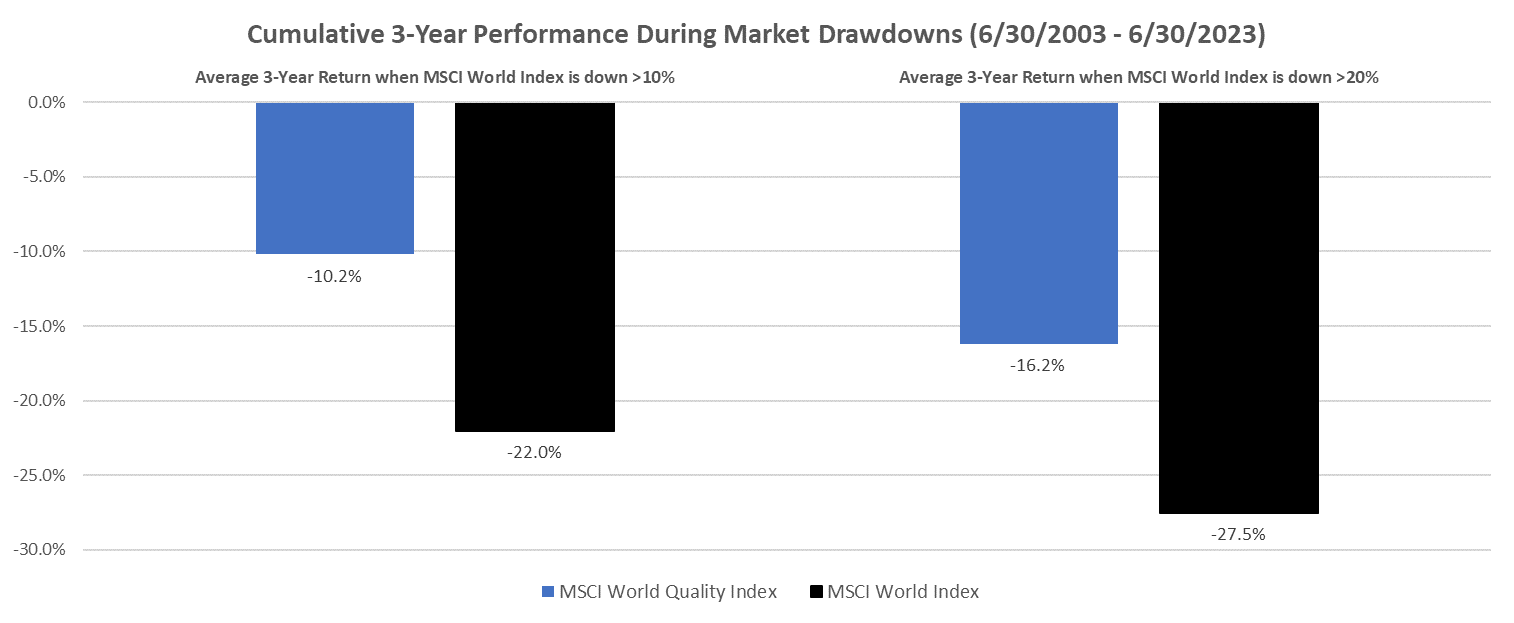
Our team examined 1,045 weekly 3-year periods since 2003, and we found that the Quality Index outperformed the traditional cap-weighted index in 76% of those periods, producing a 3-year average excess cumulative return of 6.1%. While we recognize that the last two decades have seen some extreme market drawdowns, the historical data broadly supports the notion that quality companies outperform in down markets. Since 2003, we have found 147 instances where the MSCI World Equity Index was down 10% or more over a 3-year period. During these periods, the MSCI World Quality Index produced average cumulative excess returns of 11.8%. In addition, we found 80 instances where the MSCI World Equity Index was down 20% or more over a rolling 3-year period. During these periods, the MSCI World Quality Index produced average cumulative excess returns of 11.5%.
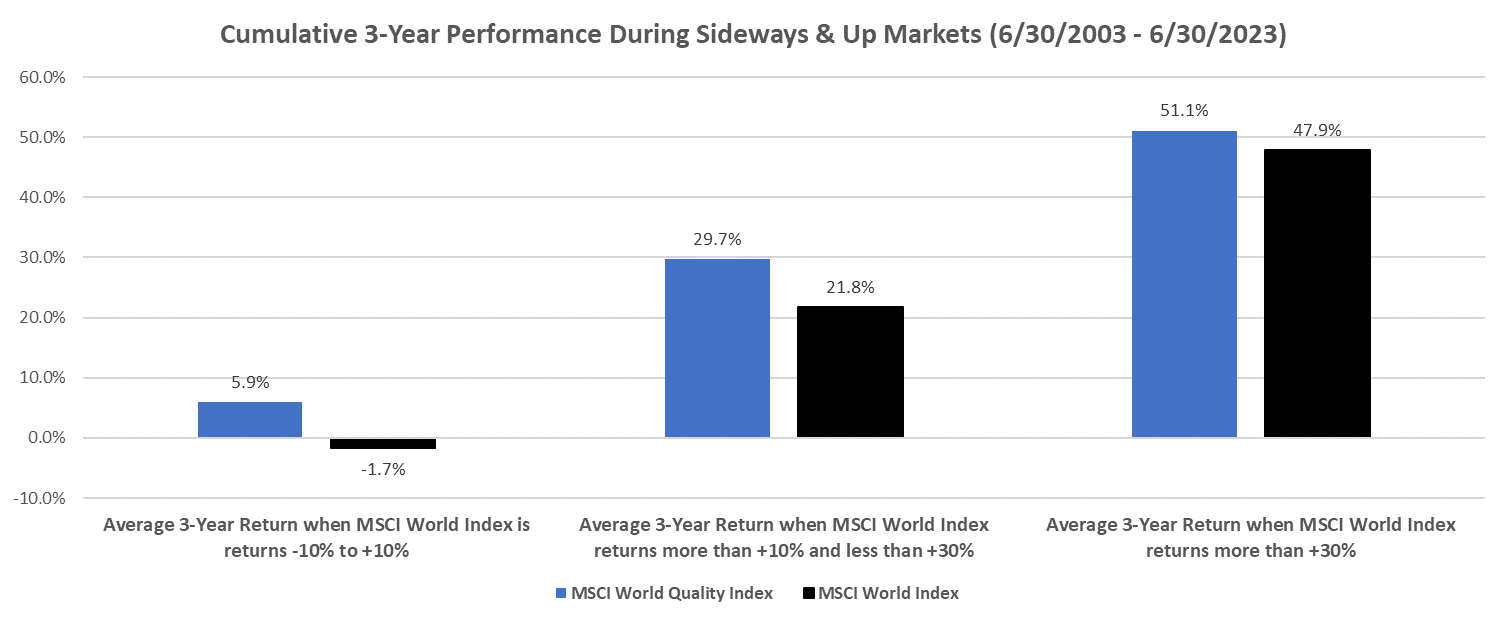
We also examined how the quality factor has performed during sideways markets, defined as 3-year periods where global equities produced cumulative returns of -10% to +10%1; upward trending markets, defined as 3-year periods where global equities produced cumulative returns between +10% to +30%2; and finally, robust markets, defined as 3-year periods where global equities produced cumulative returns greater than +30%3. We found that performance in these environments consistently favored the MSCI World Quality Index.
In 79 rolling 3-year periods where the MSCI World Index generated mixed results (-10% to +10%), the MSCI World Quality Index generated average cumulative excess returns of 7.6%. In the 300 rolling 3-year periods where the MSCI World Index generated returns of +10% to +30%, the MSCI World Quality Index generated average cumulative excess returns of 7.9%. Finally, in the 519 rolling 3-year periods where the MSCI World Index generated returns greater than 30% (evidence of the positive bias in market performance), the MSCI World Quality Index generated average cumulative excess returns of 3.2%. These results, especially during robust markets, are surprising, as most often, quality equities are assumed to lag in this type of environment.Still, they illustrate the power of compounding earnings growth over multi-year periods and how that ultimately drives value creation and share price appreciation.
Ultimately, this ability to outperform in down markets while participating or even outperforming in up markets has resulted in impressive long-term results. Since June 30, 2003, the MSCI World Quality Index has generated cumulative returns of 618%, while the MSCI World Index has generated cumulative returns of 397%1. These results, when married with the benefits of tax efficiency, may lead to better long-term outcomes for our clients, which is why we believe quality companies should be a core component of an investors’ equity allocation.
Prioritizing Time in the Market as Opposed to Timing the Market
Before turning to our security selection process, let’s take a step back and consider the role equities as an asset class serve in a portfolio. Equities are a primary engine for asset growth and real return for long-term investors. They provide exposure to global economic growth through revenues that generally follow nominal GDP growth, they generate earnings that ultimately create shareholder value, and they offer the potential for return of capital through dividends and buybacks. In exchange for a piece of this earnings growth and value creation, equity investors accept added risks relative to bondholders, which include increased price volatility and being the last to be repaid in the event of a default.
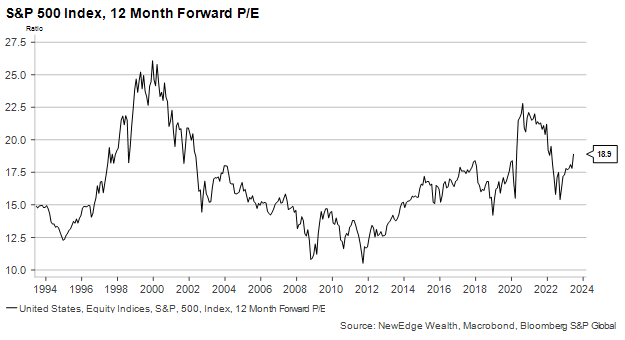
The value of current and future profits in today’s dollars is often labeled “net present value”; however, corporate share prices tend to deviate meaningfully from this measure in the short run, driven by supply and demand, investor sentiment, geopolitical events, and monetary and fiscal policies. The recent history of the S&P 500 Index price to earnings (P/E) ratio, which measures the price investors are willing to pay for a piece of corporate profits, illustrates these dislocations in price, with the ratio swinging from a low of 10x to a high of 26x over the last few decades.
Investors focused on market timing or pure fundamental security selection can try and generate excess returns (alpha) by timing these price dislocations or correctly forecasting industry trends and changes in multiples, although, as numerous studies have shown, it is extremely difficult to consistently generate this type of outperformance, especially once fees and taxes are included. Morningstar Research’s 2022 active management study illustrates this point, as they note just 13% of active large-cap mutual funds have outperformed their benchmarks over the past ten years. In addition, investors aiming to time investments in these strategies have underperformed the funds themselves by an additional 0.8% annually over the last ten years4. This is not to say that all active management is futile, but rather that the headwinds to timing the market and added tax consequences of a highly active approach make them better suited as surgical investments into inefficient markets or as a complement to core quality equity exposure.
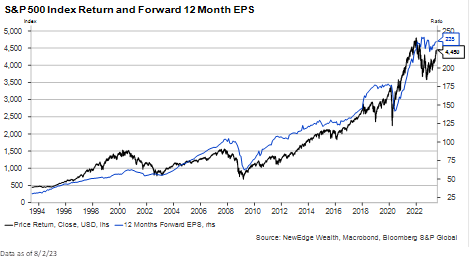
Our investing philosophy recognizes that while changes in valuations are difficult to predict, equity price performance ultimately follows the long-term trend rate of earnings growth. In fact, 98% of the S&P 500 Index total return over the past thirty years can be explained by earnings growth as the index has generated annualized total returns of 10.0%, and earnings have grown at a 9.8% annualized rate. With this in mind, we believe the best way to achieve consistent alpha is by prioritizing companies that can deliver durable earnings growth, which is something quality companies have proven to be highly effective at.
Defining Quality Companies
What makes a quality company? At NewEdge, we believe quality can be boiled down to a few key characteristics, which we will explore further below:
- Industry Leading Profitability
- Resilient Competitive Advantages
- Healthy Free Cash Flow Generation
- Exceptional Management Teams
- Attractive Relative Valuation
The Importance of Margins
The outperformance of quality companies comes down to their ability to deliver consistent compound earnings growth, and one of the dominant ways companies drive earnings growth is by maintaining and growing profit margins. As discussed above, earnings growth powers the vast majority of share price appreciation over the long term; however, what is often overlooked is that half of earnings growth is delivered through profit margin expansion. This is why measures of profitability are central to our quality approach. Companies that can drive margin expansion are in a better position to generate long-term earnings growth and ultimately create value.
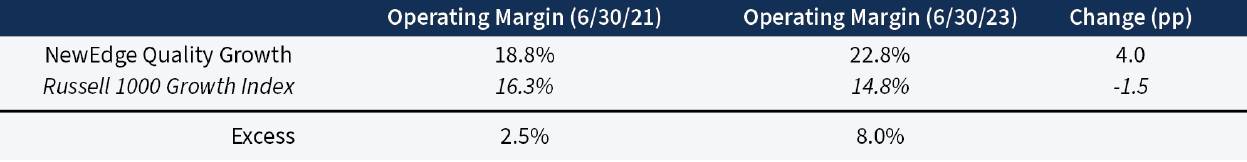
An example of this is evident in the operating margin of our Quality Growth portfolio. As the below illustrates, our portfolio holdings have generated margin expansion of 4 percentage points over the past two years, while the Russell 1000 Growth Index has seen margin contraction of 1.5 percentage points. Over this same period, the portfolio has generated annualized returns of 4.4% net of fees, while the index has generated annualized returns of 1.6%.
Profitability can be achieved through cost-cutting measures in the short term, but more sustainable long-term margin expansion is primarily a result of competitive advantages or a wide business moat (where a business has such a strong market presence that it is difficult for others to attack its market share), these are structural advantages that are supported by pricing power and efficient capital allocation.
Pricing power is the ability of a company to pass on price increases to consumers without a material impact on their volumes. This is often a result of high product quality, brand loyalty, high switching costs, or a concentrated industry. Efficient capital allocation is how well a company can generate income from its capital or resources. This capital efficiency is often a result of skilled management teams adept at reducing input costs, companies with unique access to productive talent or prized resources, or companies with economies of scale where the combination of growth and production efficiency results in lower cost per unit sold, creating a flywheel effect.
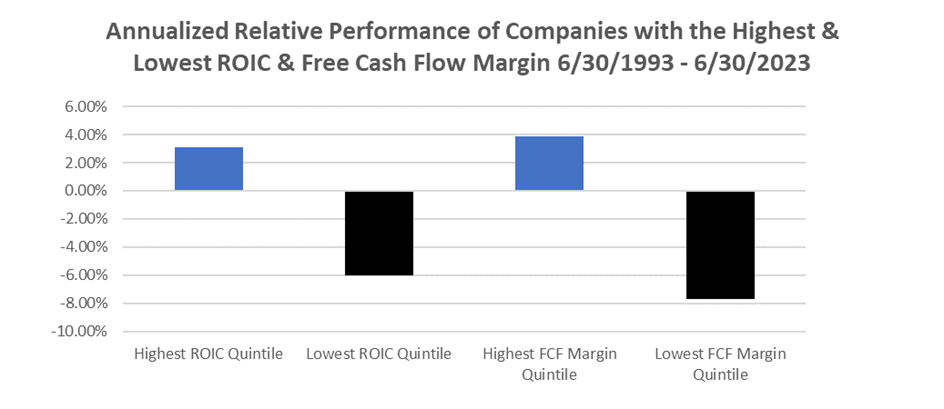
One way to measure competitive advantages is by looking at return on invested capital (“ROIC”). ROIC illustrates how effectively a company turns capital into profits, and it is calculated by dividing after tax operating profits by the total capital utilized by a company (equity and debt). It illustrates the amount of cash generated from each dollar of capital raised. Companies that can sustain high returns on invested capital often benefit from persistent competitive advantages and demonstrate capital efficiency. Our partners at Empirical Research have analyzed the relative performance of high and low ROIC companies, and they found that companies that consistently produce the highest ROIC have outperformed those that produced the lowest ROIC by 9% annually over the past three decades.
The next key quality characteristic we focus on is free cash flow (FCF). Free cash flow provides a more granular assessment of profitability, measuring how much cash a business generates from its sales over a certain period, and it is often viewed as a more transparent measure of net income or earnings. In its most simple form, free cash flow nets out all non-cash items from an income statement and then subtracts capital expenditures. Healthy and growing free cash flow generation and low accrual rates (the difference between reported earnings and free cash flow) can illustrate financial health and provide a high degree of financial flexibility for a company, which can be used for a wide range of shareholder value creation activities including reinvestments in organic growth, debt reduction, strategic M&A, and capital return to shareholders through dividends and buybacks.
Ultimately, free cash flow can drive long-term value creation while providing increased confidence in the overall quality of the business and the trajectory of earnings growth. Again, Empirical Research has analyzed the relative performance of high and low free cash flow margin companies, and they found that companies that maintain the highest FCF margins have outperformed those with the lowest FCF margins by over 11% annually over the past three decades.
How management decides to allocate free cash flow is an important measure of quality in our view. We prioritize companies with experienced management teams that are focused on maximizing shareholder value and incremental earnings per share growth. This often leads us to companies that are using free cash flow to reduce debt or reduce equity shares outstanding, which generates an attractive total yield to shareholders. In addition, skilled management teams are often efficient capital allocators, where surgical capital expenditures can have an outsized impact on top-line growth. Another byproduct of running a quality company is that these management teams do not have to look far for attractive investment opportunities, often seeing the highest return on free cash flow by investing in their own businesses.
The final characteristic we use to identify quality companies is valuation, which serves as an investment guiderail and helps us avoid distressed or highly speculative companies. When looking for quality businesses, we maintain a valuation disciplined approach focused on a company’s valuation relative to history and relative to its industry peers. The S&P 500 has eleven sectors and twenty-four industry groups, each of which has varying valuation premiums and discounts relative to the broader market, which may be structural in nature or may be driven by broader industry trends. By valuing companies relative to their sector and industry peers, we can isolate the highest quality companies within these groups and identify companies that could otherwise be obscured if we were evaluating them against the broader market.
When thinking about the broad valuation of quality companies, we are reminded of the saying, “You get what you pay for.” We would argue the characteristics of quality businesses and their ability to potentially deliver outperformance over full market cycles warrants a valuation premium. Fortunately for us, the inefficient nature of markets and short-term biases among many market participants provide ongoing opportunities to invest in quality companies at relatively attractive valuations. Our valuation disciplined approach is evident in the broad valuations of our portfolios, which have historically averaged price-to-earnings ratios that are a 20%+ discount to their benchmarks. This disciplined approach can help reduce our sensitivity to valuation compression, which tends to occur in the most expensive companies.
An Added Focus on Tax Efficiency
The last topic we want to cover is what could be the most important structural advantage of quality investing – the ability to invest with a long-term perspective and minimize taxable gains. Because quality companies can generate more consistent earnings growth due to the previously discussed characteristics, they tend to perform better during drawdowns during periods of economic turmoil and can be thought of as more all-weather businesses. This economic insulation allows investments to be held across market cycles, resulting in lower portfolio turnover and realized gains, allowing investors to capitalize on the dual powers of tax efficiency and compound investment growth. This is further enhanced by our active approach to tax mitigation, as throughout the year, we look to harvest short-term losses to offset any potential realized gains.
At NewEdge Wealth, we believe the advantages of quality companies make them a vital core component of an equity allocation, and the performance data corroborates this view. Our equity strategies are designed for the long-term horizons and tax circumstances of our sophisticated clients, yet our straightforward, data-driven approach allows them to be utilized by a wide range of investors. One of the core philosophies of our firm, and one aspect of the Edge in NewEdge, is harnessing the power of data, mathematics, and technology to seek to drive better outcomes. As our results have illustrated, this philosophy, when applied to investing, cuts straight through the day-to-day noise of markets, allowing our team to find potential value in high-quality businesses and ultimately build portfolios that can seek to deliver better outcomes for clients.
We will close with a quote from Aldo Gucci, whose focus on quality helped turn a small leather shop in Florence into one of the world’s most successful luxury brands – “Quality is remembered long after price is forgotten”. Corporate share prices and broad equity markets are unpredictable, yet because of their business characteristics, quality companies can offer some degree of predictability. Ultimately, we believe prioritizing high-quality businesses and capturing the benefits of tax-efficient growth may be the best way to achieve your long-term investment goals.
SOURCES
1 Bloomberg, S&P Dow Jones Indices as of Q1 2023
2 National Bureau of Economic Research of Q2 2022
3 Bloomberg. Data as of 6/30/2023
4 Morningstar Research Active / Passive Barometer Report as of 12/31/2023
Important Disclosures
NewEdge Wealth is a division of NewEdge Capital Group, LLC. Investment advisory services offered through NewEdge Wealth, LLC an investment adviser registered with the US Securities and Exchange Commission. Securities offered through NewEdge Securities, Inc. Member FINRA/SIPC.
These materials do not constitute an offer or solicitation in any jurisdiction to any person or entity. This communication is not intended to, and should not, form a primary basis for any investment decision.
Certain economic and market information contained herein has been obtained from published sources prepared by other parties, which in certain cases has not been updated through the date of the distribution of these materials. While such sources are believed to be reliable for the purposes used herein, NewEdge does not assume any responsibility for the accuracy or completeness of such information. Further, no third party has assumed responsibility for independently verifying the information contained herein and accordingly no such persons make any representations with respect to the accuracy, completeness or reasonableness of the information provided herein. Unless otherwise indicated, market analysis and conclusions are based upon opinions or assumptions that NewEdge considers to be reasonable.
NewEdge and its affiliates do not render advice on legal, tax and/or tax accounting matters to clients. Any investment, tax, marketing, or legal information contained herein is general and educational in nature and should not be construed as advice. Please consult your tax advisor for matters involving taxation and tax planning and your attorney for matters involving trusts, estate planning, charitable giving, philanthropic planning, and other legal matters.
The trademarks and service marks contained herein are the property of their respective owners. Unless otherwise specifically indicated, all information with respect to any third party not affiliated with NewEdge has been provided by, and is the sole responsibility of, such third party and has not been independently verified by NewEdge, its affiliates or any other independent third party. No representation is given with respect to its accuracy or completeness, and such information and opinions may change without notice.
Certain information contained in this piece constitutes “forward-looking statements,” which can be identified by the use of forward-looking terminology such as “may,” “will,” “should,” “expect,” “anticipate,” “project,” “estimate,” “intend,” “continue,” or “believe,” or the negatives thereof or other variations thereon or comparable terminology. Due to various risks and uncertainties, actual events, results, or the actual performance of investments may differ materially from those reflected or contemplated in such forward-looking statements. Nothing contained in this piece may be relied upon as a guarantee, promise, assurance or a representation as to the future.
Investing involves risk, including possible loss of principal. Past performance is no guarantee of future results.
Please remember that different types of investments involve varying degrees of risk, and there can be no assurance that the future performance of any specific investment or investment strategy (including those undertaken or recommended by NewEdge) will be profitable or equal any historical performance level(s). Clients should carefully consider their own investment objectives and never rely on any single chart, graph or marketing piece in making investment decisions.
Equity securities may fluctuate in response to news on companies, industries, market conditions and general economic environment. Investing in smaller companies involves greater risks not associated with investing in more established companies, such as business risk, significant stock price fluctuations and illiquidity. Stocks of medium-sized companies entail special risks, such as limited product lines, markets, and financial resources, and greater market volatility than securities of larger, more-established companies. Asset allocation and diversification do not assure a profit or protect against loss in declining financial markets.
Value investing does not guarantee a profit or eliminate risk. Not all companies whose stocks are considered to be value stocks are able to turn their business around or successfully employ corrective strategies which would result in stock prices that do not rise as initially expected.
Growth investing does not guarantee a profit or eliminate risk. The stocks of these companies can have relatively high valuations. Because of these high valuations, an investment in a growth stock can be riskier than an investment in a company with more modest growth expectations.
All data is subject to change without notice.
© 2023 NewEdge Capital Group, LLC
