


I’m sure in her you’ll find sanctuary
And the world, the world turns around
And the world and the world, the world drags me down
-“She Sells Sanctuary”, The Cult
The Technology sector seems to have it all going on these days.
Whatever the market narrative, Technology (Tech) appears to be the answer, offering sanctuary to investors in any scenario.
Expecting lower interest rates? Tech benefits from a boost to valuations from lower yields. Expecting an easier Fed? benefits from looser liquidity conditions. Expecting a recession? Tech benefits from its perceived safety and stability.
This narrative dominance has led to a monster run of outperformance for Tech: the S&P 500 Technology sector is +19.7% YTD vs. S&P 500 +5.5%.
Further, Tech, with its large weight in the S&P 500 (~25%), has been the key driver of S&P 500 performance year-to-date (YTD). Without the Technology sector performance, the S&P 500 would be up just +0.6% YTD.
But can Tech’s sanctuary status and performance dominance continue through 2023? To answer this, we’ll look at the source of recent Tech strength (spoiler: it’s all valuations) and the stability of Tech earnings power.
Tech’s YTD performance has been entirely driven by valuation multiple expansion. Tech’s forward Price to Earning (PE) multiple is +25% YTD to a whopping 25x forward earnings, while estimates for Tech earnings growth in 2023 have been cut from -2% to -8%.
At 25x, this equates to a 38% premium over the S&P 500, vs. a 5-year average of an 18% premium, and is actually an even greater premium than was ever reached during the COVID bubble/boom (the peak was 33% in December 2021). It’s hard to believe that before the “Powell Pivot” to easing in late 2018 (and when real yields were at a similar level to where they are today), Tech traded at just a 4% premium to the S&P 500.
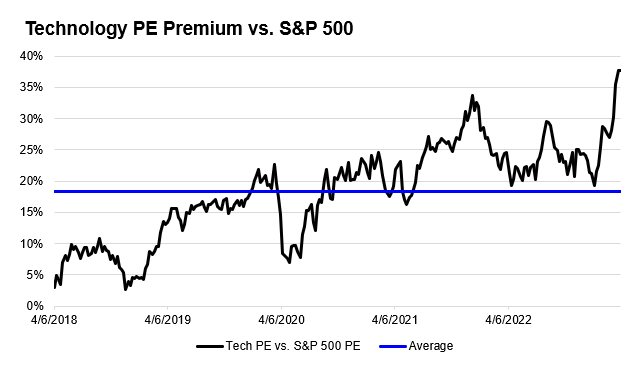
Source: Bloomberg, NewEdge Wealth, as of 3/31/23
There are two narratives that work to justify this valuation jump.
Easy Fed? Happy Tech?
The first narrative is that Tech multiples benefit from both falling interest rates and the prospect of an easier Fed. Tech has done well in prior times of falling yields and Fed easing (such as 2019-2021) and struggled during periods of rising yields and Fed tightening (such as 2022). If the Fed were to reverse course and begin easing, the market is betting that this will be beneficial to tech.
We have long discussed the relationship of Growth (Russell 1000 Growth Index) and Technology valuations with the level of real yields (nominal yields minus inflation). Lower real yields typically support higher valuations for these stocks/indices, while higher real yields typically push valuations lower.
We have seen real yields fall in 2023 (the 10 Year real yield has fallen from 1.6% to start the year to 1.19% today), but possibly not enough to justify the heights to which Tech valuations have jumped.
At 25x, Tech is now trading at a valuation level above its pre-pandemic peak in early 2020, when real yields were ~0% and on their way to -1% in response to unprecedented Fed easing.
This implies that Tech is already pricing in a fair amount of Fed easing.
If this hoped-for Fed easing does not materialize, we could expect renewed upward pressure on real yields, and thus downward pressure on Tech valuations.
Our conclusion on Tech valuations is that they are expensive and will likely struggle to push much higher from current levels unless we see a true shift to easing by the Fed. We see downside risk to Tech valuations if easing does not materialize and/or rates resume their ascent.
It is important to remember that 2022’s Tech underperformance was largely due to Tech valuations having further to fall than other parts of the market that were more reasonably valued (Tech EPS in 2022 was flat vs. the market +8%). Sometimes, valuation becomes a risk in and of itself.
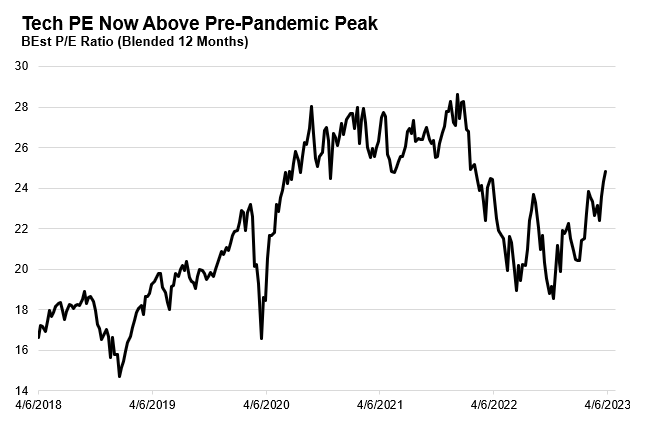
Source: Bloomberg, NewEdge Wealth, as of 3/31/23
Earnings Stability
This leads to the second narrative that is supportive for the recent jump in valuations, and that is Tech’s perceived earnings safety during times of economic stress.
As the table below shows, Tech has had better earnings performance during the past two recessions (COVID and the Great Financial Crisis).
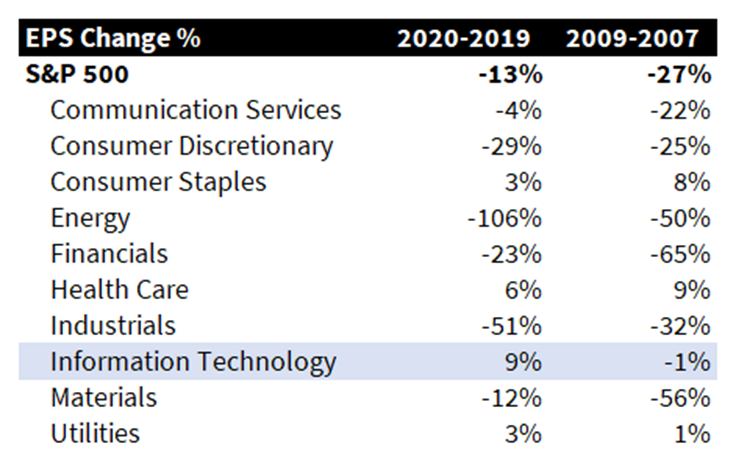
Source: Bloomberg, NewEdge Wealth
Note that the COVID recession was particularly unusual in that it was hugely beneficial to Tech because of the work-from-home dynamic that spurred huge Tech-related spending. We would expect the next “normal” recession to be less Tech-beneficial.
Also note that these COVID demand boosters likely caused many of these Tech companies to “pull-forward” future revenue growth by accelerating demand in 2020 and 2021.
Many companies over-earned and over-spent in the wake of COVID, which is why Tech has been the source of the majority of the recent layoff and restructuring announcements. This over-earning dynamic is also why Tech earnings for 2023 are forecasted to fall -8% (which, if it materializes, would be worse than the two years of the GFC!).
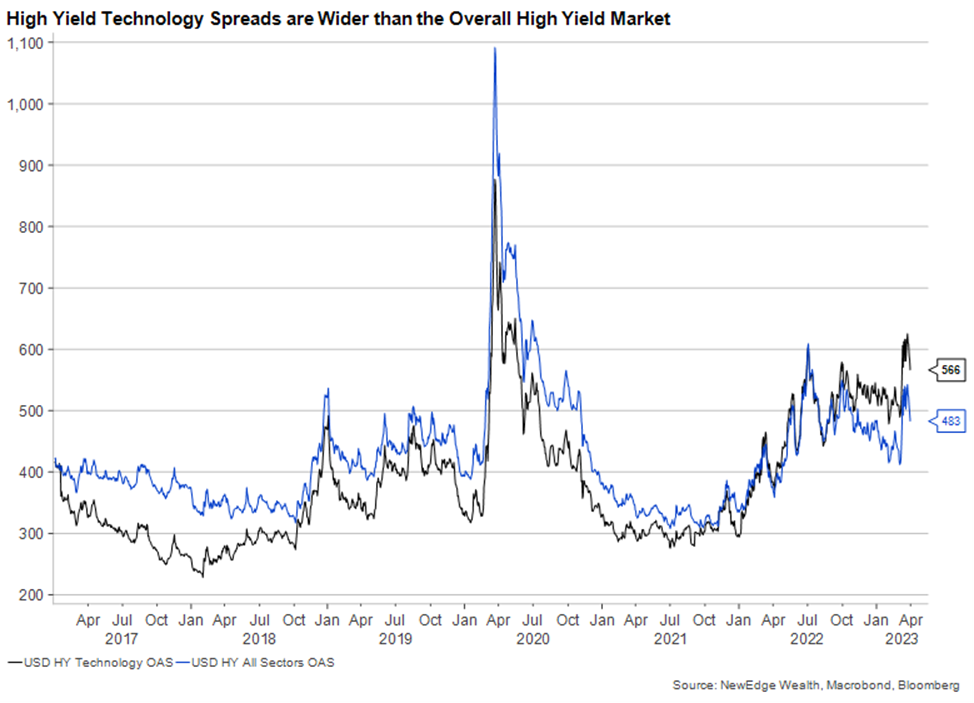
One item to watch is what the bond market is messaging about tech earnings risk. Currently, the spread of high yield Technology sector bonds is wider than the broader market, which could possibly reflect greater earnings risk for the lowest-quality Technology companies.
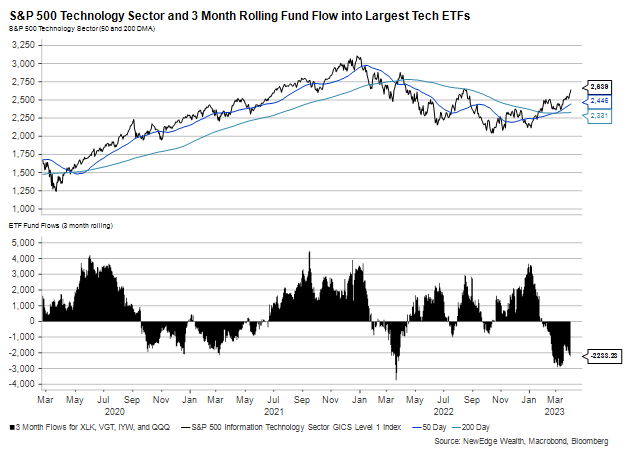
Positioning
One important point to add to this discussion is that Tech strength appears to be the “pain trade”, meaning that investors and traders are likely not positioned for Tech to be the leading sector in the market. The chart below shows the flows into the largest Tech sector ETFs (XLK, VGT, IYM), plus the QQQ NASDAQ ETF, which has a large tech weighting. Despite the rally in shares YTD, there have been sharp outflows from Tech ETFs (contrast this to huge inflows as traders chased the 2021 rally). These outflows do not appear to be driven by a meaningful jump in short interest in the sector either (short interest in tech ETFs remains below its 2022 peak).
Conclusion
Tech is expensive, but Tech has exhibited strong earnings stability in past periods of economic stress. Valuations look stretched on an absolute basis and relative to the market, but given light positioning and outflows from the sector, there could be room for Tech valuations to become even more extended in the short term as traders/investors capitulate and are drawn into the sector. If valuation continues to run, it could become a risk in and of itself, similar to 2022, while we expect Tech to continue to be sensitive to the future path of the Fed and interest rates (tighter Fed and higher rates is negative for Tech, while an easier Fed and lower rates is positive for Tech).
Top Points of the Week
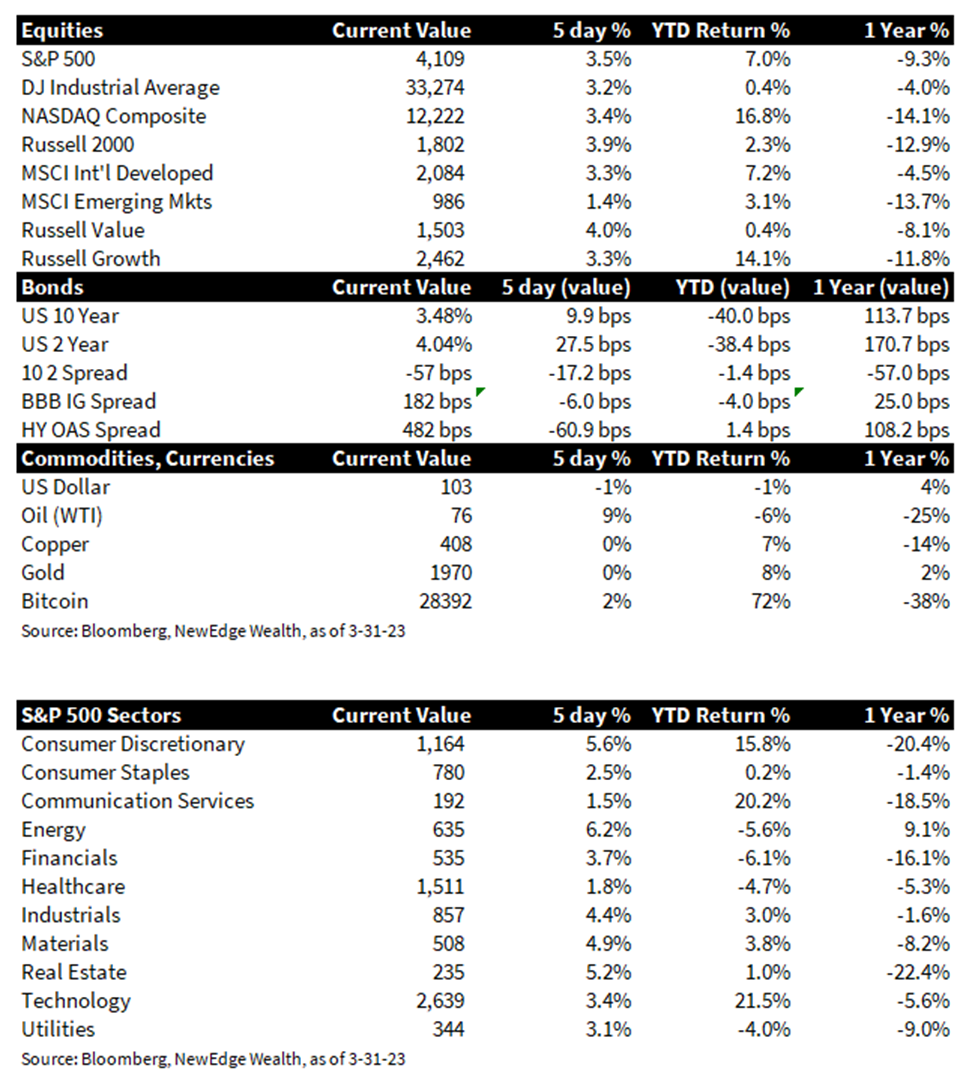
- Stocks End Quarter Strong: U.S. equity markets staged a strong rally for the week, with all indices posting similar gains. Emerging markets were the laggard on the week. The week’s best sector was Energy, helped by a 9% jump in crude oil prices, while the defensive Healthcare sector lagged.
- Higher Yields, Tighter Spreads: U.S. Treasury yields rose on the week, reflecting a calm or “sigh of relief” as no new banking issues materialized during the week. The 2-Year yield (most sensitive to Fed policy) rose faster than the 10-Year yield, causing the 10-2 Yield curve to invert further. Credit spreads tightening on the week, another sign of the risk-asset relief rally.
- Banking Update: With the sale of Silicon Valley Bank (SVB) concluded, and the First Republic challenges not publicly worsening, tensions in markets eased. The Fed’s balance sheet is now $350B larger in response to the banking issues. The Senate and House hearings of Silicon Valley and the role of the Federal Reserve and FDIC produced notable facts such as deposit redemptions at SVB reaching $100 billion on March 10th. The White House proposed new regulations for regional banks, whereas the Fed is looking into a revision of stress tests to include banks with assets between $100 and $250 billion.
- US Jobs Still Strong: Jobless claims for the week came in at 198k, with this reading now remaining below 200K for nearly 3 months.
- Inflation Eases, but Still Elevated: The core PCE inflation data for February came in slightly softer than expected (0.3% m/m vs. 0.4% expected) and the Year-over-Year (YoY) number fell to 4.6% vs. 4.7% prior. The Fed’s newly preferred gauge, the “super core PCE” which measures services prices excluding rent and housing, was higher at 4.65% YoY. One item to watch on the inflation front, rents have started increasing again with a 0.5% increase in March MoM in the Apartment List National Rent Report. This data will be important for core inflation metrics.
- Consumer Confidence Improves: The Conference Board’s Consumer Confidence Index rose to 104.2 in March vs. 103.4 in February. This rise was entirely due to a lift in future expectations, while consumers’ assessment of their current situation fell. There was also a slight uptick in one-year inflation expectations to 6.3%.
- Coming Up Next Week: The Institute of Supply Management releases its Purchasing Managers Indices for March, which will be closely watched to see if weakness in regional surveys will be reflected nationally. Labor data will be in focus, with Jobs Day on Thursday. Non-farm payrolls are expected at 240K, down from 311K last month, while the Unemployment rate is expected to remain flat at 3.6%.
IMPORTANT DISCLOSURES
Abbreviations:
EPS: Earnings per Share; FDIC: Federal Deposit Insurance Corporation; GFC: Great financial crisis; PE: Price to Earnings Ratio, the ratio of share price of a stock to its EPS; Powell: Jerome Powell, Chair of the Board of Governors of the Federal Reserve System.
Index Information:
All returns represent total return for stated period. S&P 500 is a total return index that reflects both changes in the prices of stocks in the S&P 500 Index as well as the reinvestment of the dividend income from its underlying stocks. Dow Jones Industrial Average (DJ Industrial Average) is a price-weighted average of 30 actively traded blue-chip stocks trading New York Stock Exchange and Nasdaq. The NASDAQ Composite Index measures all NASDAQ domestic and international based common type stocks listed on the Nasdaq Stock Market. Russell 2000 is an index that measures the performance of the small-cap segment of the U.S. equity universe. MSCI International Developed measures equity market performance of large, developed markets not including the U.S. MSCI Emerging Markets (MSCI Emerging Mkts) measures equity market performance of emerging markets. Russell 1000 Growth Index measures the performance of the large- cap growth segment of the US equity universe. It includes those Russell 1000 companies with relatively higher price-to-book ratios, higher I/B/E/S forecast medium term (2 year) growth and higher sales per share historical growth (5 years). The Russell 1000 Value Index measures the performance of the large cap value segment of the US equity universe. It includes those Russell 1000 companies with relatively lower price-to-book ratios, lower I/B/E/S forecast medium term (2 year) growth and lower sales per share historical growth (5 years). The BBB IG Spread is the Bloomberg Baa Corporate Index that measures the spread of BBB/Baa U.S. corporate bond yields over Treasuries. The HY OAS is the High Yield Option Adjusted Spread index measuring the spread of high yield bonds over Treasuries.
Sector Returns: Sectors are based on the GICS methodology. Returns are cumulative total return for stated period, including reinvestment of dividends.
The views and opinions included in these materials belong to their author and do not necessarily reflect the views and opinions of NewEdge Capital Group, LLC.
This information is general in nature and has been prepared solely for informational and educational purposes and does not constitute an offer or a recommendation to buy or sell any particular security or to adopt any specific investment strategy.
NewEdge and its affiliates do not render advice on legal, tax and/or tax accounting matters. You should consult your personal tax and/or legal advisor to learn about any potential tax or other implications that may result from acting on a particular recommendation.
The trademarks and service marks contained herein are the property of their respective owners. Unless otherwise specifically indicated, all information with respect to any third party not affiliated with NewEdge has been provided by, and is the sole responsibility of, such third party and has not been independently verified by NewEdge, its affiliates or any other independent third party. No representation is given with respect to its accuracy or completeness, and such information and opinions may change without notice.
Investing involves risk, including possible loss of principal. Past performance is no guarantee of future results.
Any forward-looking statements or forecasts are based on assumptions and actual results are expected to vary from any such statements or forecasts. No assurance can be given that investment objectives or target returns will be achieved. Future returns may be higher or lower than the estimates presented herein.
An investment cannot be made directly in an index. Indices are unmanaged and have no fees or expenses. You can obtain information about many indices online at a variety of sources including: https://www.sec.gov/answers/indices.htm.
All data is subject to change without notice.
© 2026 NewEdge Capital Group, LLC

