


Weekly Summary: July 4 – July 8, 2022
Key Observations:
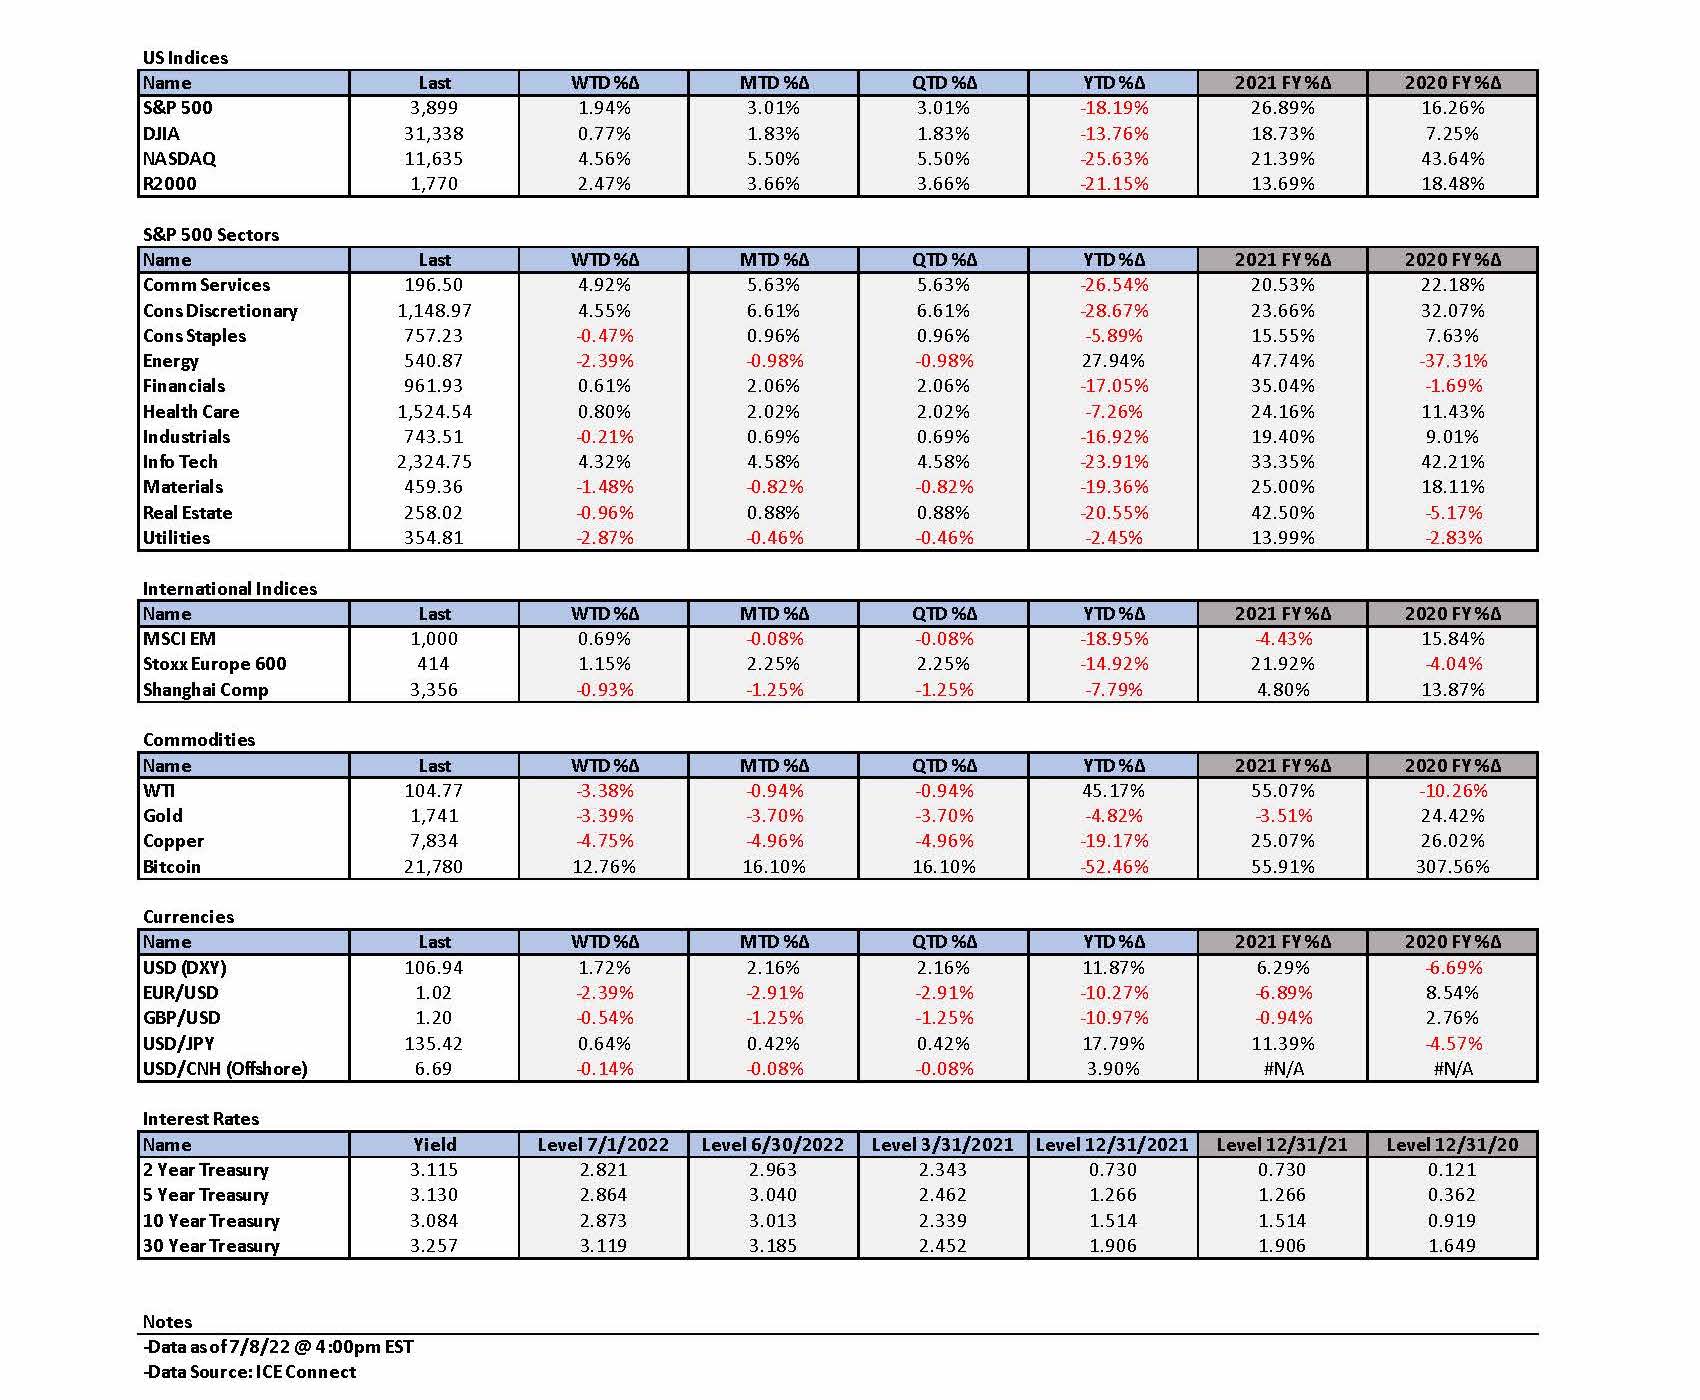
- In general, the financial markets continued to reflect increasing risks of a recession over the next year. Weakening commodity prices and lower interest rates before their turnaround were reflective of recession concerns. U.S. consumer consumption was sluggish in June. Inflation measures remained elevated.
- U.S. headline manufacturing and services purchasing managers’ indexes (PMIs) dropped but remained expansionary. New orders and employment measures were in contractionary territory for June manufacturing surveys. Higher interest rates appeared to hurt demand. Employment measures also contracted in services PMI. Services new orders decreased but remained expansionary.
- Job Openings and Labor Turnover Survey (JOLTS) data indicated a drop in job vacancies, which remained very elevated and continued to reflect a very tight U.S. labor market.
- Consumer confidence measures focused on future conditions continued to deteriorate. U.S. mortgage demand contracted, showing that higher rates were having the Fed’s desired effect of reducing demand and alleviating inflationary pressures.
The Upshot: Early this week, the U.S. dollar (USD) as measured by DXY decisively broke through May 12 levels. The euro was especially weak versus USD. We previously thought that the DXY top of May 12 would not be violated for a longer time period. We will try to anticipate a DXY top that will be longer lasting. We remain of the opinion that the next “big” move in USD will be lower eventually. In the meantime, it looks like USD will continue to strengthen. We believe that USD will begin to weaken when global economic growth expands relative to U.S. growth. Many large U.S. companies, especially tech companies, have large overseas exposures and the overall corporate earnings of these companies will be adversely affected when their foreign earnings are translated back into USD. We are not too concerned about this short-term negative effect since financial markets tend to discount such effects more than earnings “misses” due to other factors. We also suppose that USD will eventually weaken at some point, hopefully in the not-too-distant future.
We still expect the S&P 500 to reach a more sustainable bottom in the 3,400-3,500 area if there is no U.S. recession, and to trade lower if there is a recession within the next year. We have consistently highlighted that circumstances have been prone to very rapid and often surprising changes since early 2020. The rapidity of change has been particularly acute since Russia’s invasion of Ukraine on February 24. The Russia-Ukraine war (war), along with repercussions from China’s “dynamic zero COVID-19 policy,” has increased exponentially the number of variables that have made any forecasting very challenging.
Most recently, we have favored growth stocks and in particular high quality tech stocks, along with our continuing preference for selected health care stocks. We recently have favored also biotech stocks in particular that have been trading much more favorably since mid-June. Perhaps Merck’s potential $40 billion acquisition of a biotech company disclosed this week will solidify the recent trend. We continue to favor selected energy stocks at the depressed levels reached early this week, given that we remain favorably disposed to the energy sector because of the underinvestment in energy for many years and the structural changes that now favor renewable energy. Our comfort level for energy stocks will diminish quickly once the war ends. We wish to emphasize that these have been our preferred sectors for long-term investors and/or traders recently. But since we don’t think we have reached a sustainable stocks bottom, it is likely that many of the stocks that have rebounded recently will once again trade lower. These are the sectors where we will continue to look for opportunities to buy selected stocks on any downturns. For those investors willing to live with the risk of continued financial market volatility and downturns, we trust that longer term investors will be rewarded eventually.
We still are waiting for downward revisions of earnings and margins for many companies. We believe that financial market volatility will persist for at least as long as the war endures. In general, we continue to favor big cap high-quality stocks with strong balance sheets, as well as relatively stable cash flows and margins. We also favor at least some commodity exposure in a diversified portfolio.
“Puzzling” Times
Since early 2020, the world has been bombarded by the COVID-19 pandemic, lockdowns, supply chain issues, elevated inflation, the Russia-Ukraine war, repercussions related to Russian sanctions, tightening monetary policies by many central banks (CBs), recession concerns, great volatility in financial markets and commodity markets, one of the worst first halves of any year with regard to losses in equities and fixed income returns, extreme losses for many investors, etc. The confluence of all these “calamities” in such a short time almost makes it seem like the “Devil” played a role and wanted to ensure we noted his presence and make it feel like he wanted to “meet” us. The lyrics of The Rolling Stones’ song “Sympathy for the Devil,” written by Mick Jagger and Keith Richards and first performed in June of 1968, came to mind in this context. “Please to meet you; Hope you guess my name; But what’s puzzling you; Is the nature of my game.” Needless to say, many people have been “puzzled” by these many uncertainties and many variables. We can also assure you that if we met “him,” we would not “have some courtesy” or “some sympathy.”
We have striven to make sense of the many “puzzling” aspects of the events over the past two years. The many variables and their seemingly endless proliferation have made this a challenging environment to decipher. Like the Federal Reserve, we remain “data dependent” in our approach to interpreting the current environment. What does the recent data convey to us?
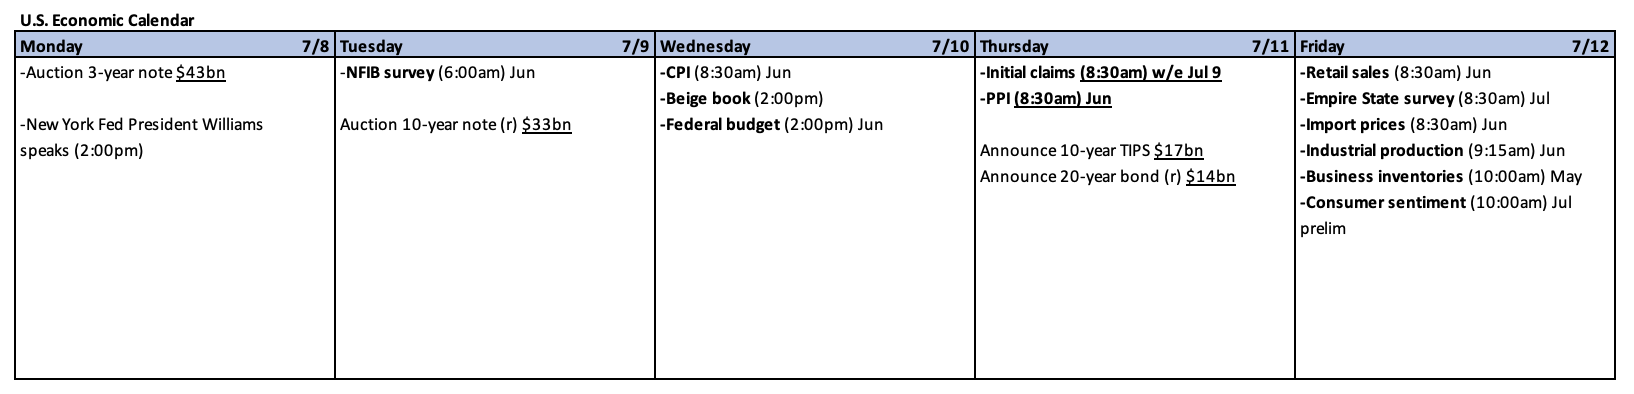
BLS U.S. June Nonfarm Payroll Employment Report
The Bureau of Labor Statistics (BLS) released the better-than-expected June nonfarm payroll employment report on Friday. This report showed a gain of 372,000 jobs added in June versus an expected gain of 250,000. Private payrolls increased by 381,000. May and April gains were revised lower by a combined total of 74,000 jobs. The unemployment rate remained constant at 3.6% for the fourth consecutive month. Average hourly earnings rose 0.3% m/m for the third consecutive month and were 5.1% higher y/y, down from an upwardly revised 5.3% in May. The labor force participation rate remained at a low level of 62.2%, slightly below May’s level of 62.3% and substantially below the pre-pandemic February 2020 level of 63.4%. Needless to say, there is nothing in this employment report that would reflect any recession in sight. The tight labor market continues to be “puzzling” in light of the many indications of a weakening economy that we highlight in the remainder of this commentary. This includes measures of employment in PMI reports that indicate employment levels were contracting in June. Looks like the Devil continues to keep us “puzzled.” Interest rates rose after the release of this report. The major U.S. stock indexes initially dropped before recovering.
Increasing Probabilities of Recessions
As we have highlighted in recent commentaries, financial markets have been increasingly reflecting the rising probabilities of recessions in the U.S. as well as many other countries. The recent severe downturn in oil prices and many other commodity prices seem to be the latest victims of recession concerns. Before the dramatic reversal higher in Treasury yields on Wednesday of this week, the recent fixed income market was increasingly subject to recession concerns as well.
Elevated Inflation
Most recent inflation rates continued to show very high readings. The headline Eurozone inflation rate for June released late last week was a record high 8.6% year-over-year (y/y) versus 8.1% for May. Spain’s inflation rate was over 10%. Also released last week in the U.S., the Fed’s preferred measure of inflation, the Personal Consumption Expenditures Price Index (PCE inflation) for May showed continued elevated levels of inflation. The headline PCE inflation rate rose 6.3% y/y and the core increase, which excludes food and energy, was 4.7% y/y. Headline PCE inflation was the same in April, down from the recent March peak of 6.6%. The core rate of PCE inflation has shown a more clearly delineated downtrend from the February peak of 5.3% down to 4.9% in April before its lower May rate. The headline PCE May inflation readings incorporated an increase of 35.8% y/y for energy prices and an 11.0% increase for food prices.
Sluggish U.S. Consumer Spending
U.S. disposable personal income increased 0.5% in May, while personal consumption expenditures (PCE) increased 0.2%. But Real PCE decreased 0.4% – goods decreased 1.6% m/m and services increased 0.3%. We assume that inflation has finally begun to take its toll on U.S. consumer spending. On July 1, J.P. Morgan (JPM) indicated that its Chase credit card data “pointed” to sluggish spending in June and that real disposable income was 1.9% lower this year through May. JPM also observed that 35% of households recently reported difficulty in paying their bills, 10% more than a year ago. Mostly due to such signs of increasing consumer weakness, JPM decreased their U.S. Q2 GDP tracking estimates from their prior estimate of 2.5% to 1.0% and their estimate was lowered from 2.0% to 1.25% for the second half of 2022. The JPM downwardly revised estimates are a very good example of how rapidly circumstances and estimates can change. We expect rapidity of changed circumstances and forecasts to become increasingly apparent and to the surprise of many analysts and investors.
U.S. PMI Manufacturing Survey
The Institute for Supply Management (ISM) June U.S. manufacturing survey was released July 1. This headline index decreased from 56.1 in May to 53.0 and was below expectations of 54.9. The June survey indicated the slowest growth in U.S. factory activity since June 2020. New orders contracted for the first time in about two years to 49.2, versus 55.1 in May and employment also continued to contract – 47.3 versus 49.6 in May. The survey indicated that higher interest rates were beginning to hurt demand, much like the Fed desires. The S&P global U.S. manufacturing PMI showed similar findings. The headline index declined from 57.0 in May to 52.7, its lowest level since July 2020, as future output expectations dropped to their lowest level since October 2020. Both domestic and foreign demand declined as the fall in foreign client demand was the quickest since June 2020. Although supply chain issues remained a major concern, there were signs of easing in supply chain delays as pricing pressures declined to a still very elevated level.
EU, UK PMI Manufacturing Surveys and PMI Commodity Prices and Supply Indicators
The S&P Global June European (EU) manufacturing survey showed similar trends to those of the U.S. The headline index was 52.1 – lowest since August 2020 – versus 54.6 in May. Production levels contracted for the first time in two years, which indicated worsening conditions for goods producers. Business confidence fell to a 25-month low. Backlogs of work fell for the first time in almost two years as companies “focused on completing unfilled orders due to falling demand.” The United Kingdom manufacturing PMI also indicated a June slowdown as business confidence fell to its lowest level in over two years, and new orders fell for the first time since January 2021. The S&P Global PMI commodity prices and supply indicators showed that commodity pressures continued to ease as global price pressures eased to the “softest” level in one-and-a-half years. Reports of supply shortages eased to a 17-month-low and freight capacity improved.

Source: S&P Global, UK manufacturing slowdown continues as business optimism dips to lowest level in over two years (7/1/2022)


Source: S&P Global, Commodity price and supply pressures continue to ease (7/1/2022)
U.S. Factory Orders
In contrast to the new orders decrease at factories reported by the June manufacturing PMIs referred to above, the latest U.S. factory orders increase of 1.6% m/m in May reported by the Census Bureau was more than expected, as well as higher than the 0.7% increase for April, which was revised higher by 0.4%. Of course there is an easy explanation for this apparent discrepancy. The Census Bureau figures were for May while the PMI numbers are for June. We expect the June factory orders to align more fully with the PMI figures next month. Manufacturing activity accounts for about 12% of the U.S. economy. Robust business spending on equipment helped to bolster domestic spending on goods through May.
Treasury Yields’ Upward Reversal
The more dramatic impact on financial markets was the release of the better-than-expected U.S. June ISM services data midweek along with the better-than-expected JOLTS. These releases prompted a dramatic upward reversal in Treasury yields and for the two-year-to-10-year yield curve to invert more as the two-year yield rose faster than the 10-year yield. These releases were followed by the release of the minutes of the Federal Open Market Committee’s (FOMC) June 14-15 meeting. Treasury yields continued to increase the next day, which accompanied significant equity gains that day. Yields continued to rise after the release by BLS of the better-than-expected U.S. June nonfarm payroll employment report. The inversion of the 2-10 year yield spread became more pronounced.
U.S. PMI Services Survey
The U.S. June ISM services index declined less than expected to 55.3 – lowest since May 2020 – versus a median forecast of 54.0 and May’s reading of 55.9. The reading in March was 58.3 and was close to 70 late last year. We consider this a “mixed” report. The business activity sub-index increased 1.6% m/m, but new orders declined 2.0% to 55.6, and the employment component declined 2.8% to 47.4, which was contractionary. New export orders decreased 3.4% to 57.5 and prices paid decreased 2.0% to 80.1. Marking their first decline since January 2022, inventories contracted from 51 in May to 47.5. Inventories were deemed to be too low and insufficient for current business requirements. This report referred to an outlook that remained “challenging” due to “logistical challenges” that included a “restricted” labor pool, inflation, the coronavirus pandemic and the war.
The S&P Global June U.S. Services PMI was somewhat weaker than the ISM survey. The headline in this survey reached its weakest level since January 2022 and declined from May’s level of 53.4 to 52.7. New orders declined for the first time since July 2020. Business confidence for the year ahead dropped to a 21-month low. Rising wages continued to play a role in rising input costs.


Source: J.P. Morgan, US: ISM services survey cools, but beats expectations (7/6/2022)
EU PMI Composite Survey
The S&P Global EU June composite PMI output index slumped from 54.8 in May to 51.9 in June. The forward-looking indicators of new orders and business expectations gauges “pointed” to a falling output in coming months. Weakness was principally in the manufacturing sector as order book volumes declined sharply. But services firms reported significant weakening of demand growth. Tourism and recreation saw a notable slowdown in June. Financial categories also showed a sharp “drop-off” in demand. Pharmaceuticals were the best performer.

Source: S&P Global, Weaker trends in output and new orders seen across majority of European sectors in June (7/6/2022)
JOLTS – Job Openings
The U.S. JOLTS data for May showed a decline of 427,000 job openings from an upwardly revised April level of 11.68 million to 11.254 million versus median expectations of 11 million. The Labor Department counted 5.95 million people as unemployed, meaning that there were approximately 1.9 job vacancies for every unemployed person. The Quits rate declined only slightly but remained at very elevated levels. The hiring and layoff rates were flat at 4.3% and 0.9%, respectively. There were 440,000 fewer Americans working now than there were in February 2020. This data continued to reflect a very tight U.S. labor market. The decrease in total job openings was principally due to a 325,000 decrease in professional and business services vacancies and a 208,000 decrease in manufacturing vacancies.


Source: J.P. Morgan, US: JOLTS data stay strong even with recent moderation (7/6/2022)
Fed Minutes of June 14-15 Meeting
The Fed minutes of their mid-June meeting were as expected. There was nothing in the minutes to dissuade us from our conviction of the Fed’s resoluteness to rein in inflation. Given the increased focus of analysts and investors of the increasing risks of a U.S. recession over the next year, it was notable that the word recession was not even mentioned. The Committee (FOMC) made it abundantly clear that they will remain data dependent and flexible in their approach. Participants remarked that “future policy tightening would depend on incoming data and the evolving outlook for the economy.” Participants also “judged” that an increase of 50 or 75 basis points would be likely “appropriate” at the next meeting. Participants observed that some measures of inflation expectations had moved up recently and many participants noted that it would be more “costly” to bring inflation back down to the Fed’s 2% target if inflation expectations became “unanchored”. “Many participants judged that a significant risk now facing the Committee was that elevated inflation could become entrenched if the public began to question the resolve of the Committee to adjust the stance of policy as warranted.” The participants “saw the return of inflation to 2% as critical to achieving maximum employment on a sustained basis.” This is why the Fed recently highlighted their focus on headline inflation that includes energy and food prices because that is largely determinative of consumer inflation expectations. Gasoline prices are especially important in this regard as most consumers see these prices every day. This is why we anticipated the importance of headline inflation numbers for CBs before the Fed even mentioned this new focus. Another particularly important aspect of these minutes was that “participants concurred that the economic outlook warranted moving to a restrictive stance of policy.” The minutes suggested that the Committee would be “well positioned to determine the appropriate pace of further policy firming” once they reached these higher policy rates later this year. It is statements like these that increase our conviction that the Fed will raise the federal funds rate by 75 basis points (bps) at its July meeting. It is the Fed’s contention that they need to get to at least a slightly restrictive rate before they can more effectively judge future policy changes.
Drop in Mortgage Demand and Rising Housing Inventory
An example of how the Fed’s increasing rates were already dampening demand to help rein in inflation was the 5.4% drop in mortgage demand this week when compared to last week, as disclosed by CNBC on July 6. Home purchase applications fell 4% over this past week and 17% y/y. These decreases were recorded even as 30-year fixed rate mortgage rates decreased by at least 24 bps in the past two weeks. The Realtor.com June report showed for sale housing inventory increasing at a record rate of 18.7% y/y. But even with this housing inventory record increase in June, there were still 53.2% fewer homes for sale when compared to June 2019. Circumstances continue to evolve at a very rapid pace.
Consumer Confidence Continues to Deteriorate
The latest data continued to show a deterioration in consumer confidence. Released last week, the Conference Board’s June consumer confidence headline level dropped 4.5 points to 98.7, which was the lowest level since February 2021. The expectations index was the principal reason for most of the decrease of the headline number as the expectations reading dropped to 66.4 from the previous month’s level of 73.7. The expectations component was the lowest reading since March 2013. The Director of Economic indicators at the Conference Board summarized this latest survey: “Consumers’ grimmer outlook was driven by increasing concerns about inflation, in particular rising gas and food prices. Expectations have now fallen well below a reading of 80, suggesting weaker growth in the second half of 2022 as well as a growing risk of recession by year end.” As reported by CNBC on July 5, the July Sentix Economic Index that was released on July 4 showed the lowest “morale” across the 19 country Eurozone since May 2020. The latest reading of -26.4 was well below the expected level of -19.9. This survey depicts the views of approximately 2,000 analysts and institutional investors in EU.
China’s Economy Expands in June
In stark contrast to the PMIs of the U.S. and EU, China’s June services and manufacturing PMIs showed an expanding economy for the first time since February 2022. This was true for both the Caixin unofficial PMIs as well as the official PMIs published by China’s National Bureau of Statistics (NBS). The PMI services increases were especially dramatic as COVID-19 restrictions were lifted in many Chinese cities. The official services PMI rose from 47.8 in May to 54.7 in June, which was the strongest growth since May 2021. The Caixin June services PMI experienced its fastest growth since July 2021 and rebounded from 41.4 in May to 54.5 in June. The June expansion in China’s economy is encouraging for global growth. However, unfortunately the Chinese economic growth must be tempered by the continuing possible future lockdowns in China due to its “dynamic zero-COVID-19.” We interpret the “dynamic” part of this policy as mass testing in lieu of a full lockdown. According to CNN on July 6, the city of Xi’an and its 13 million residents was partially shut down that day by 18 infections from the new BA 5.2 Omicron sub-variant. This variant appears to escape antibody responses both from people who were previously infected, as well as from fully vaccinated and boosted people. Many experts seem to be worried increasingly about this new variant. Shanghai began testing all residents in nine out of the city’s 16 districts and parts of three other districts this week after the recent discovery of 24 new infection cases. President Xi Jinping continued to voice his support for his dynamic zero-COVID-19 policies last week in a speech in Wuhan, where the first coronavirus infection was reported, stating that it was better to incur “temporary” economic costs than to “harm the lives and health of people.”


Source: J.P. Morgan, China monthly data outlook: Growth recovery broadens out as Omicron drag fades (7/5/2022)
Bottom Line
We assume continued volatility across virtually all financial markets for at least as long as the Russia-Ukraine war persists. We believe that many financial markets have priced in at least partially increased probabilities of potential stagflation and/or recession. The trends in much of the data depicted this week in our commentary increase the risks for a recession over the next year in our opinion. The rapidity of changes in circumstances cannot be overestimated. We will remain “data dependent” in our investment approach and will try to maintain an “open mind.” We will not hesitate to change our views if incoming data warrant any changes.
The BLS employment report does not appear consistent with much of the data highlighted in this week’s commentary which otherwise generally shows a weakening economy and increasing risks of a recession. We can add this inconsistency to the many “puzzling” aspects to the current investment environment. After all, keeping us “puzzled” is the “nature” of the Devil’s “game.”
In the Upshot we indicated our favored sectors for selected purchases on market downturns. We are hopeful that selected purchases in these sectors will outperform on a relative basis. We suppose that equities have not found a sustainable bottom. We are still waiting for analysts’ revisions that would lower earnings projections and would anticipate margin compression.
Our fundamental investment approach for long-term investors remains the same as expressed in our recent commentaries. We maintain our preference for large-cap, high-quality stocks in a diversified portfolio with at least some commodity exposure.
Definitions
Dollar Index (DXY) – The U.S. dollar index (DXY) is a measurement of the dollar’s value relative to six foreign currencies as measured by their exchange rates. Over half the index’s value is represented by the dollar’s value measured against the euro. The other five currencies include the Japanese yen, the British pound, the Canadian dollar, the Swedish krona, and the Swiss franc.
The Job Openings and Labor Turnover Survey (JOLTS) – JOLTS tells us how many job openings there are each month, how many workers were hired, how many quit their job, how many were laid off, and how many experienced other separations (which includes worker deaths). The quits rate is the number of quits during the entire month as a percent of total employment
Federal Open Market Committee (FOMC) – The Federal Open Market Committee (FOMC) is the branch of the Federal Reserve System that determines the direction of monetary policy specifically by directing open market operations. The committee is made up of 12 members: the seven members of the Board of Governors; the president of the Federal Reserve Bank of New York; and four of the remaining 11 Reserve Bank presidents on a rotating basis.
Federal Funds Rate – The term federal funds rate refers to the target interest rate set by the Federal Open Market Committee (FOMC). This target is the rate at which the Fed suggests commercial banks borrow and lend their excess reserves to each other overnight.
PCE Price Index (headline) – The PCE Price Index uses the personal consumption expenditures component of the Personal Income and Outlays report to derive the PCE Price Index, which is the third major component of Personal Income and Outlays showing how prices are periodically inflating or deflating.
Core PCE inflation – The “core” PCE price index is defined as personal consumption expenditures (PCE) prices excluding food and energy prices. The core PCE price index measures the prices paid by consumers for goods and services without the volatility caused by movements in food and energy prices to reveal underlying inflation trends.
ISM Manufacturing Index (PMI) – The ISM manufacturing index, also known as the purchasing managers’ index (PMI), is a monthly indicator of U.S. economic activity based on a survey of purchasing managers at more than 300 manufacturing firms. It is considered to be a key indicator of the state of the U.S. economy.
ISM Services PMI – The ISM Services PMI, also known as the ISM Non-Manufacturing Index, is an economic index based on surveys of more than 400 non-manufacturing firms’ purchasing and supply executives.
S&P 500 – The S&P 500 is a total return index that reflects both changes in the prices of stocks in the S&P 500 Index as well as the reinvestment of the dividend income from its underlying stocks.
IMPORTANT DISCLOSURES
The views and opinions included in these materials belong to their author and do not necessarily reflect the views and opinions of NewEdge Capital Group, LLC.
This information is general in nature and has been prepared solely for informational and educational purposes and does not constitute an offer or a recommendation to buy or sell any particular security or to adopt any specific investment strategy.
NewEdge and its affiliates do not render advice on legal, tax and/or tax accounting matters. You should consult your personal tax and/or legal advisor to learn about any potential tax or other implications that may result from acting on a particular recommendation.
The trademarks and service marks contained herein are the property of their respective owners. Unless otherwise specifically indicated, all information with respect to any third party not affiliated with NewEdge has been provided by, and is the sole responsibility of, such third party and has not been independently verified by NewEdge, its affiliates or any other independent third party. No representation is given with respect to its accuracy or completeness, and such information and opinions may change without notice.
Investing involves risk, including possible loss of principal. Past performance is no guarantee of future results.
Any forward-looking statements or forecasts are based on assumptions and actual results are expected to vary from any such statements or forecasts. No assurance can be given that investment objectives or target returns will be achieved. Future returns may be higher or lower than the estimates presented herein.
An investment cannot be made directly in an index. Indices are unmanaged and have no fees or expenses. You can obtain information about many indices online at a variety of sources including: https://www.sec.gov/answers/indices.htm.
All data is subject to change without notice.
© 2026 NewEdge Capital Group, LLC

