

Weekly Summary: January 16 – 20
Key Observations:
- We believe that this week’s trading in U.S. financial markets was illustrative of the markets’ shifting focus between inflation and interest rate concerns on the one hand and slowing economic concerns and possible recession risks on the other. This was especially true on Wednesday when Fedspeak remained hawkish even as some disappointing U.S. economic data was released that day. The hawkish rhetoric seems to be focused only on reining in inflation.
- It is our impression that the “market” consensus is for a mild U.S. recession this year. But opinions about this topic can vary greatly. Based on recent reports, it appears that J.P. Morgan (JPM) is increasingly convinced that the U.S. will experience a recession this year. But Goldman Sachs’ (GS) base case is that no major economy will have a recession this year. The GS views seem to be based on their assumption that lags from tightening fiscal conditions are much less that most assume. The drag from fiscal tightening from a large part of last year should be about to fade. Europe’s mild winter and therefore higher storage levels of natural gas should help boost Europe’s economic growth. Europe’s growth should also enjoy some “spillover” effects from China’s reopening. Germany will probably benefit the most. GS now forecasts a 5.5% GDP 2023 growth rate for China. GS also forecasts global growth of 2.3% for 2023 versus a consensus forecast of 1.8%.
- We continue to forecast that U.S. inflation will dissipate more quickly than most anticipate before its descent will “stall” at a somewhat higher rate than the Federal Reserve’s (Fed) targeted 2% rate of inflation. Our “guess” at this point is that the “stall” level could be in the 3.5% to 4% range. A principal question would then be whether the Fed would raise its targeted inflation rate of inflation if the rate of inflation stabilizes at a sustainable but “sticky” level such as 3%.
- In general, we find that the data we analyzed this week supports a U.S. inflation rate that continues to drop rather quickly but a more uncertain economic backdrop. We remain very hopeful that China’s reopening will help spur global economic growth. We will continue to monitor very closely the rate of a slowdown in U.S. wage growth relative to the slowing rate of inflation. A lagging slowdown in wage growth relative to a more rapidly falling rate of inflation, would most likely lead to profit margin compression at many companies.
The Upshot: Our general investment approach remains the same as depicted in last week’s commentary. We maintain our preference for big cap quality stocks with good balance sheets, relatively stable cash flows and stable margins. Volatility across sectors continues to be supportive of a well-diversified global portfolio for long term investors.
The marked divergence of GS’s stock and Morgan Stanley’s (MS) after the announcement of their earnings on Tuesday was a great example of the importance of stock selection as opposed to just picking the “right” sector. The stock price of GS that day fell over 6%, while MS’s stock rose by almost 6%.
We have highlighted the debt ceiling issue of the U.S. as a possible disruptive force on financial markets at some point later this year. Some investors are also becoming increasingly concerned that Israel might attack Iran’s nuclear facilities later this year. China’s intentions in regard to Taiwan remains a troublesome issue as well. At this time last year, few investors foresaw Russia’s invasion of Ukraine. We are not suggesting that long term investors should change any of their strategies based on hypotheticals. Most likely we are unaware of numerous other hypotheticals. We could adjust our strategies to the extent any “unforeseen” circumstances do in fact occur. To do otherwise, could lead to a “paralysis” of investing.
Hawkish Fedspeak Continues
This week saw many Fed officials continue their generally hawkish rhetoric. This was true even in regard to those officials who advocated a slowing in the pace of federal funds rate increases from the last hike of 50 basis points (bps) to 25 bps at the Fed’s next meeting between January 31 and February 1. All Fed officials who spoke this week seemed to advocate that the terminal federal funds rate should be above 5% before it was sufficiently restrictive to achieve the targeted 2% rate of inflation. They just disagreed on the pace of the hikes. They also advocated that the terminal rate be maintained for “some time.” The phrase from A-ha’s song “Take On Me” appears to be apropos: “It’s no better to be safe than sorry.” We have highlighted in prior commentaries that the Fed has adopted apparently a new risk management approach whereby they could balance better the risks of “overtightening” or ‘insufficient tightening” of their monetary policies. Such an approach should strongly favor a slowing in the pace of federal funds rate hikes to increments of 25 bps in the future. But the hawkish Fedspeak belies this approach to some extent. In our opinion, most Fed officials would prefer to err on the side of overtightening and risk a recession than not to tighten sufficiently to rein in inflation down to a 2% rate. We think that most Fed officials believe that the “safer” approach is to overtighten. We have little doubt that if the Fed were to tighten insufficiently so that inflation remained “too” elevated, they would then be very “sorry.” Under these circumstances the “safer” approach also appears to be the one where the Fed is less likely to be “sorry.”
Examples of Hawkish Fedspeak this Week
St. Louis Fed president James Bullard maintained his well-known hawkish perspective this week when he advocated for a front-loaded approach to get to his desired restrictive terminal rate in the 5.25% to 5.5% range. He wanted to achieve this level of the federal funds rate as soon as possible. He also stated that “the prospects for a soft landing have improved markedly … [but] the risk to a soft landing is that the inflation data doesn’t cooperate and goes in the other direction.” Cleveland Fed president Loretta Mester stressed the need to raise rates at least “a little bit” beyond 5% to bring inflation to “heel.” She was noncommittal about the pace of rate hikes. Dallas Fed president Lorie Logan laid out the case for slowing the pace of rate hikes down to 25-bps increments. In expressing her opinion, she made clear her concern that slowing the pace of rate hikes might ease financial conditions by reducing uncertainty. In that case, “we can offset the effect [of easing financial conditions] by gradually raising rates to a higher level than previously expected.” She added: “The most important risk I see is that if we tighten too little, the economy will remain overheated, and we will fail to keep inflation in check.” Philadelphia Fed president Patrick Harker reiterated that he is ready to downshift to 25-bps hikes as well, and that he “expects that we will raise rates a few more times this year.”
On Thursday, the Fed’s vice chair Lael Brainard stated her determination to “stay the course.” She explained that “even with the recent moderation, inflation remains high, and policy will need to be sufficiently restrictive for some time to make sure that inflation returns to 2% on a sustained basis.” Brainard appeared comfortable that we have avoided a wage-price spiral. “Together, the price trends on core goods and non-housing services, the tentative indications of some deceleration in wages, the evidence of anchored expectations, and the scope for margin compression may provide some reassurance that we are not currently experiencing a 1970’s-style wage-price spiral.” Brainard acknowledged the weakening economic data released the prior day. She thought that the industrial production data pointed to a significant weakening in the manufacturing sector and noted that U.S. December’s retail report pointed to further moderation in consumer spending. Boston Fed president Susan Collins joined the hawkish rhetoric on Thursday as well. “There is more work to do … I anticipate the need for further rate increases perhaps at a slower pace, depending on incoming data, before holding rates at a sufficiently restrictive level for some time.” She indicated that a sufficiently restrictive level would be just above 5%.
New York Fed president John Williams shared his views on Thursday as well. He adhered to the now familiar phrase that “we have more work to do” to rein in inflation down to more acceptable levels. “Bringing inflation down is likely to require a period of below trend growth and some softening of labor market conditions.” He added that “it is critical that we stay the course until the job is done.” Williams thought that the rate of inflation should cool to 3% this year and will return to 2% in the next couple of years. He stated that high inflation is his main concern for 2023 – and therefore presumably not recession risks. He foresaw the U.S. unemployment rate rising from the current 3.5% rate to 4.5% over the next year. The co-founder of Carlyle Group, Inc David Rubinstein expressed this week his belief that the Fed might ”settle” eventually for a 3% inflation rate. “Their current position is 2% – I suspect in time they’re going to 3%.” We agree that this is entirely plausible, although we doubt that the Fed would admit this prior to getting close to 3%. In the meantime, we continue to foresee the rate of inflation dissipating more quickly than most economists and investors expect until the inflation rate “stalls” at a level somewhat above 2%. According to JPM on January 20, financial markets were pricing in a terminal rate of 4.88%, in spite of the Fed’s stated resolve to get to at least a 5% federal funds rate.
Favorable Inflation Data and Weaker Economic Data – Financial Market Reactions
We thought that the combination of favorable inflation data and mostly weak economic data released on Wednesday, along with hawkish Fedspeak and financial markets’ reactions was illustrative of many of our observations in our recent commentaries. It appeared that U.S. equities rose initially on the lower-than-expected Producer Price Index (PPI). The markets’ focus then quickly shifted to the weaker-than expected economic figures that included lower-than-expected retail data and lower-than-expected industrial production. We interpreted this as an example of our thesis that the focus of financial markets was susceptible to shifts between inflation and interest rate concerns on one hand, and slowing economic growth and possible recession concerns on the other hand. Once this shift occurred, equities reversed and generally traded lower.
We have observed in general that hawkish Fedspeak seems to have become less impactful on financial markets recently when hawkish comments have been meant to reverse the loosening of financial conditions. But we surmise that the hawkish Fedspeak was more impactful on Wednesday when it accompanied negative economic news. None of the Fed officials who spoke this week seemed to have been troubled by indications of a weaker U.S. economy. Their focus was on bringing down the inflation rate. In our opinion, financial markets were disappointed in Fed officials unwavering hawkish stance in the face of a possible U.S. economic slowdown. More than likely, the market interpreted these circumstances as increasing the likelihood of the Fed “overtightening” and increasing the probability of a recession. It was therefore not surprising to us when equities traded lower, interest rates traded lower and the US dollar (USD) remained close to its recent lows on Wednesday. The two-to-10-year Treasury yield curve also became more inverted. At this point, we will take a closer look at some of the economic data released this week. We will first start with the PPI and retail sales figures since that was the principal focus of many investors for this week.
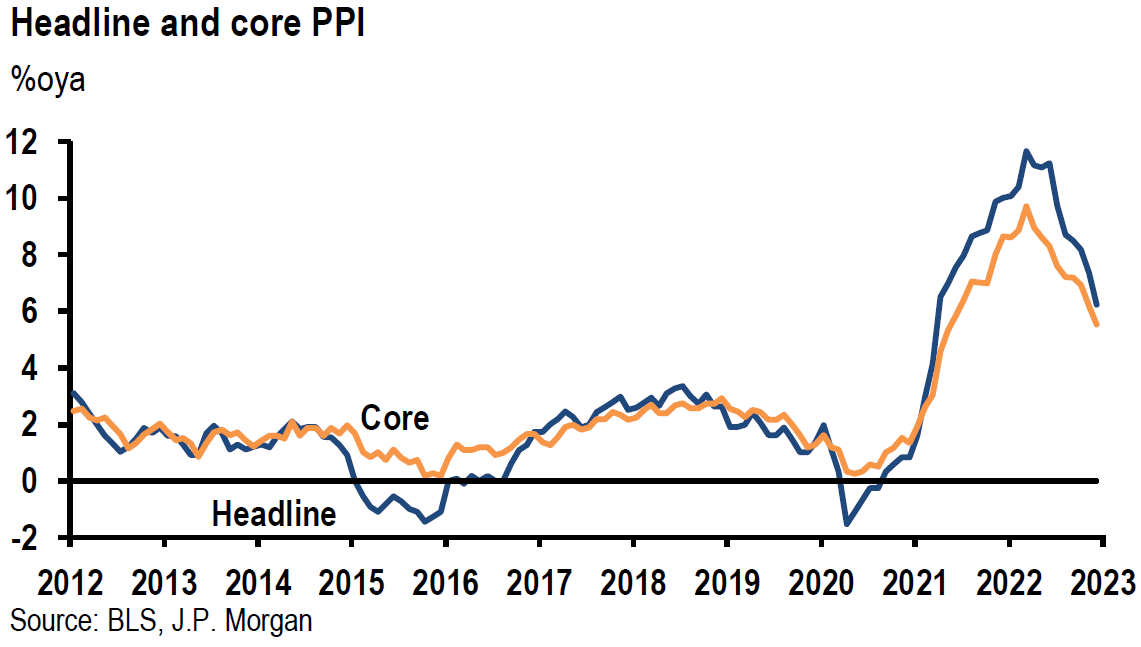
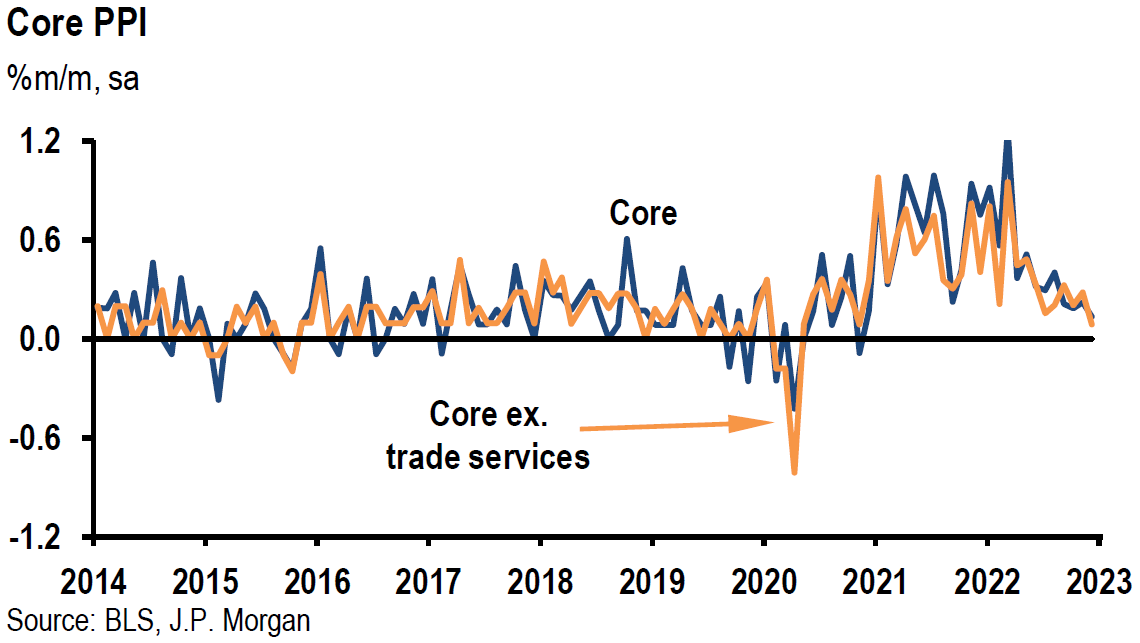
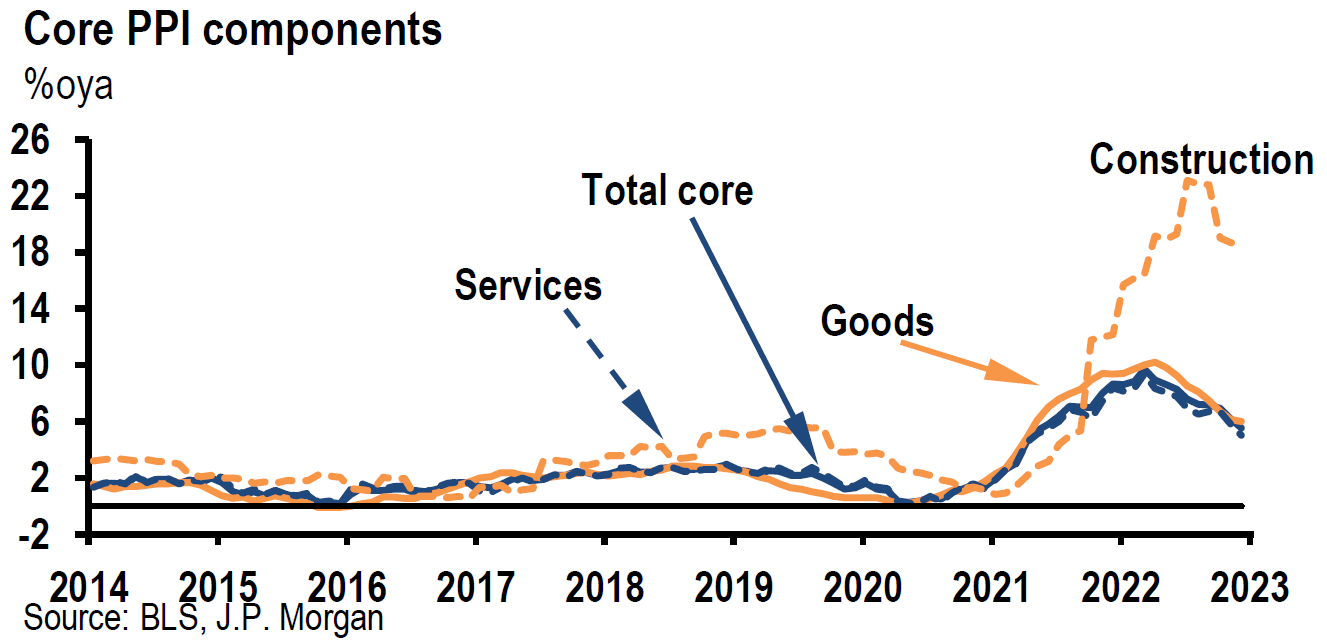
U.S. December PPI
Producer prices fell 0.5% month-over-month (m/m) compared to an expected m/m decline of 0.1%. The year-over-year (y/y) increase was 6.2% compared to an expected 6.8% increase and a revised 7.3% increase in November. Producer prices were 0.2% higher m/m in November. This was the ninth consecutive monthly decline from the 11.7% y/y peak increase of March 2022. December’s decline was the biggest one-month drop since April 2020 and was the slowest annual increase since March 2021. A large part of December’s monthly decline was driven by the 7.9% monthly drop in energy prices. This includes a 13.4% m/m decline in wholesale gasoline prices, and compares to a revised drop of 3.2% in November. Wholesale energy prices have decreased in four of the last six months and are now more than 21% lower from their June peak. Food prices were 1.2% lower m/m and 14.3% higher y/y versus a 15.4% y/y gain in November.
Source: JP Morgan, US: PPI falls 0.5% in December, core up 0.1% (1-18-2023)
U.S. December Retail Sales
December retail sales were down 1.1% m/m, slightly more than expected and increased by 6.0% y/y and compared to November’s decrease of 1%. December’s monthly decrease was the largest monthly decrease since December 2021. Retail sales ex-auto sales were also lower by 1.1% m/m against expectations of a 0.5% decrease. December sales at gasoline stations were 4.6% lower m/m and department store sales were 6.6% lower, which was part of a broader loss at merchandise stores. Online sales were 1.1% lower m/m and motor vehicles and parts were 1.2% lower. Ex-gasoline service station sales, retail sales were 0.8% lower m/m. J.P. Morgan (JPM) thought that December’s decrease in retail sales exaggerated underlying weakness due to such factors as the harsh winter weather in December.
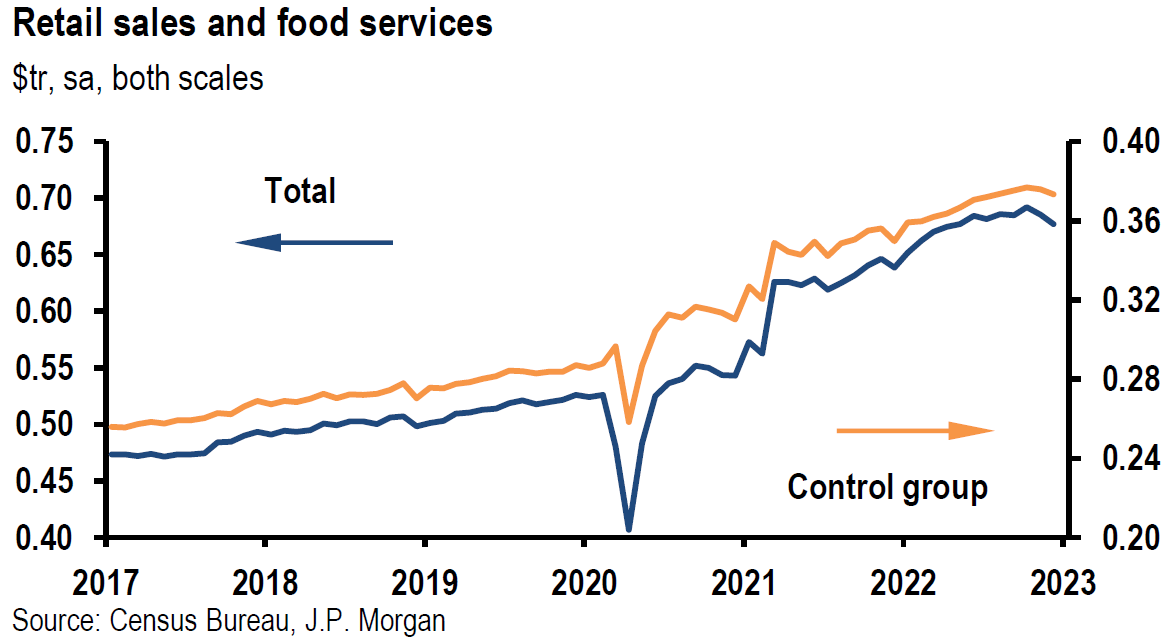
Source: JP Morgan, US: Retail sales pull back in December (1-18-2023)
U.S. December Industrial Production
Industrial production fell 0.7% m/m and was 1.6% higher y/y. This was the smallest annual increase since March 2021 and compared to November’s 2.2% y/y increase. December’s manufacturing output declined 1.3% m/m and capacity utilization was 0.8% lower m/m to 78.8%, which was 0.8% lower than the U.S. long run average. November’s manufacturing output was revised lower from a decrease of 0.6% to a 1.1% m/m drop, indicating a worse than expected trend.
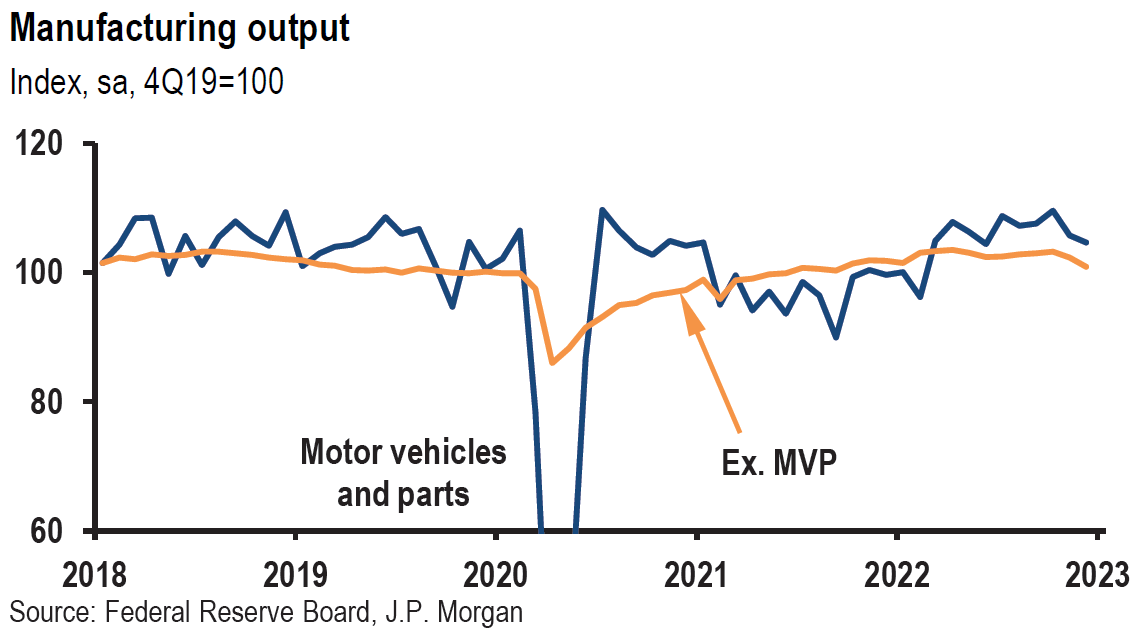
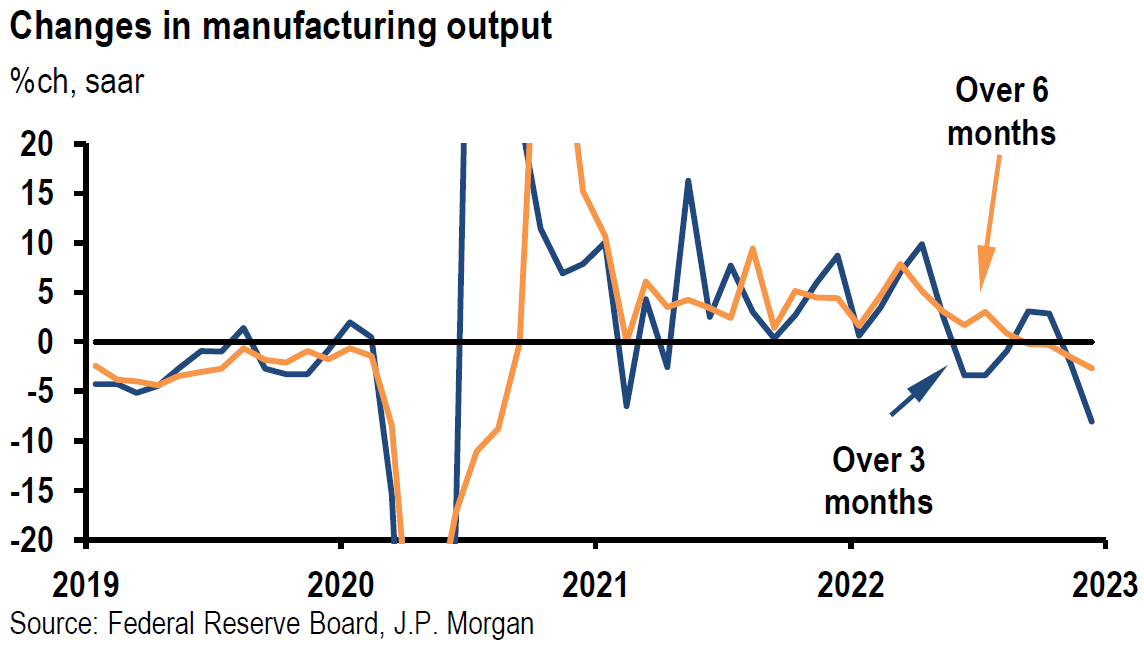
Source: JP Morgan, US: Manufacturing output drops 1.3% in December (1-18-2023)
Regional Fed Surveys
New York Fed’s Empire State Manufacturing Survey
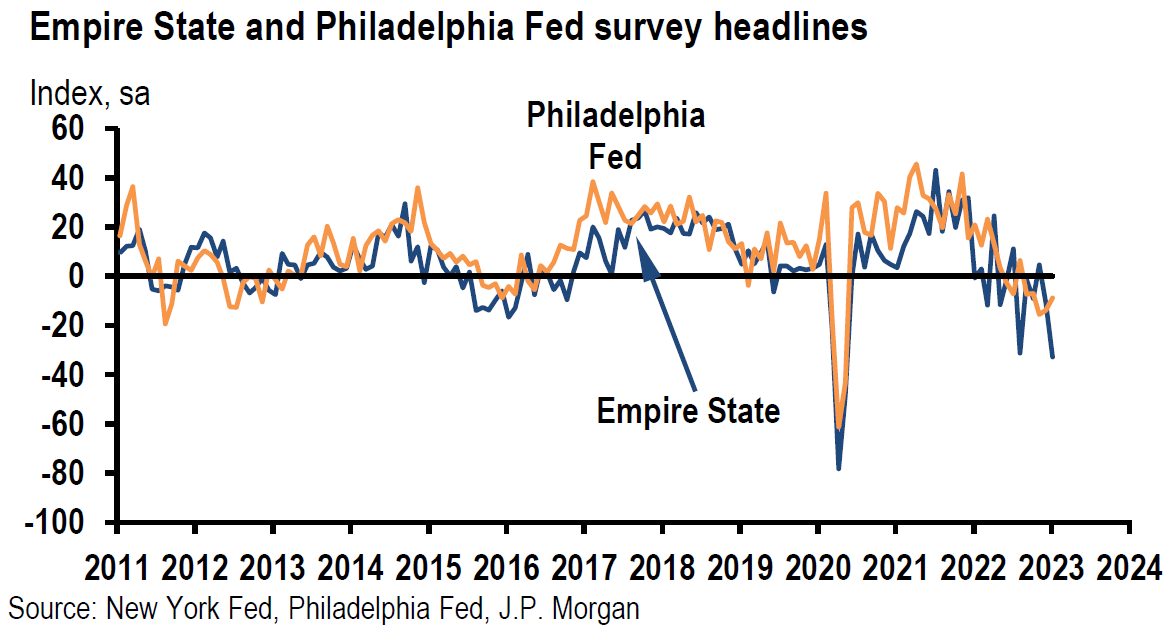
This was the weakest of the surveys that were released this week. Responses for this survey were collected between January 3 and 10 and indicated that business conditions in New York state had contracted “sharply.” The headline general business conditions index fell 22 points to -32.9, which was its lowest level since mid-2020 and the fifth worst in this survey’s history. The new orders index fell 28 points to -31, shipments dropped 28 points to -22.4 and unfilled orders edged down to -14.3. Employment growth “stalled” as the index for employees fell 11 points to 2.8. This was its lowest level in more than two years. The average workweek remained in negative territory at -10.4, indicating a decline in hours worked. Input prices slowed “considerably” as the prices paid index dropped 18 points to 33.0. Selling prices “moderated” with the prices received index falling six points to 18.8. In general, firms expected business conditions to remain weak and expect little improvement over the next six months.
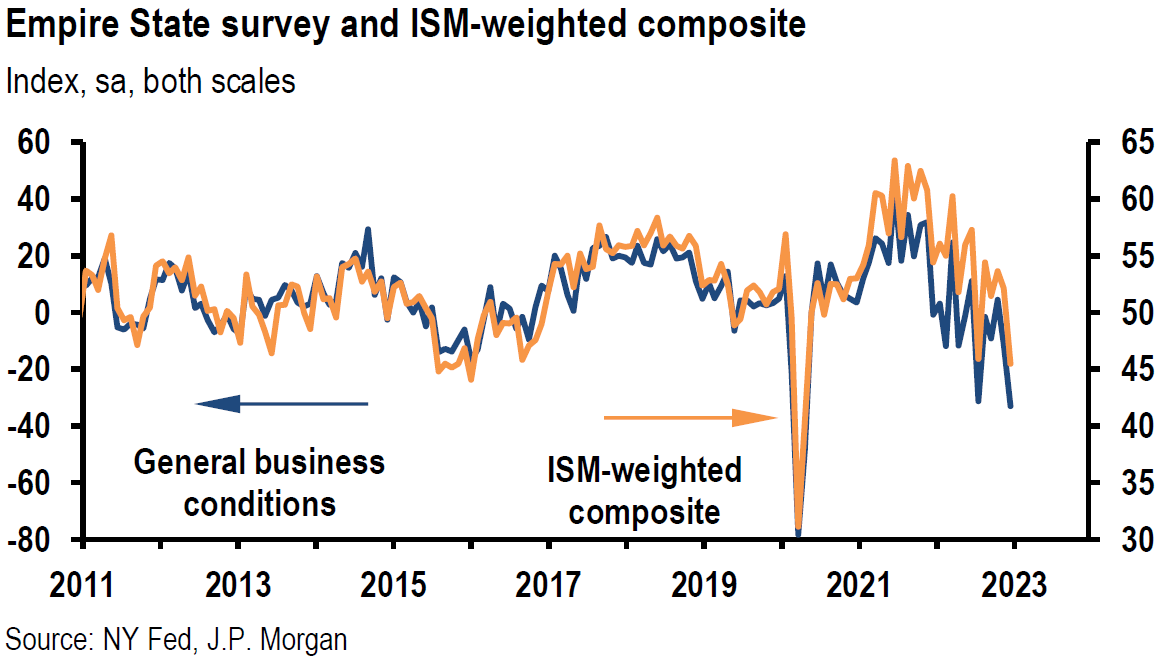
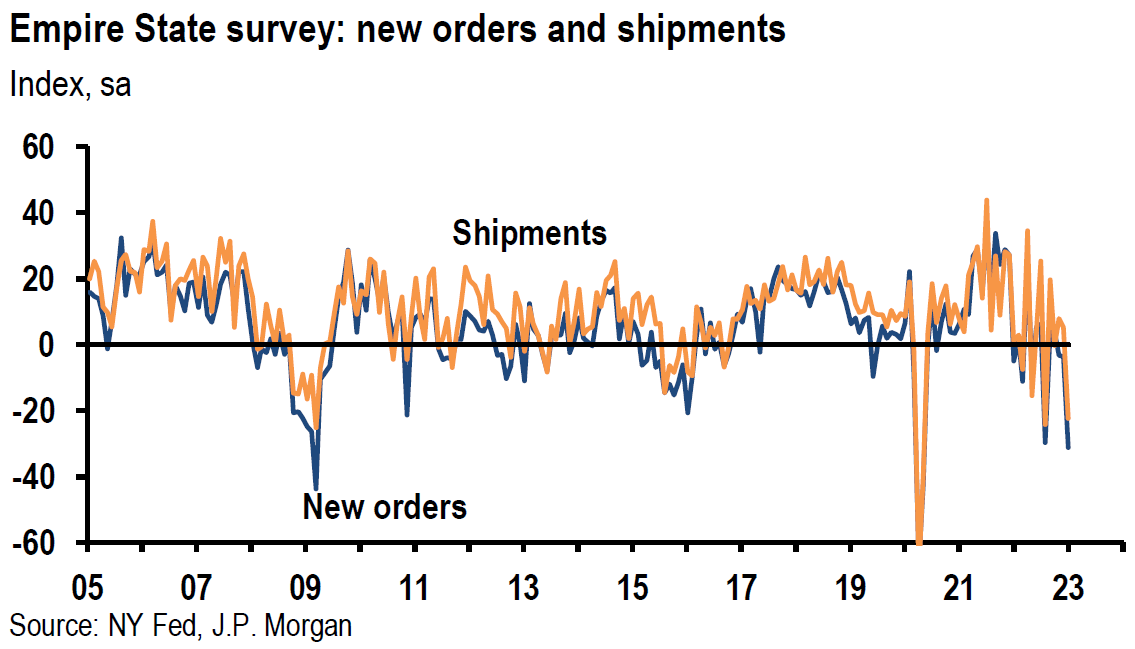
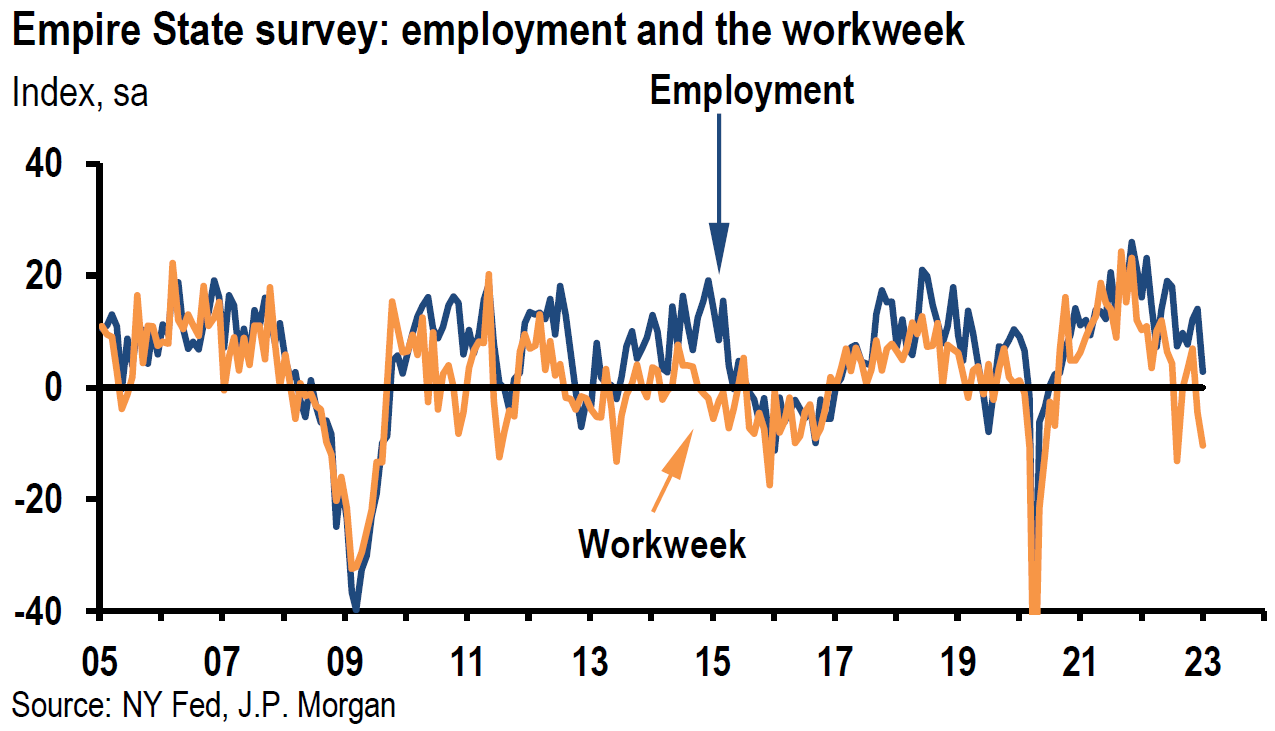
Source: JP Morgan, US: Empire State manufacturing survey drops in January (1-17-2023)
Business Leaders’ Survey – New York Fed’s Service Firms Survey in New York State and Nearby Areas
Responses were collected between January 3 to 10. The headline business activity index dropped four points to -21.4, its lowest level in nearly two years and its fourth consecutive negative monthly reading. The business climate level of -41.8, suggested that the business climate remained “much worse” than normal. Employment growth slowed to a “crawl” even as wage increases remained widespread. Firms did not expect business conditions to improve over the next six months. The prices paid index moved seven points lower to 65.6 – its second consecutive monthly decline and pointing to a slowing of the pace of input price increases. The prices received index rose modestly by three points to 29.8.
Philadelphia Fed’s Manufacturing Survey
Responses were collected between January 9 to 17. This survey’s manufacturing index rose to -8.9 from a revised reading of -13.7 and better than the expected -11. This was the survey’s fifth consecutive negative monthly reading and its seventh negative reading out of the past eight months. Indicators for current activity and new orders improved from December’s levels but remained in negative territory. The future employment index fell 21 points to -1.9, its first negative reading since February 2016. Firms continued to report increases in prices paid and received at still elevated levels. This survey’s future indexes suggested “tempered” expectations for growth over the next six months.
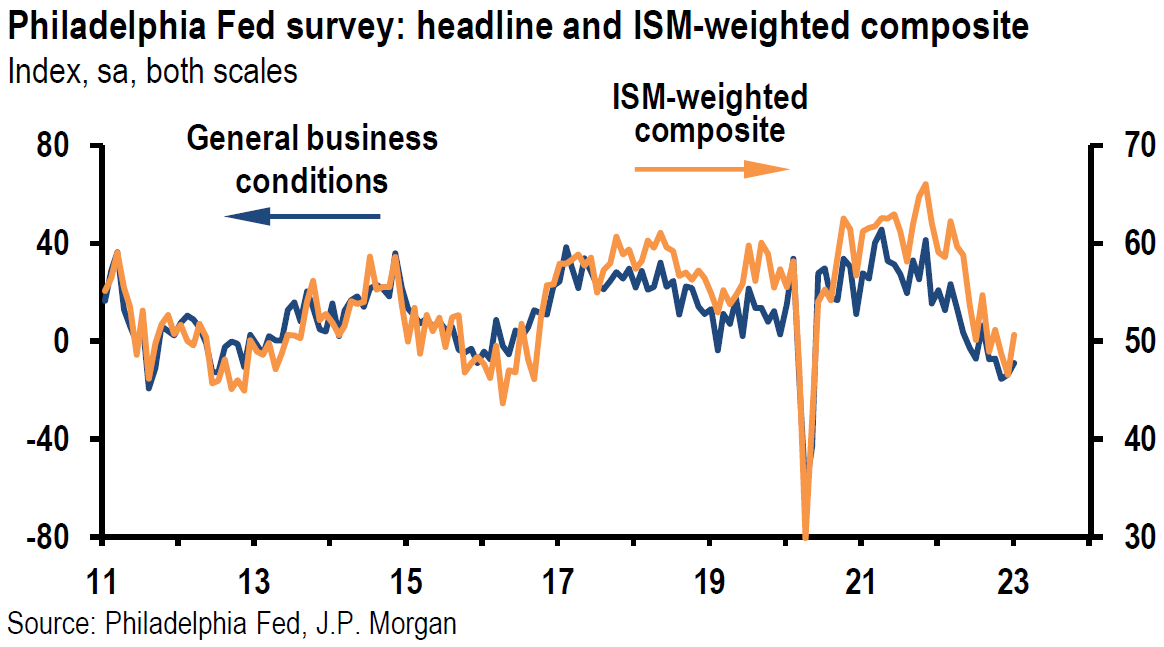
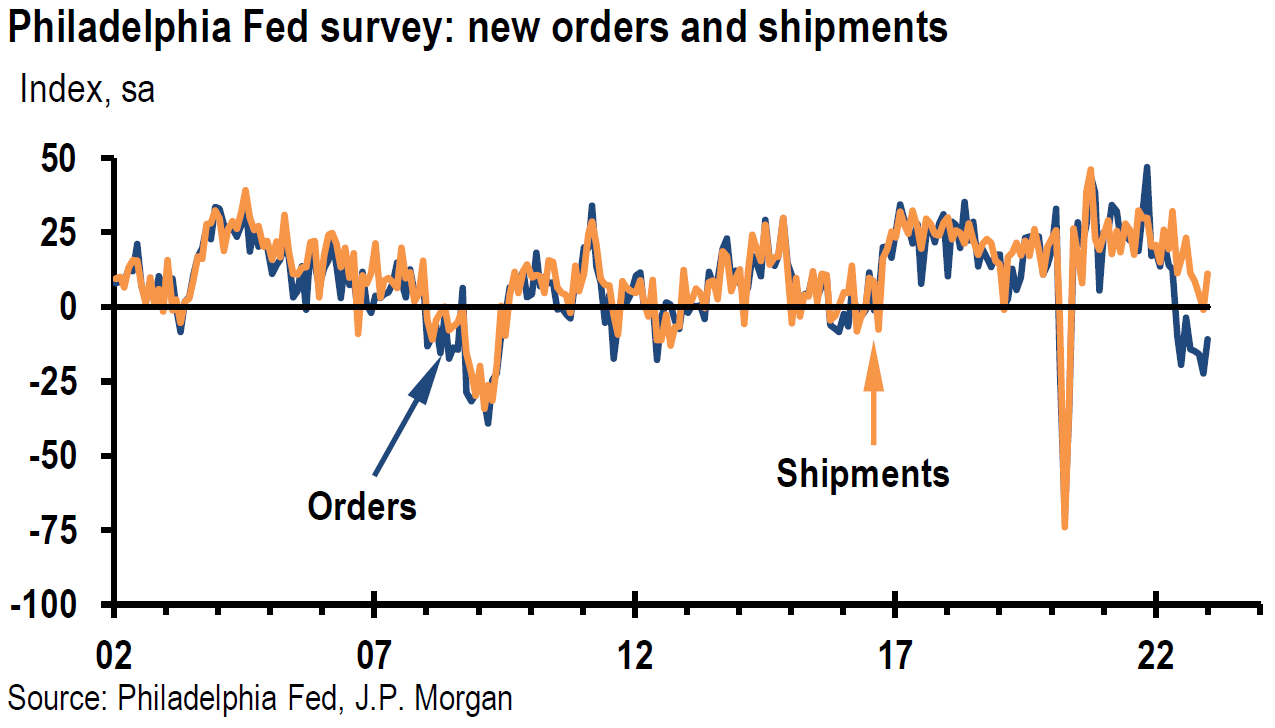
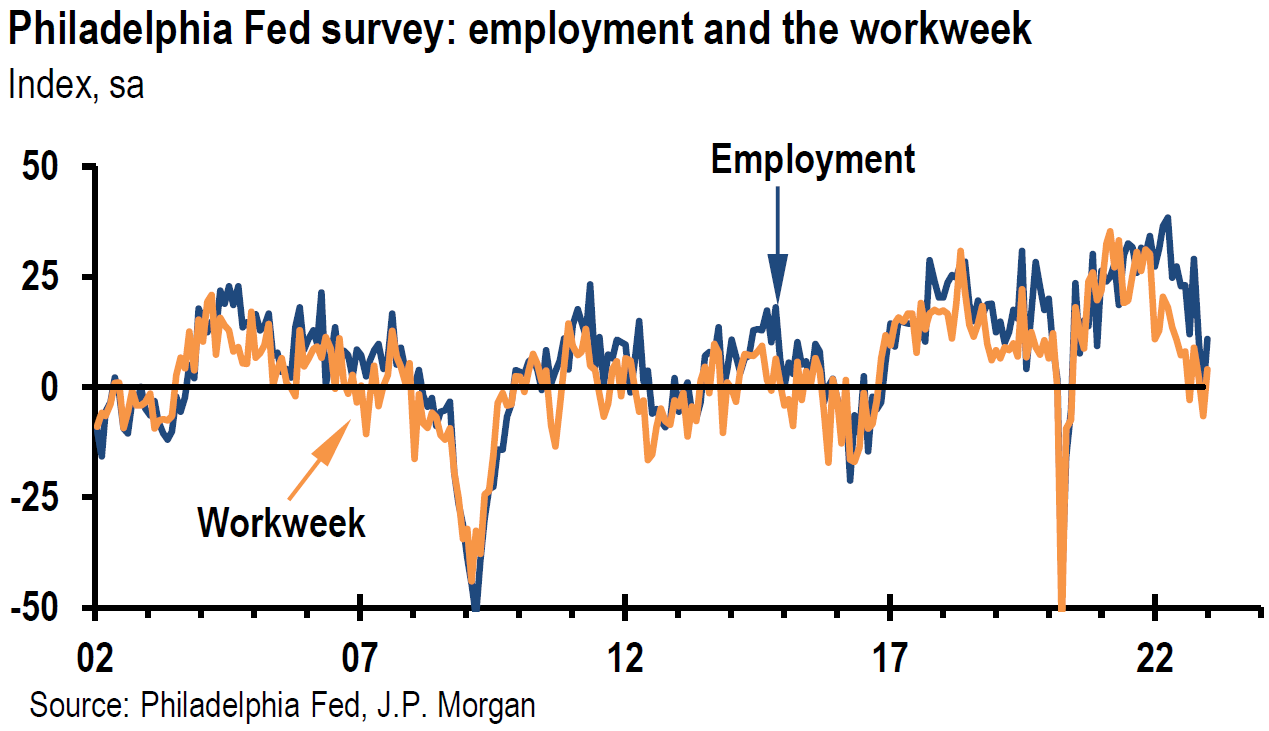
Source: JP Morgan, US: Philadelphia Fed survey moves up but stays negative (1-19-2023)
Weekly Claims for Unemployment Insurance
Initial jobless claims were 15,000 lower for the week ended January 14 to 190,000 versus an expected level of 214,000. This was the lowest reading since last September and the four-week moving average fell by 6,500 to an eight-month low of 206,000. On a non-seasonally adjusted basis, initial claims fell by 53,582 to 285,575. Initial claims data is often considered as a proxy for layoffs. Continuing claims for unemployment insurance gained 17,000 from a revised lower by 4,000 level to 1.647 million for the week ended January 7. The four-week moving average was 1.673 million, 5,500 lower from the previous week’s average. This data remained consistent with a very tight U.S. labor market.
Mixed But Still Weak Housing Data
The National Association of Home Builders (NAHB) home-builders sentiment index rose unexpectedly in January for the first time since December 2021. It rase by four points to a still very low level of 35. Anything below 50 is considered a negative sentiment. Other than immediately after the onset of the pandemic, December’s sentiment was the lowest since 2012. The gauge for current sales rose four points to 40, sales expectations for the next six months was two points higher to 37 and traffic of prospective buyers rose three points to 23. The chief economist at NAHB stated that “while NAHB is forecasting a decline in single family starts this year compared to 2022, it appears a turning point for housing lies ahead.” According to Mortgage News Daily on January 18, mortgage rates were now at the lowest rate since September and about 1% lower than the peak 30-year fixed rate mortgage last fall. On January 19, Freddie Mac stated that the average 30-year fixed rate mortgage was 6.15%, down from 6.33% the prior week.
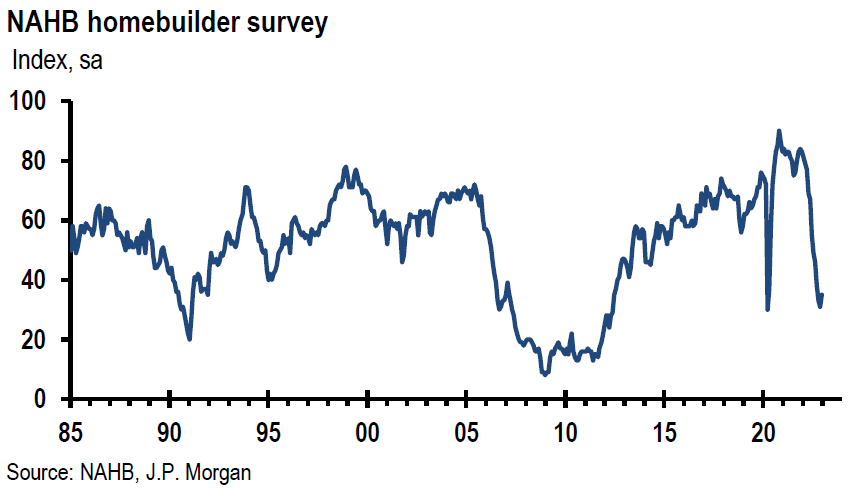
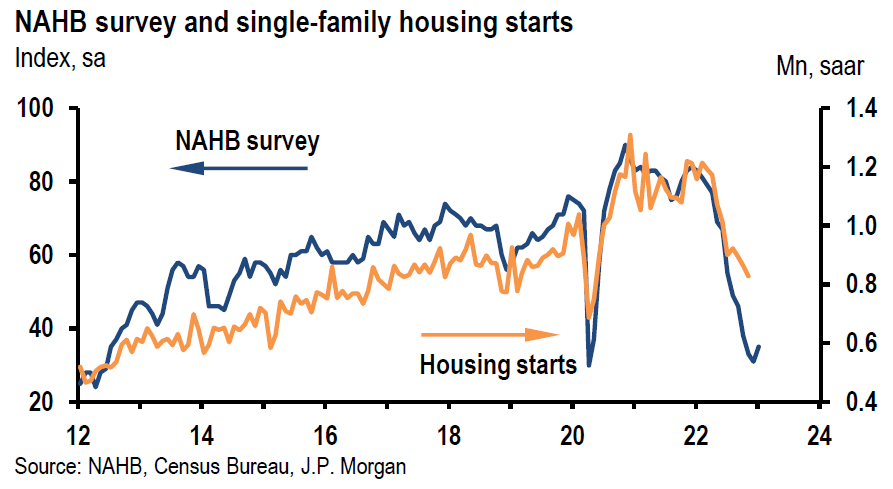
Source: JP Morgan, US: NAHB survey moves up while staying low (1-18-2023)
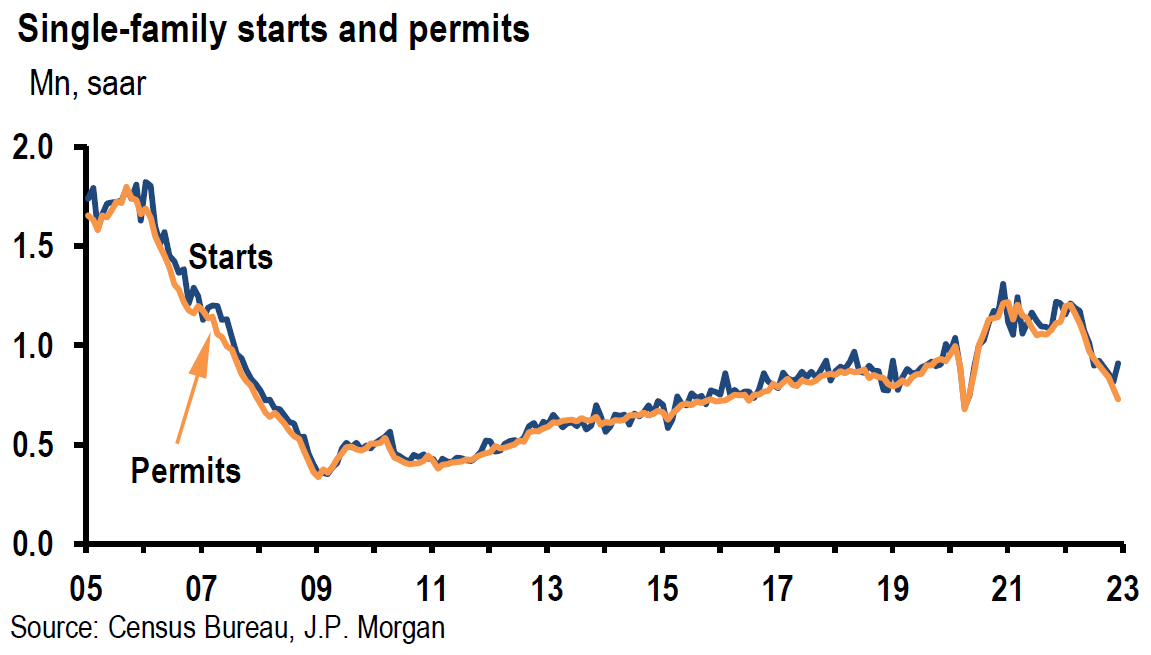
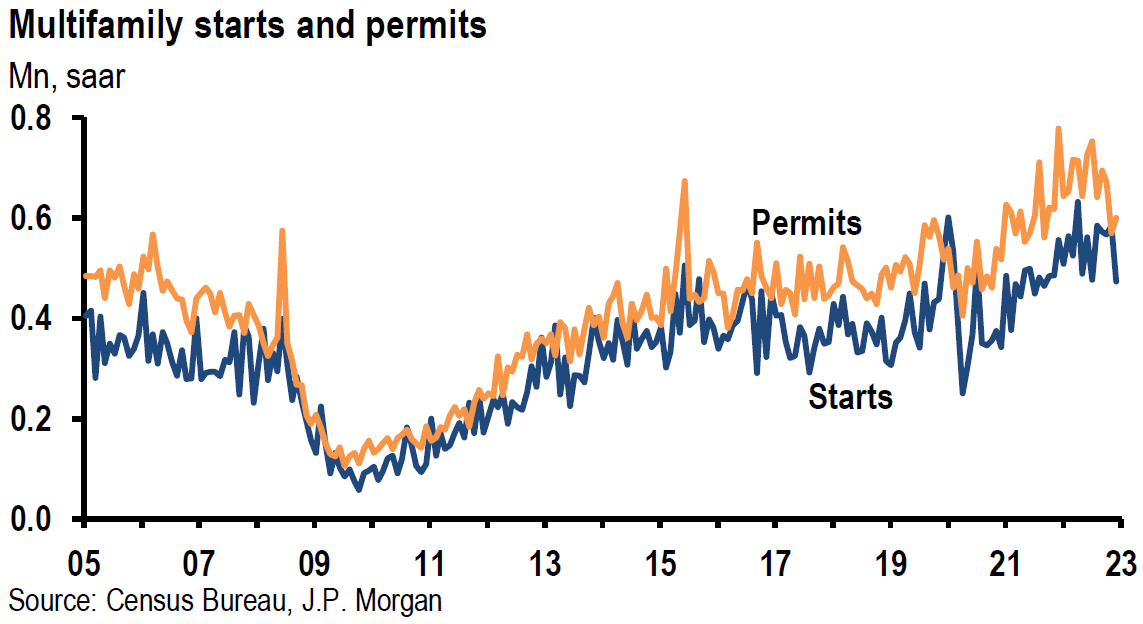
U.S. housing starts dropped 1.4% m/m in December to a seasonally adjusted rate of 1.382 million, which was the lowest level in five months but above market expectations 0f 1.359 million units. Housing starts dropped 3% for all of 2022 and was the first annual decline since 2009. The more important single family starts fell 11% in 2022. But in December single family home starts jumped 11.1% m/m and the more volatile multi-family (five units or more) starts sank 18.9%. Building permits fell 1.6% m/m to a seasonally adjusted rate of 1.33 million units in December. This was the lowest level since May 2020 and below the expected 1.37 million units. Permits are considered a proxy for future construction. Single family permits were 6.5% lower m/m to a rate of 750,000 – lowest since April 2020 – while multi-family permits rose 5.3% m/m to 600,000 units.
According to the National Association of Realtors (NAR), existing home sales, which include completed transactions of single-family homes, town houses, condominiums and co-ops fell 1.5% m/m in December to a seasonally adjusted annual rate of 4.02 million. December marked the eleventh consecutive month of slowing sales, the longest such streak since 1999 and reached its lowest level since November of 2010. There were 970,000 previously owned homes on the market, down 13.4% m/m in December but 10.2% higher y/y. At the current sales pace, it would take 2.9 months to exhaust this inventory of homes, up from 1.7 months a year ago. The NAR reported on Friday that total sales of existing homes totaled 5.03 million in 2022, a 17.8% drop from 2021. 2022 was the weakest year for home sales since 2014 and saw the biggest annual decline since 2008.
Source: JP Morgan, US: Housing starts and permits decline in December (1-19-2023)
Fed’s Beige Book
The Beige Book is a compilation of anecdotal evidence compiled by the Fed’s twelve regional banks in each of their Districts. This latest Beige Book contains data collected on or before January 9. The Beige Book is published eight times per year and is meant to show changes in economic conditions in the U.S. when compared to its prior publication. Overall economic activity was little changed. Highlights include: 1) many retailers said they had a harder time passing on input cost increases to their customers; 2) managers in many Districts observed easing of freight costs and commodity prices; 3) consumer spending increased slightly, auto sales were flat on average and housing markets continued to weaken; 4) manufacturing activity declined “modestly” on average; 5) many firms hesitated to lay off workers and instead would try to reduce their workforce through attrition; 6) employment continued to grow at a “modest” or “moderate” pace, as did selling prices, and wage pressures remained elevated.
BOJ Maintains its Yield Curve Control (YCC) Policy
Contrary to many trader’s expectations, the Bank of Japan (BOJ) maintained its latest upper limit band of a 0.5% rate on its 10-year sovereign bonds. This “non-decision” caused its 10-year yields to trade lower and the yen to depreciate versus USD. Interest rates of many other countries also traded lower.
U.S. Debt Limit Reached on Thursday
The U.S. reached its statutory debt limit on Thursday, which prompted the U.S. Treasury Department to take “extraordinary measures” to continue funding its obligations. In a letter sent to Congressional leaders last week, Treasury Secretary Yellen indicated that it’s unlikely that cash and extraordinary measures will be exhausted before June. On June 20, Goldman Sachs indicated that it might be as long as sometime between August and October before Congress will need to pass an increase in the debt limit to avert a U.S. default. On January 18, Goldman Sachs stated that “we continue to believe that this year’s debt limit is likely to rival the 2011 debt limit episode – the most disruptive in recent history. U.S. stocks traded roughly 17% lower in the month leading up to a possible default that was avoided with hours to spare and after a downgrade of U.S.’s credit rating. It took about six months for U.S. equity markets to recoup these losses.
Bottom Line
For the time being we are maintaining our basic investment approach as expressed in last week’s commentary. We continue to prefer high quality big cap stocks that offer good balance sheets, as well as relatively stable cash flows and profit margins. We prefer a very diversified global portfolio for long term investors.
The divergent reactions of GS and MS stocks in reaction to their earnings announcements was a stark reminder of the importance of stock selectivity. We maintain our conviction that the U.S. rate of inflation will continue to dissipate more quickly than most investors before “stalling” at a level somewhat above 2%. The profit margins of many companies should be negatively impacted to the extent a slowdown in wage growth lags a slowing rate of inflation.
In our opinion, Fedspeak continues to focus only on inflation, irrespective of evidence of slowing economic growth. This has the potential to shift the focus of financial markets to concerns about slowing economic growth, weaker margins and weaker earnings probabilities. The two-to-10 year Treasury yield curve continued to fluctuate this week even as it remained very inverted. Wednesday saw one of this week’s most inverted levels when economic slowdown concerns appeared to be at their peak during this week.
Definitions:
Fedspeak – Fedspeak refers to speeches about monetary policy given by members of the U.S. Federal Reserve Bord of Governors.
Fed Funds Terminal Rate – The terminal rate is defined as the peak spot where the benchmark interest rate, the federal funds rate, will come to rest before the central bank begins trimming it back.
Fed’s Beige Book – The Beige Book is a qualitative review of economic conditions drawing on reports from 12 district banks. It is published eight times annually before meetings of the Federal Open Market Committee, which uses the results in its planning and decision-making processes.
Inverted Yield Curve – An inverted yield curve describes the unusual drop of yields on longer-term debt below yields on short-term debt of the same credit quality. Sometimes referred to as a negative yield curve, the inverted curve has proven in the past to be a relatively reliable lead indicator of a recession.
Producer Price Index (PPI) – The producer price index (PPI), published by the Bureau of Labor Statistics (BLS), is a group of indexes that calculates and represents the average movement in selling prices from domestic production over time. It is a measure of inflation based on input costs to producers.
Core Producer Price Index (PPI) – The core producer price index (PPI), published by the Bureau of Labor Statistics (BLS), is a group of indexes that calculates and represents the average movement in selling prices from domestic production over time that excludes food and energy prices, which are the more volatile parts of inflation.
US Debt Ceiling – The debt ceiling is the maximum amount that the U.S. government can borrow by issuing bonds. The Treasury Department must find other ways to pay expenses when the debt ceiling is reached otherwise, there is a risk the U.S. will default on its debt.
Housing starts – Housing starts are a measure of new residential construction and are considered a key economic indicator.
Housing Permits – Housing permits are a type of authorization that must be granted by a government or other regulatory body before the construction of a new or existing home can legally occur.
Initial Unemployment Insurance Claims – Initial claims are new jobless claims filed by U.S. workers seeking unemployment compensation, included in the unemployment insurance weekly claims report.
Continuing Claims – Continuing claims track the number of U.S. residents filing for ongoing unemployment benefits in a given week. Continuing claims measure ongoing unemployment benefits, which is in contrast to initial claims, which track new filings for benefits.
The NAHB/Wells Fargo Housing Market Index (HMI) – The NAHB/Wells Fargo Housing Market Index is a monthly sentiment survey of members of the National Association of Home Builders. The index measures sentiment among builders of U.S. single-family homes and is a widely watched gauge of the U.S. housing sector.
New York Fed’s Empire State Manufacturing Survey – The Empire Fed Manufacturing Survey is a monthly survey of manufacturers in New York State conducted by the Federal Reserve Bank of New York with readings above 50 signaling expansion and below 50 contraction.
Business Leaders Survey – The Business Leaders Survey is a monthly survey of service firms in New York State, northern New Jersey and southwestern Connecticut, conducted by the New York Fed.
Philadelphia Fed’s Manufacturing Survey – The Philadelphia Fed’s Manufacturing Business Outlook Survey is a monthly survey of manufacturers in the Third Federal Reserve District. Participants indicate the direction of change in overall business activity and in the various measures of activity at their plants.
IMPORTANT DISCLOSURES
The views and opinions included in these materials belong to their author and do not necessarily reflect the views and opinions of NewEdge Capital Group, LLC.
This information is general in nature and has been prepared solely for informational and educational purposes and does not constitute an offer or a recommendation to buy or sell any particular security or to adopt any specific investment strategy.
NewEdge and its affiliates do not render advice on legal, tax and/or tax accounting matters. You should consult your personal tax and/or legal advisor to learn about any potential tax or other implications that may result from acting on a particular recommendation.
The trademarks and service marks contained herein are the property of their respective owners. Unless otherwise specifically indicated, all information with respect to any third party not affiliated with NewEdge has been provided by, and is the sole responsibility of, such third party and has not been independently verified by NewEdge, its affiliates or any other independent third party. No representation is given with respect to its accuracy or completeness, and such information and opinions may change without notice.
Investing involves risk, including possible loss of principal. Past performance is no guarantee of future results.
Any forward-looking statements or forecasts are based on assumptions and actual results are expected to vary from any such statements or forecasts. No assurance can be given that investment objectives or target returns will be achieved. Future returns may be higher or lower than the estimates presented herein.
An investment cannot be made directly in an index. Indices are unmanaged and have no fees or expenses. You can obtain information about many indices online at a variety of sources including: https://www.sec.gov/fast-answers/answersindiceshtm.html or http://www.nasdaq.com/reference/index-descriptions.aspx.
All data is subject to change without notice.
© 2024 NewEdge Capital Group, LLC


