


Views from the CIO Office
Schism: The Bond Market is Hearing But Not Listening
Cameron Dawson, CFA®
I’ve done the math enough to know
The dangers of our second guessing
Doomed to crumble unless we grow
And strengthen our communication
-“Schism”, Tool
Every partner, parent, or friend knows that there is a big difference between hearing and listening. Hearing is just the passive perception of sound. Listening is the active absorption of sound.
Communication breaks down when we hear but we don’t listen.
In recent months, as the Fed has been speaking about its plan for monetary policy, the bond market has been doing a lot of hearing, but not a lot of listening. This has resulted in a substantial schism between what the Fed is saying it is going to do and what the bond market expects the Fed to do.
The Fed has been relatively clear in its message: it wants to raise rates into sufficiently restrictive territory (which it judges as somewhere above 5% on the Fed Funds rate), and then it wants to keep rates in that restrictive territory for “some time”.
This is essentially the application of two of Chair Powell’s most common phrases from the past six months, saying the Fed needs to “keep at it until the job is done” (get rates to restrictive) and that “history warns against prematurely loosening policy” (keep rates restrictive).
Yet for all of these assertions from the Fed, the bond market does not believe the Fed will accomplish either part of its policy plan. Currently, the bond market expects the Fed to get to just 4.9% on its terminal rate (the highest rate reached during a tightening cycle) and to quickly pivot to accommodation and cuts in the back half of 2023, with more than 40 bps of cuts priced in to 2H23.
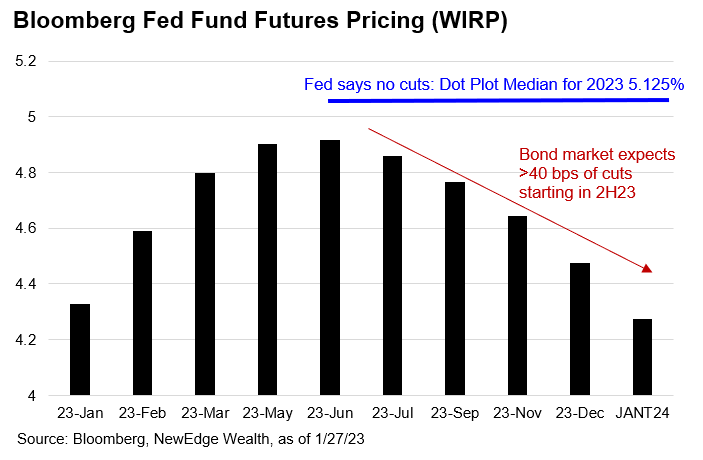
Next week the Fed meets for its first Federal Open Market Committee meeting of 2023. In addition to weighing recent economic data, the Fed will consider how much they want to push back against these market expectations in order to close this communication schism.
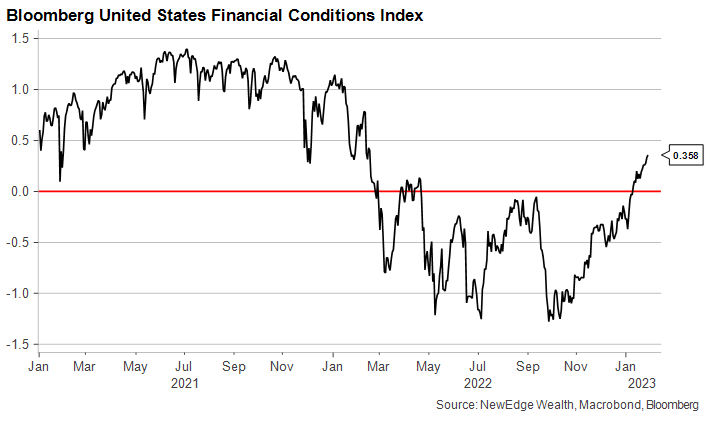
The challenge for the Fed is that as markets have become increasingly confident that the Fed will be more dovish and accommodative in late 2023, there has been a sharp easing, or loosening, in financial conditions indices.
Financial conditions indices are a compilation of equity valuations, credit spreads, interest rates, currencies, and volatility. The Fed considers financial conditions to be the primary mechanism that monetary policy impacts the economy, meaning easy/loose financial conditions are stimulative, while tight financial conditions are restrictive. Said another way, the Fed would be concerned that easy financial conditions could spur both higher growth and higher inflation.
Given the recent rallies in stocks and bonds, along with the fall in the USD, financial conditions have eased materially. In fact, the Bloomberg Financial Conditions Index is now higher/easier than when the Fed started raising rates in March of 2022.
Some may argue that moderation in inflation in recent months could reduce the urgency that the Fed has in talking financial conditions lower/tighter (meaning, the Fed talked its toughest when inflation was its highest in the late summer 2022).
But we shouldn’t get ahead of ourselves in thinking that the Fed does not still have an inflation fight to fight.
We see potential for a reacceleration in month-over-month (MoM) headline inflation, which could revive the Fed’s hawkish tone and result in a re-tightening of financial conditions, as markets begin to believe the Fed’s guidance that it will not cut rates in 2023.
The key source of moderating inflation, or disinflation, in 2H22 was falling energy prices. In 2H22, Oil prices went from a peak of $122/barrel in June to $71 in December, while gasoline prices fell from a peak of $5.00/gallon in June to $3.10 in December.
The red bars in the chart below show how energy prices went from contributing to inflation in 1H22, to being the largest source of lower inflation in 2H22. In fact, without the benefit from falling energy prices, multiple months, including the most recent data from December 2022, would have seen accelerating MoM inflation.
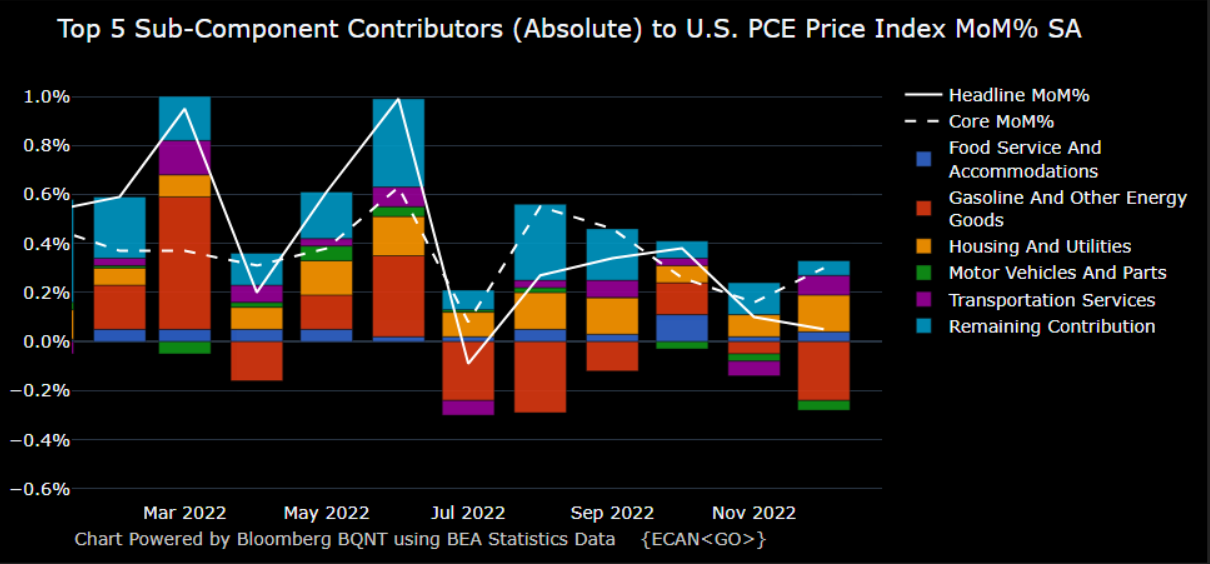
But this disinflation tailwind of falling energy prices could be fading as we start 2023.
Gasoline prices are +12% in the last three weeks, the largest increase since the June 2022 peak. Oil prices have climbed +12% as well since mid-December.
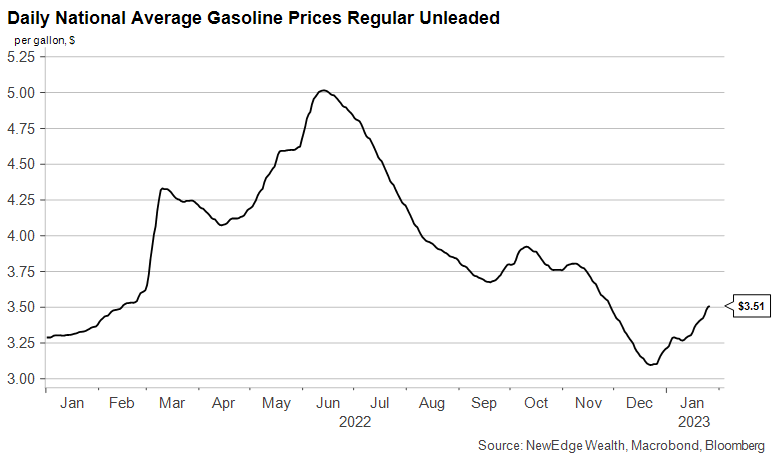
If oil and gasoline prices continue to climb, we could see a reacceleration in MoM inflation readings. In this scenario of faster monthly inflation, the Fed would presumably regain its urgency in reiterating its rate path (higher for longer) and talking tough against easy financial conditions.
This scenario could close the schism between the hawkish Fed and dovish bond market, as the bond market would likely begin to unwind its rate-cut bets from 2H23.
So, keep your eye on oil and gasoline prices, as they could be the driver that forces the bond market to not only hear, but also listen to the Fed.
Top Points for the Week
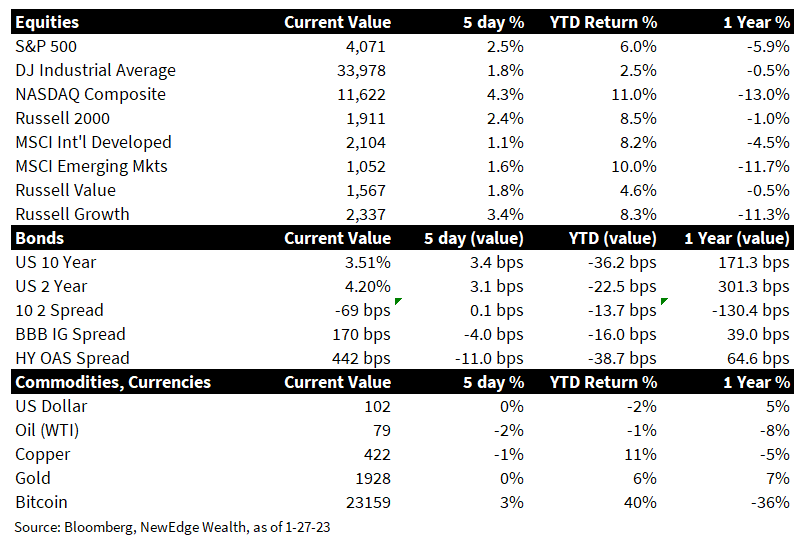
1. Stocks Recover with Growth Leading: Global equities rallied on the week with the best gains Growth and Technology shares in the US. The NASDAQ had its best week since November 2022. The S&P 500 also spent its first full week above its 200-day moving average since March of 2022, sparking hopes that the worst of the bear market is over. The next important and powerful level of resistance for the S&P 500 is 4,100, which is the 65-day high.
2. Bond Yields Rise, USD flat, Oil falls slightly: Bond yields rose slightly during the week on the back of better economic data, while the USD was flat and oil fell slightly.
3. U.S. Earnings Season: Nearly 30% of the S&P 500 has now reported 4Q22 earnings, with 51% of companies beating on sales and 70% of companies beating on earnings. Stocks have responded favorably to earnings beats in all sectors except for defensives, with broadly negative reactions from Utilities, Consumer Staples, and Health Care. This could reflect the more risk-on, pro-cyclical tone of recent trading.
4. Valuation Party: The source of upside in U.S. equity markets has been valuation driven, with the multiple on the S&P 500 +8% in 2023 to 18.1x forward. This is just shy of the pre-pandemic peaks in valuation seen in early 2018 and early 2020. The NASDAQ traded up to 25.5x forward, above its pre-pandemic peak. This valuation expansion is fueled by hopeful expectations for a pivot to more dovish policy.
5. 4Q22 GDP Shows the U.S. Economy is Not Falling Off a Cliff: Preliminary 4Q22 GDP data came in better than expectations (+2.9% vs. +2.6% consensus). Consumer spending came in below expectations (+2.1% vs. +2.9% consensus), while inventories, trade, and government spending were sources of upside. Under the surface, the report was not as strong, with the “core GDP”, called the “real final sales to domestic purchasers”, coming in at just +1%, the slowest pace since 2010, outside of the pandemic.
6. Jobless Claims Fall Again: Initial jobless claims fell again last week to 186k vs. 192k the prior week. The broad U.S. labor market remains tight and healthy, despite continued headlines about layoffs in the tech sector. The reason for broad labor resilience could be delays in the layoffs being executed, plus the ability for fired workers to find new work given still-plentiful job openings (JOLTS data show 3 million more job openings today versus the pre-pandemic peak).
7. The Fed’s Preferred Inflation Metric In-Line with Expectations: The PCE (personal consumption expenditures) price index came in line with expectations for both Headline (+5%) and Core ex-food & energy (+4.4%). The month-over-month (MoM) data benefited from a drop in energy and auto prices. Other components of the index, including services and housing, accelerated MoM. Thanks to moderating inflation, the market is pricing in 25 bps for next week’s Fed rate hike, a further moderation in pace after December’s 50 bps.
8. Housing Stabilizing: Thanks to the recent fall in mortgage rates (Bankrate.com 30 Year Mortgage down from 7.45% in November to 6.35% today), housing data has been stabilizing, with pending home sales +2.5% in December vs. expectations for a -1% decline.
9. Japan Inflation Surprises to the Upside: Inflation in Tokyo continued its run of surprising to the upside, with Tokyo CPI +4.4% vs. +4% consensus and +3.9% prior. Higher inflation continues to ignite speculation that Japan will have to step away from its still-easy monetary policy of yield curve control. The Japanese Yen appreciated in response to the higher inflation, putting further downward pressure on the USD.
10. Coming Up Next Week: Fed week is upon us, with the Fed meeting Tuesday-Wednesday and hosting a press conference Wednesday afternoon. Manufacturing data with the ISM Manufacturing PMI is released on Wednesday, with Jobs Day Friday (including nonfarm payrolls, unemployment rate, and average hourly earnings). Earnings season continues in the U.S., with over 100 S&P 500 names reporting, including some “big tech” names.
IMPORTANT DISCLOSURES
Abbreviations: 10 2 spread: 10-2 Year Treasury Yield Spread; CPI: Consumer Price Index; ISM Manufacturing PMI: Institute for Supply Management Purchasing Managers Index; JOLTS: Job Openings and Labor Turnover Survey; PCE: personal consumption expenditures.
Index Information: All returns represent total return for stated period. S&P 500 is a total return index that reflects both changes in the prices of stocks in the S&P 500 Index as well as the reinvestment of the dividend income from its underlying stocks. Dow Jones Industrial Average (DJ Industrial Average) is a price-weighted average of 30 actively traded blue-chip stocks trading New York Stock Exchange and Nasdaq. The NASDAQ Composite Index measures all NASDAQ domestic and international based common type stocks listed on the Nasdaq Stock Market. Russell 2000 is an index that measures the performance of the small-cap segment of the U.S. equity universe. MSCI International Developed measures equity market performance of large, developed markets not including the U.S. MSCI Emerging Markets (MSCI Emerging Mkts) measures equity market performance of emerging markets. Russell 1000 Growth Index measures the performance of the large- cap growth segment of the US equity universe. It includes those Russell 1000 companies with relatively higher price-to-book ratios, higher I/B/E/S forecast medium term (2 year) growth and higher sales per share historical growth (5 years). The Russell 1000 Value Index measures the performance of the large cap value segment of the US equity universe. It includes those Russell 1000 companies with relatively lower price-to-book ratios, lower I/B/E/S forecast medium term (2 year) growth and lower sales per share historical growth (5 years). The “BBB IG Spread” is the Bloomberg Baa Corporate Index that measures the spread of BBB/Baa U.S. corporate bond yields over Treasuries. The HY OAS is the High Yield Option Adjusted Spread index measuring the spread of high yield bonds over Treasuries. The Empire Fed Manufacturing Survey is a monthly survey of manufacturers in New York State conducted by the Federal Reserve Bank of New York with readings above 50 signaling expansion and below 50 contractions.
The views and opinions included in these materials belong to their author and do not necessarily reflect the views and opinions of NewEdge Capital Group, LLC.
This information is general in nature and has been prepared solely for informational and educational purposes and does not constitute an offer or a recommendation to buy or sell any particular security or to adopt any specific investment strategy.
NewEdge and its affiliates do not render advice on legal, tax and/or tax accounting matters. You should consult your personal tax and/or legal advisor to learn about any potential tax or other implications that may result from acting on a particular recommendation.
The trademarks and service marks contained herein are the property of their respective owners. Unless otherwise specifically indicated, all information with respect to any third party not affiliated with NewEdge has been provided by, and is the sole responsibility of, such third party and has not been independently verified by NewEdge, its affiliates or any other independent third party. No representation is given with respect to its accuracy or completeness, and such information and opinions may change without notice.
Investing involves risk, including possible loss of principal. Past performance is no guarantee of future results.
Any forward-looking statements or forecasts are based on assumptions and actual results are expected to vary from any such statements or forecasts. No assurance can be given that investment objectives or target returns will be achieved. Future returns may be higher or lower than the estimates presented herein.
An investment cannot be made directly in an index. Indices are unmanaged and have no fees or expenses. You can obtain information about many indices online at a variety of sources including: https://www.sec.gov/answers/indices.htm.
All data is subject to change without notice.
© 2026 NewEdge Capital Group, LLC

