


O ye’ll tak’ the high road, and I’ll tak’ the low road
“The Bonnie Banks o’ Loch Lomond”, Scottish song, 1876
Annual outlook season has begun in earnest on Wall Street. Strategists from around the Street have started publishing their predictions for the S&P 500 next year, and though there are ample critiques about using single point estimates for markets (mostly because it ignores the path that markets can take over the course of the year), it is helpful to understand the logic and drivers behind these different takes on the market.
Much like the separated Scottish Highlander soldiers in the classic song Loch Lomond, we observe that some analysts have taken the high road (predicting a 10% or more increase in the S&P 500 next year), while others have taken the low road (predicting a 10% or more decline in the S&P 500 next year).
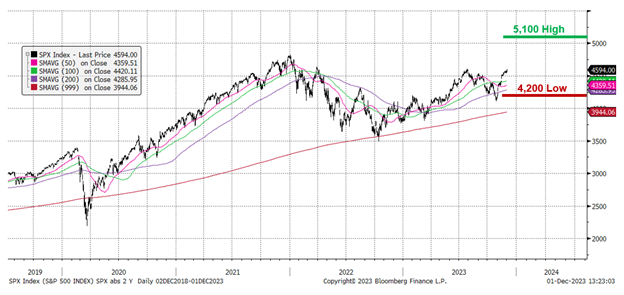
The current high road forecast is for 5,100 on the S&P 500 next year, while the low road forecast is for 4,200 on the S&P 500 next year. It is still early in the forecast season, so this range could widen further, however it is a helpful exercise to assess what would need to happen with both earnings and valuations, and all of their underlying drivers, in order to see either of these outcomes come to fruition.
S&P 500 and 2024 High and Low Scenarios
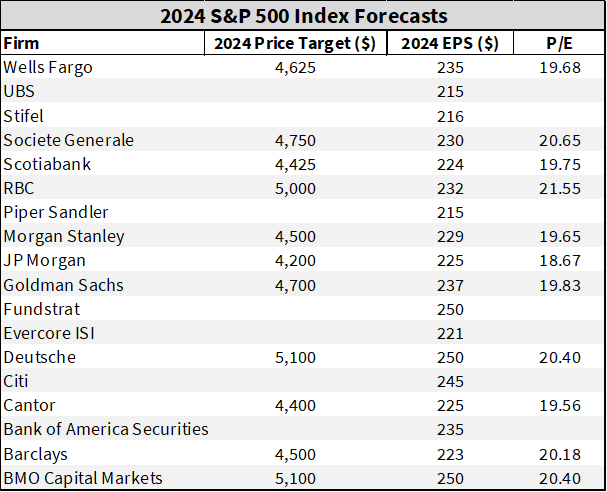
Before diving into these different scenarios, we note that the average of the 2024 forecasts is currently 4,663, about 2%+ up from the current level on the S&P 500. This is not an overly aggressive average, but this average consistently and notoriously misses the mark, usually forecasting little change to the index:
• In 2022, the average price target was ~4,825 (+1% from the 2021 close), but well above the 2022 close of 3,839
• In 2023, the average price target was ~4,080 (+6% from the 2022 close), but well below the current S&P level of 4,575
It is also important to note that bulls and bears haven’t changed sides much over the past few years. Those that are bulls today, were also bulls in 2022 (today’s 5,100 high road forecast was for 5,300 two years ago!), while those that are bears today were also likely to be bears in 2023 (though notably, the current Street low is 4,200 in 2024 from JP Morgan, who had the same target for 2023).
One last note is that for all this analysis, looking at the index level will likely continue to be misleading next year. Looking at indices masks great divergence in performance of stocks and sectors under the surface, just as we have experienced in 2022 and 2023.
And with all of those side notes, let’s dive into the current consensus and then the high road and low road scenarios.
Current Consensus Forecasts
Current Bloomberg consensus forecasts for earnings per share (EPS) of the S&P 500 are:
2024 EPS of $243 (+10% YoY)
• Includes an acceleration to +5% revenue growth and a return to record operating margins (Bloomberg Intelligence data.)
2025 EPS of $269 (+11% YoY)
• Includes a continuation of +5% revenue growth and new all-time-high operating margins.
Looking at these consensus EPS forecasts, analysts are not forecasting a recession in either 2024 or 2025, with healthy earnings growth fueled by both top line revenue growth and margin expansion in both years.
With these earnings forecasts and the current ~4,575 level of the S&P 500, the forward valuation of the S&P is:
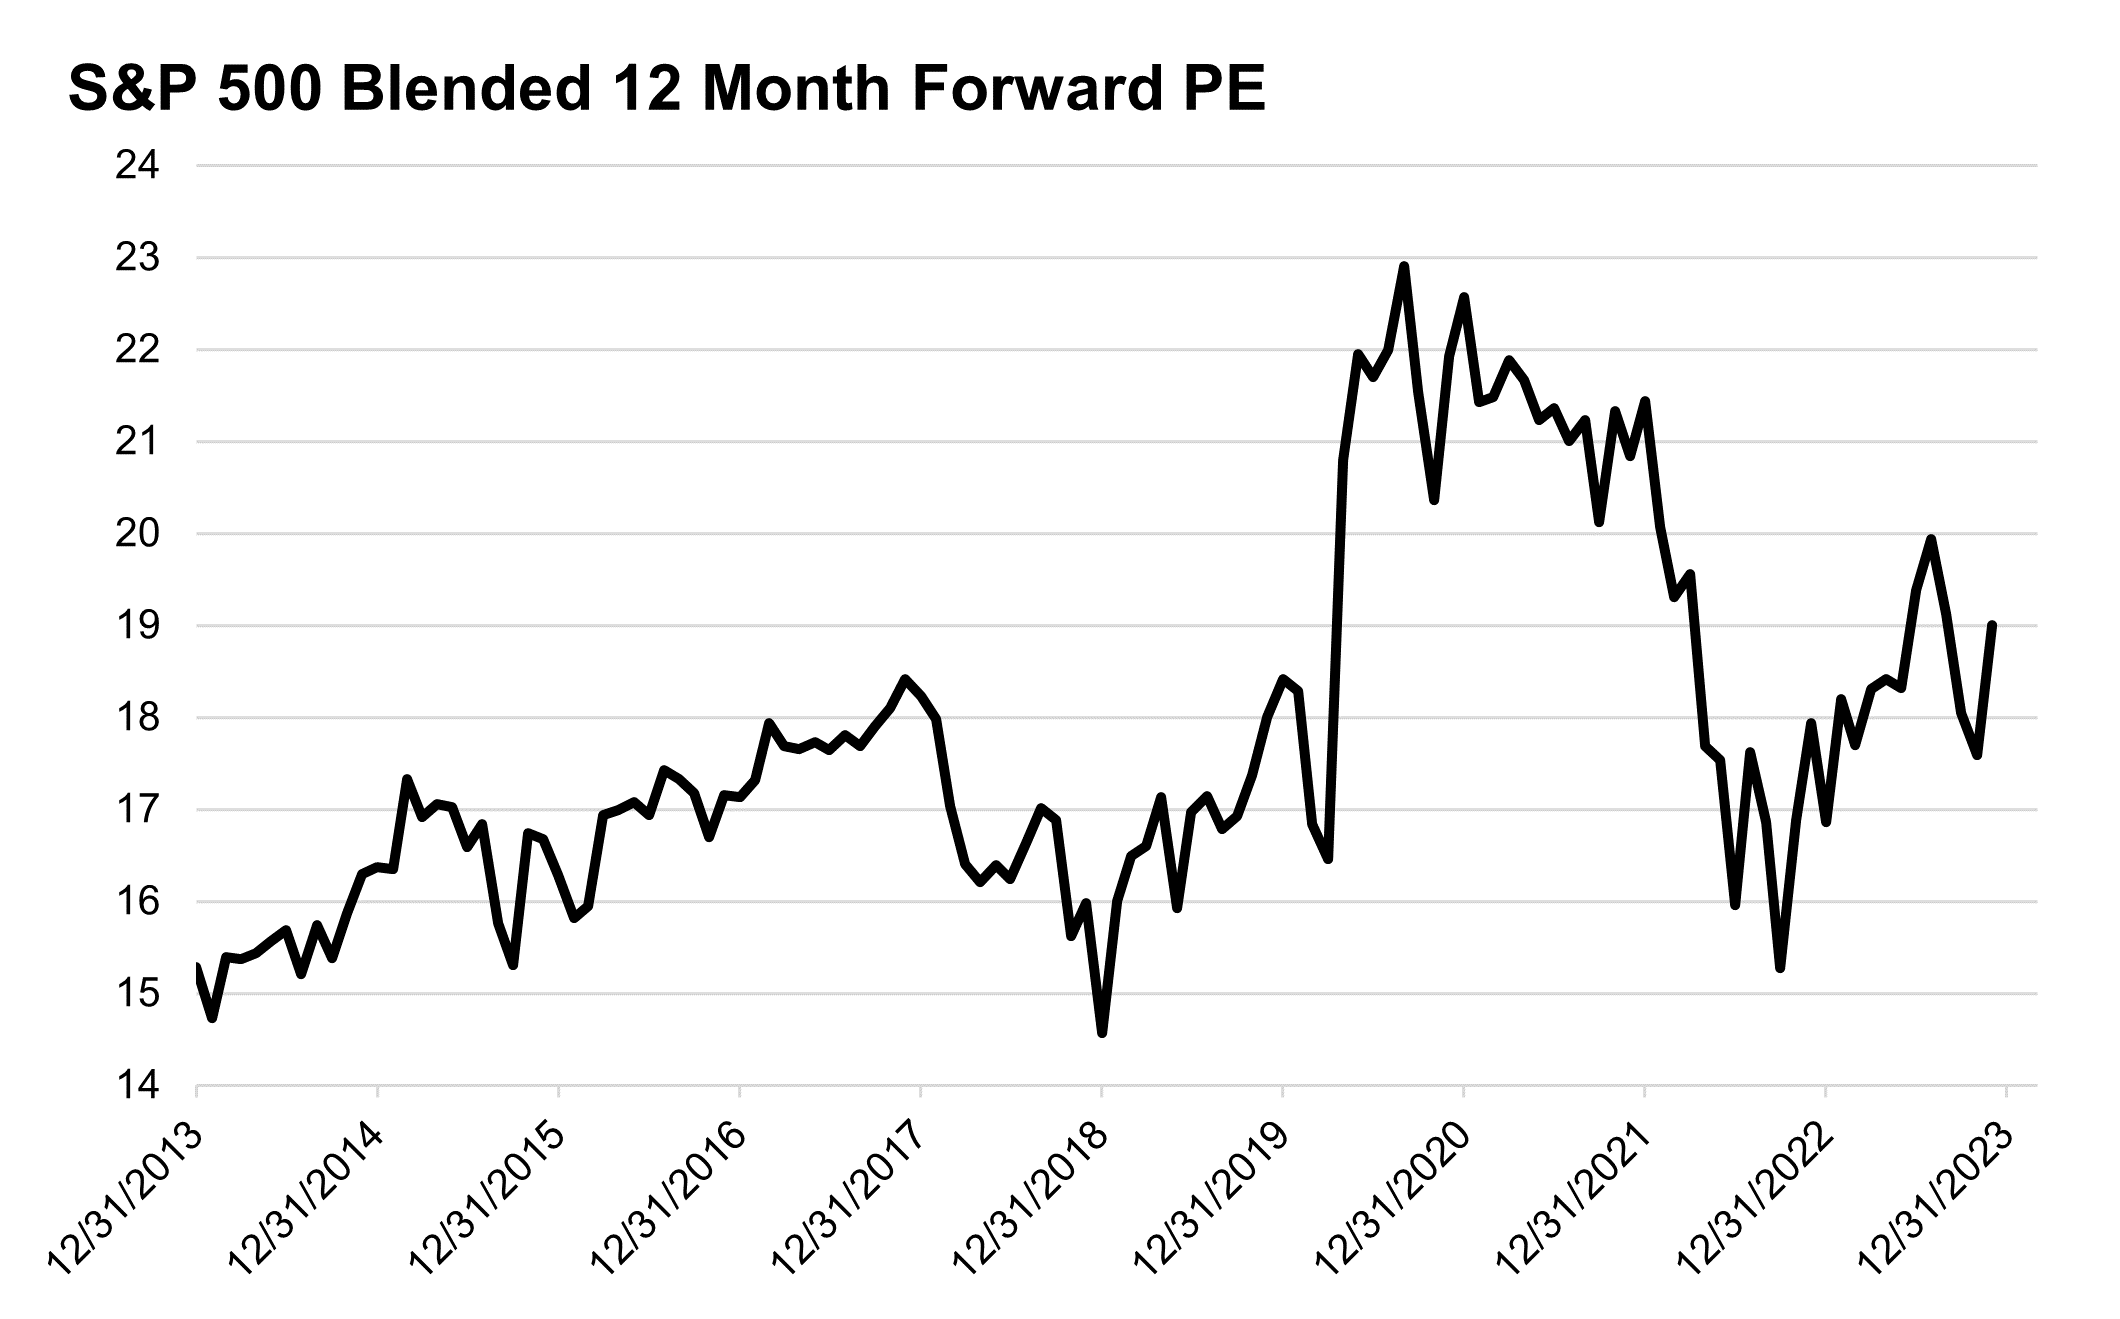
19x blended twelve months forward
• This forward multiple is about the 18.5x peak reached prior to the pandemic in early 2018 and 2020.
• Note the S&P 500 traded up to 23x forward in the summer of 2H20 when markets were pricing in depressed earnings in 2020 (-15%) that would rebound in 2021, unprecedented fiscal stimulus, and unprecedented monetary stimulus (deeply negative real interest rates, huge balance sheet expansion, and policy rates at 0%.)
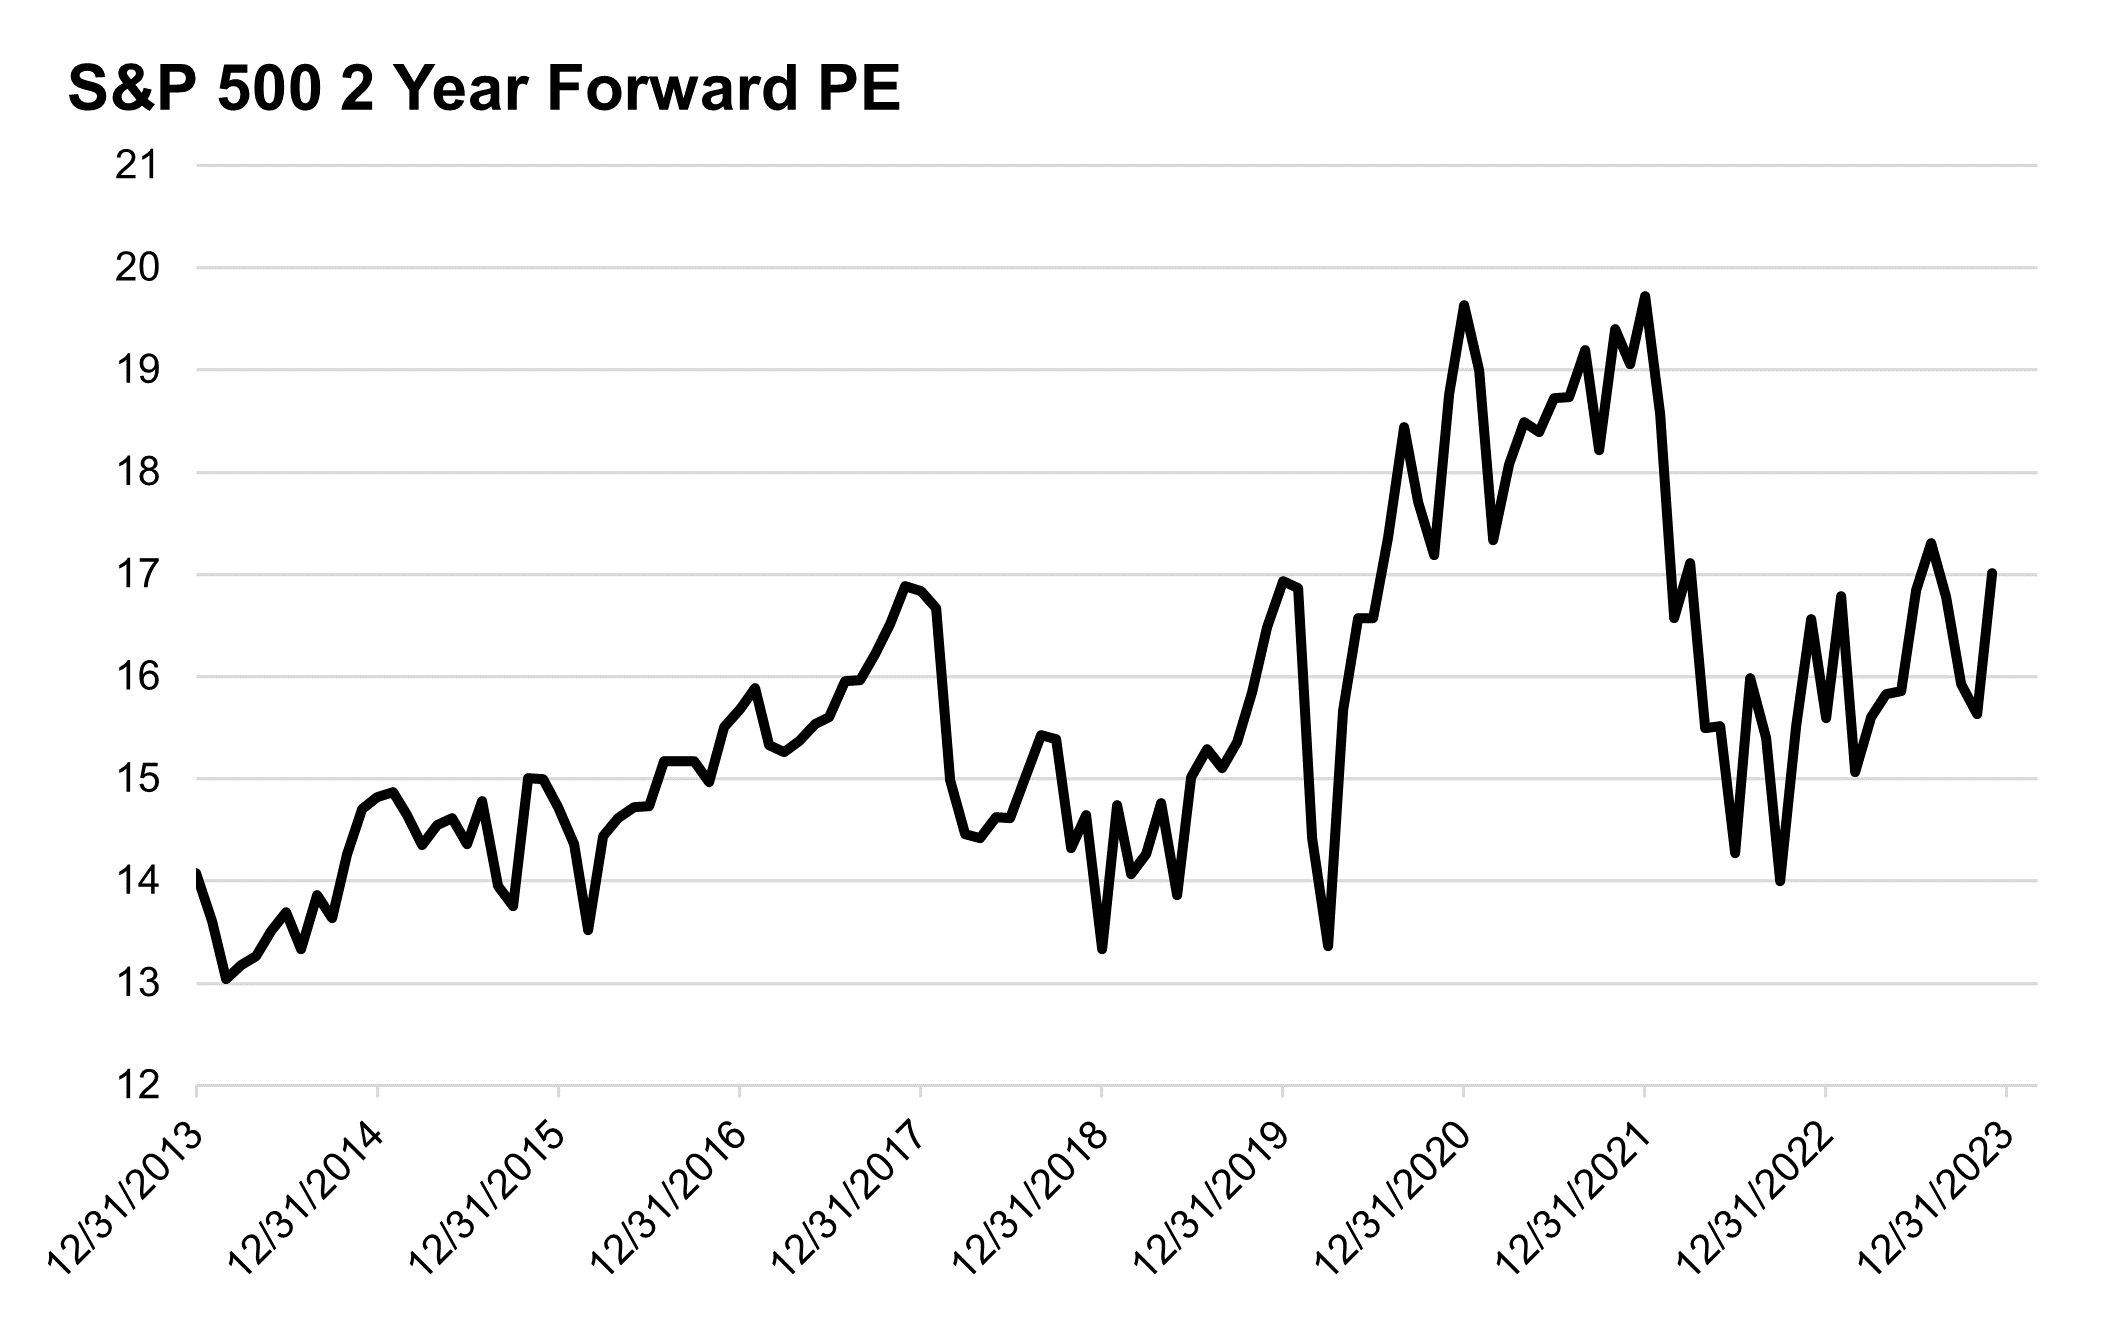
17x two years forward
• This 2 year forward multiple is back at the peak reached prior to the pandemic in early 2018 and 2020.
• We continuously ask if there are arguments for a sustained “paradigm shift” higher in valuations that could justify trading back to pandemic era multiples without the pandemic era support but have yet to find enough “this time is different” evidence to suggest that multiples that elevated could be sustained without risks to future return potential.
Overall, this is a relatively optimistic outlook for earnings, given no recession priced in and double-digit growth for the next two years, while valuations are at the very high end of pre-pandemic ranges. Of course, 2023 has taught us the lesson that “anything is possible”, so we must consider drivers like positioning and liquidity in determining if, at least in the short term, valuations can defy prior ranges and macro relationships (such as with interest rates).
The High Road: 5,100 and beyond
Strategists projecting upside to 5,100 and beyond for the S&P are taking the current optimism of consensus and adding a few key assumptions.
First, they see greater upside to earnings in 2024 and 2025. Those with 5,100 price targets all have earnings forecasts of $250/sh for 2024, which would be +14% over 2023 and implies a higher base for growth into 2025. The rationale for more optimistic EPS outlooks include: increased capital deployment as companies boost stock repurchases, and greater margin expansion driven by technologies like artificial intelligence.
Second, these analysts see a sustainment of multiples at or above the pre-pandemic peaks in valuation. Assuming 5,100 at the end of 2024 implies a 20.5x current multiple on the $250/sh. Upside beyond 5,100 would then be driven by multiples being sustained back in pandemic-era bubble territory.
Our take:
• On earnings, there is a long history of reasons to be optimistic about companies’ ability to expand margins, even in tough operating environments. However, we are less optimistic that overall index margins can rebound to a new record high in 2024 due to fading pricing power and slower revenue growth. We have written extensively about how high nominal revenue growth, fueled by elevated inflation and strong pricing power, was the key driver behind 2021 and 2022’s record margins. As inflation and pricing power ebb, we see margin expansion as needing to come from tougher (yet doable!) sources, like operational efficiency.
◦ We are excited about the benefits of artificial intelligence to the global economy but are not yet seeing evidence that this technology alone is driving a step change higher in aggregate profit margins.
• On valuations, we have been surprised by the ability for the equity market to return to near-record valuations in 2023, despite the tighter Fed policy and higher interest rate backdrop. Liquidity has been an unexpected tailwind for valuations this year, as has positioning, with investors caring less about valuations as they shifted from being “underweight” to start the year to relatively “overweight” in today’s positioning surveys.
◦ A melt-up, positioning chase is certainly possible if markets get excited about an easier Fed against a backdrop of resilient economic and earnings growth, which could drive valuations back to pandemic-era, bubbly ranges.
◦ History suggests that if valuations were to reach these very elevated levels again, they will be difficult to maintain (a lot of good news will have been priced in), while medium-term forward returns could be challenged.
◦ We see less room for valuation upside in 2024 compared to 2023, given valuations have already expanded +25% from the October 2022 lows and are back near prior peaks, while positioning has already shifted from being deeply underweight to start 2023 to now being overweight (though not as stretched as the start of 2022).
The Low Road: 4,200
Strategists projecting downside to 4,200 have a less optimistic outlook for both earnings and valuations.
For example, JP Morgan expects muted earnings growth of 2-3% next year to just $225/sh. If this materializes, this would be the third year in a row that S&P 500 EPS was near $220/sh!
The lackluster earnings growth is due to disinflation and slowing global growth, resulting in waning pricing power that keeps both revenue growth and margin expansion muted. Notably, this is not a recessionary outcome (earnings have typically declined 5-20% in a recession), but instead a deceleration outcome.
With a 4,200 price target on $225, this implies a PE multiple of 18.7x, which if this were to be reached by the end of 2024 would be in line with an “average” current year multiple. During recent times of recession fears, markets traded down to 16x current year earnings.
Our take:
• On earnings, we agree that slower growth and disinflation could create an interesting headwind for corporate earnings growth in 2024, while a recession could result in an even more muted earnings outcome. However, the ability for companies to find operational efficiency in this environment is the wild card for upside to these earnings estimates, though. Further, easier year-over-year comparisons given 2023’s earnings and margin declines could set up for better growth.
• On valuation, to revert back to average multiples would likely need a catalyst, such as an earnings revision downcycle, an unexpected resurgence of Fed hawkishness/higher interest rates, or an increase in risk-aversion caused by factors like growth uncertainty or heightened volatility. We will watch positioning metrics, as a movement from overweight back to neutral would likely coincide with this kind of valuation normalization.
• The JP Morgan analysts also flag the concentration of the S&P 500 as a key risk, with less potential for the 493 stocks in the S&P 500 outside of the Magnificent 7 to be a key driver of earnings upside. To add to this, we note the Magnificent 7 has generated average earnings growth this year of +185%. This decelerates to just +26% next year, meaning large weights in the S&P 500 will not have the same kind of idiosyncratic contribution to overall earnings growth.
Conclusion
After a year full of surprises in 2023, both of these high road and low road estimates look somewhat reasonable, with a distinct possibility that they could both be achieved (such as a “melt-up” to start the year, followed by a correction as a 2025 recession comes into view; or a weaker start to the year given election-year seasonality, and then a late year rally).
This unsatisfying “anything is possible” backdrop demands that investors remain disciplined about factors like positioning, sentiment, valuation, and growth expectations. If all of these factors become stretched/overly optimistic, the bar becomes high for upside surprises (like early 2022), while if these factors become depressed/overly pessimistic, the bar is lowered (like early 2023).
The outcome for the S&P 500 is highly dependent on the outlook for the U.S. economy, with factors like unemployment and recession risk being the most important watch items, as they will drive the future path for both earnings and risk appetite.
We will be providing our 2024 outlook at the start of the new year, so until then, we’ll continue to monitor the High Road and the Low Road (possibly while donning a kilt!).
Top Points of the Week
By Austin Capasso and Ben Lope
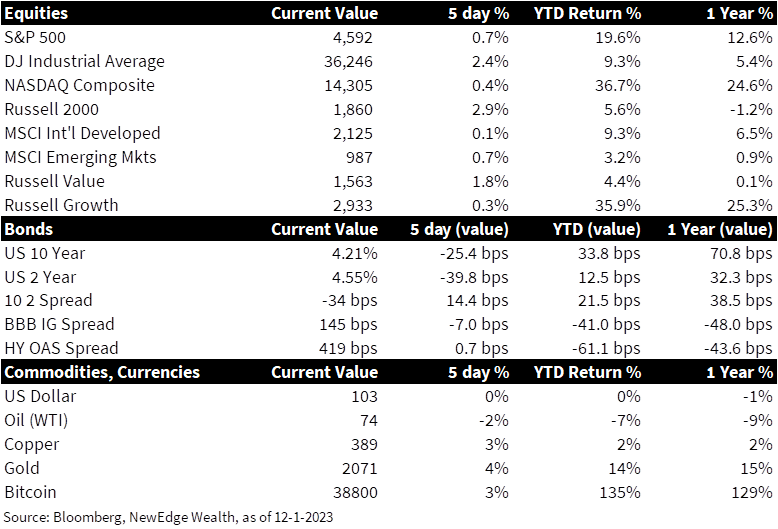
1. Equities Show Strength in November – The month of November is on pace to be the best month for global equities in 3 years (up 9%) and one of the 15 best months for the S&P500 in the last 50 years. TheDow Jones Index is finishing the week with its longest winning streak since 2021.
2. Rates Drop, Yield Curve Less Inverted – YieldsonTreasury bonds moved markedly lower on the week, with yields on shorter duration bonds outpacing that the of the drawdown on yields in longer dated bonds, resulting in the yield curve becoming less inverted. Yields on 2 year Treasury bonds fell nearly 40bps, while yields on 10 year Treasury bonds fell closer to 30bps. In conjunction these moves resulted in the 2-10 year yield curve becoming approximately 10bps less inverted.
3. Gold Hits Record High – Gold continued its march past $2,000/troy ounce toend the week just shy of $2,100, breaking through the precious metal’s previous record close of $2,069. Commodities analysts have attributed the rally in gold prices to widespread investor optimism regarding the Federal Reserve’s ability to navigate a “soft landing.”
4. Fed Speak This Week – We are starting to see a pretty big change in tone by Fed members Christopher Waller and Michelle Bowman. Waller, who has been hawkish for some time now, discussed the possibility for the Fed to lower rates in the next 3-5 months if inflation continues on this deflationary path. This had a particularly big impact on markets since Waller is a respected member on the board. Bowman is one of the last hawks standing among Fed members. She expressed her view to raise rates even more in order to reach the 2% inflation target in a timely way.
5. October PCE Report Release – Thecore personal consumption expenditures (PCE) Index, which is the Fed’s preferred measure of inflation, rose 0.2% for the month and 3.5% on a year-over-year basis, which were both in line with expectations. Personal income and spending both rose 0.2% on the month, also meeting estimates and indicating that consumers are keeping pace with inflation. The reading gives the Fed more incentive to hold rates steady in the next FOMC meeting and think about cutting rates for next year.
6. US GDP Grows Stronger Than Expected – US GDP in the third quarter grew at a 5.2% annualized pace, which was even stronger than the initially expected reading of 4.9%. This strong print was attributed to better than expected business investments and stronger government spending. Within the report, consumer spending saw a downward revision from 4.0% to 3.6%. We will continue to monitor any changes within the US consumer and any implications that it could have to the US economy.
7. German Inflation Eases – Inflation in Germany eased to 2.3% in November, which is the lowest level since June 2021 and below the forecasted 2.6%. The slowdown was attributed to a decline in energy prices after dropping 4.5% on a year-on-year basis. Inflation looks rather benign in the eurozone given weak demand and supply-side pressures remaining mild. Though Germany displays an economy sitting in recession and continues to struggle.
8. Eurozone Manufacturing PMI Rises – The manufacturing sector in the eurozone has struggled for most of the year. Contrast to that idea, the latest reading for November’s producer manufacturing index (PMI) saw a six month high at 44.2. A reading below 50 still indicates contraction, but it is a step in the right direction and the previous month’s reading.
9. Q3 S&P Earnings Review – Over 97% of S&P 500 companies have reported Q3 earnings, with the majority of companies beating analyst estimates for top and bottom line growth. 83% of companies beat estimated earnings growth forecasts, with the medium beat coming in at 7% above expectations. 60% of companies beat revenue estimates, with a median beat of 3%.
10. Important Week Ahead for Health of US Economy – The following week is a big one in terms of economic data. We will get insight into US consumer demand through factory orders, US S&P and ISM services PMI, US consumer credit, US consumer sentiment, the US jobs market which is the headliner for the week. Just as the Fed, we remain data dependent on incoming economic data and watch for any implications these releases have for markets.
IMPORTANT DISCLOSURES
Abbreviations/Definitions: Bowman: Michelle Bowman, a member of the Federal Reserve Board of Governors; Core PCE: personal consumption expenditures prices excluding food and energy prices; EPS: earnings per share; FOMC: Federal Open Market Committee; ISM Services PMI: The Institute of Supply Management (ISM) services PMI (formerly known as Non-Manufacturing Index) is an economic index based on surveys of more than 400 non-manufacturing (or services) firms’ purchasing and supply executives; PCE: personal consumption expenditures; PMI: Purchasing Managers’ Index; Waller: Christopher Waller, member of the Federal Reserve Board of Governors.
Index Information: All returns represent total return for stated period. S&P 500 is a total return index that reflects both changes in the prices of stocks in the S&P 500 Index as well as the reinvestment of the dividend income from its underlying stocks. Dow Jones Industrial Average (DJ Industrial Average) is a price-weighted average of 30 actively traded blue-chip stocks trading New York Stock Exchange and Nasdaq. The NASDAQ Composite Index measures all NASDAQ domestic and international based common type stocks listed on the Nasdaq Stock Market. Russell 2000 is an index that measures the performance of the small-cap segment of the U.S. equity universe. MSCI International Developed measures equity market performance of large, developed markets not including the U.S. MSCI Emerging Markets (MSCI Emerging Mkts) measures equity market performance of emerging markets. Russell 1000 Growth Index measures the performance of the large- cap growth segment of the US equity universe. It includes those Russell 1000 companies with relatively higher price-to-book ratios, higher I/B/E/S forecast medium term (2 year) growth and higher sales per share historical growth (5 years). The Russell 1000 Value Index measures the performance of the large cap value segment of the US equity universe. It includes those Russell 1000 companies with relatively lower price-to-book ratios, lower I/B/E/S forecast medium term (2 year) growth and lower sales per share historical growth (5 years). The BBB IG Spread is the Bloomberg Baa Corporate Index that measures the spread of BBB/Baa U.S. corporate bond yields over Treasuries. The HY OAS is the High Yield Option Adjusted Spread index measuring the spread of high yield bonds over Treasuries.
Sector Returns: Sectors are based on the GICS methodology. Returns are cumulative total return for stated period, including reinvestment of dividends.
The views and opinions included in these materials belong to their author and do not necessarily reflect the views and opinions of NewEdge Capital Group, LLC.
This information is general in nature and has been prepared solely for informational and educational purposes and does not constitute an offer or a recommendation to buy or sell any particular security or to adopt any specific investment strategy.
NewEdge and its affiliates do not render advice on legal, tax and/or tax accounting matters. You should consult your personal tax and/or legal advisor to learn about any potential tax or other implications that may result from acting on a particular recommendation.
The trademarks and service marks contained herein are the property of their respective owners. Unless otherwise specifically indicated, all information with respect to any third party not affiliated with NewEdge has been provided by, and is the sole responsibility of, such third party and has not been independently verified by NewEdge, its affiliates or any other independent third party. No representation is given with respect to its accuracy or completeness, and such information and opinions may change without notice.
Investing involves risk, including possible loss of principal. Past performance is no guarantee of future results.
Any forward-looking statements or forecasts are based on assumptions and actual results are expected to vary from any such statements or forecasts. No assurance can be given that investment objectives or target returns will be achieved. Future returns may be higher or lower than the estimates presented herein.
An investment cannot be made directly in an index. Indices are unmanaged and have no fees or expenses. You can obtain information about many indices online at a variety of sources including: https://www.sec.gov/answers/indices.htm.
All data is subject to change without notice.
© 2026 NewEdge Capital Group, LLC

