


Like the myth of the “Ramblin’ Man”, whose rough-and-tumble, on-the-road lifestyle was described by the Allman Brothers Band in 1973, most S&P 500 companies and management teams continue to search for the good times while navigating a bumpy road and challenging environment for profit growth. Although “doin’ the best they can” may not satisfy equity investors at today’s valuations, the good news is that with over 80% of the index market capitalization having reported Q4 results, broad corporate earnings have thus far exceeded expectations and are building on their positive momentum from the prior quarter.
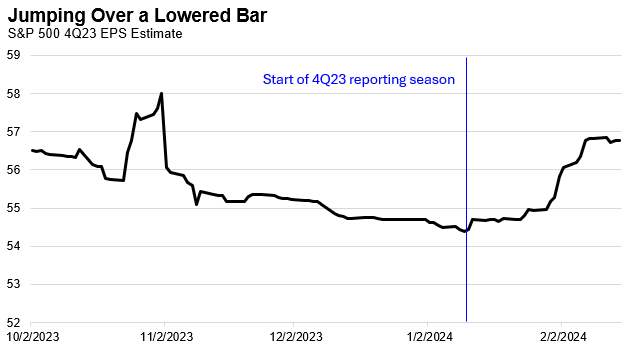
As of this week, aggregate fourth quarter earnings for the S&P 500 are on pace to rise 5% YoY, exceeding the 1% YoY growth estimates at the start of the quarter. This upside surprise has been primarily driven by healthy beats from some of the largest (most “magnificent”) index constituents. If these aggerate results hold, they will mark a sequential acceleration from the Q3 2023 growth and result in the highest quarterly profit growth since Q2 2022. Revenues have also exceeded expectations thus far, albeit at a more modest pace, rising 4% YoY, but nearly doubling the revenue growth rate of the prior quarter.
While the broad earnings results are encouraging, data below the surface paints a more mixed picture. It also helps explain why momentum among industry leaders remains well entrenched and why an increasingly narrow group of companies account for the majority of index returns.
To highlight this point, we examined five of the largest companies in the index (Microsoft, Nvidia*, Alphabet, Amazon, and Meta) and found that despite accounting for 22% of the overall index weight, they have generated more than 40% of the overall index dollar EPS in Q4. In addition, these companies, on average, produced an astounding 173% earnings growth YoY. Excluding the results from these companies, we would likely be discussing an ongoing earnings recession, illustrating how challenging the environment remains for most companies in the index and why performance continues to be concentrated among a handful of companies.
The Headlines
- Earnings Growth Continues to Exceed Estimates: Q4 earnings are on pace to rise 5% YoY and surpass expectations for the fifth consecutive quarter. In aggregate 75% of companies are beating estimates, in line with long-term averages, however the magnitude of earnings beats at 4% above consensus is about half the long-term average earnings beat.
- Revenue Growth Remains Lackluster: Q4 revenues are on pace to rise 4% YoY, slightly ahead of expectations but generally in line with the pace of inflation in the quarter, suggesting underlying demand is less robust and price increases in excess of CPI are becoming tougher to implement. Contrast this growth rate to the nearly 6% nominal GDP growth rate in the fourth quarter.
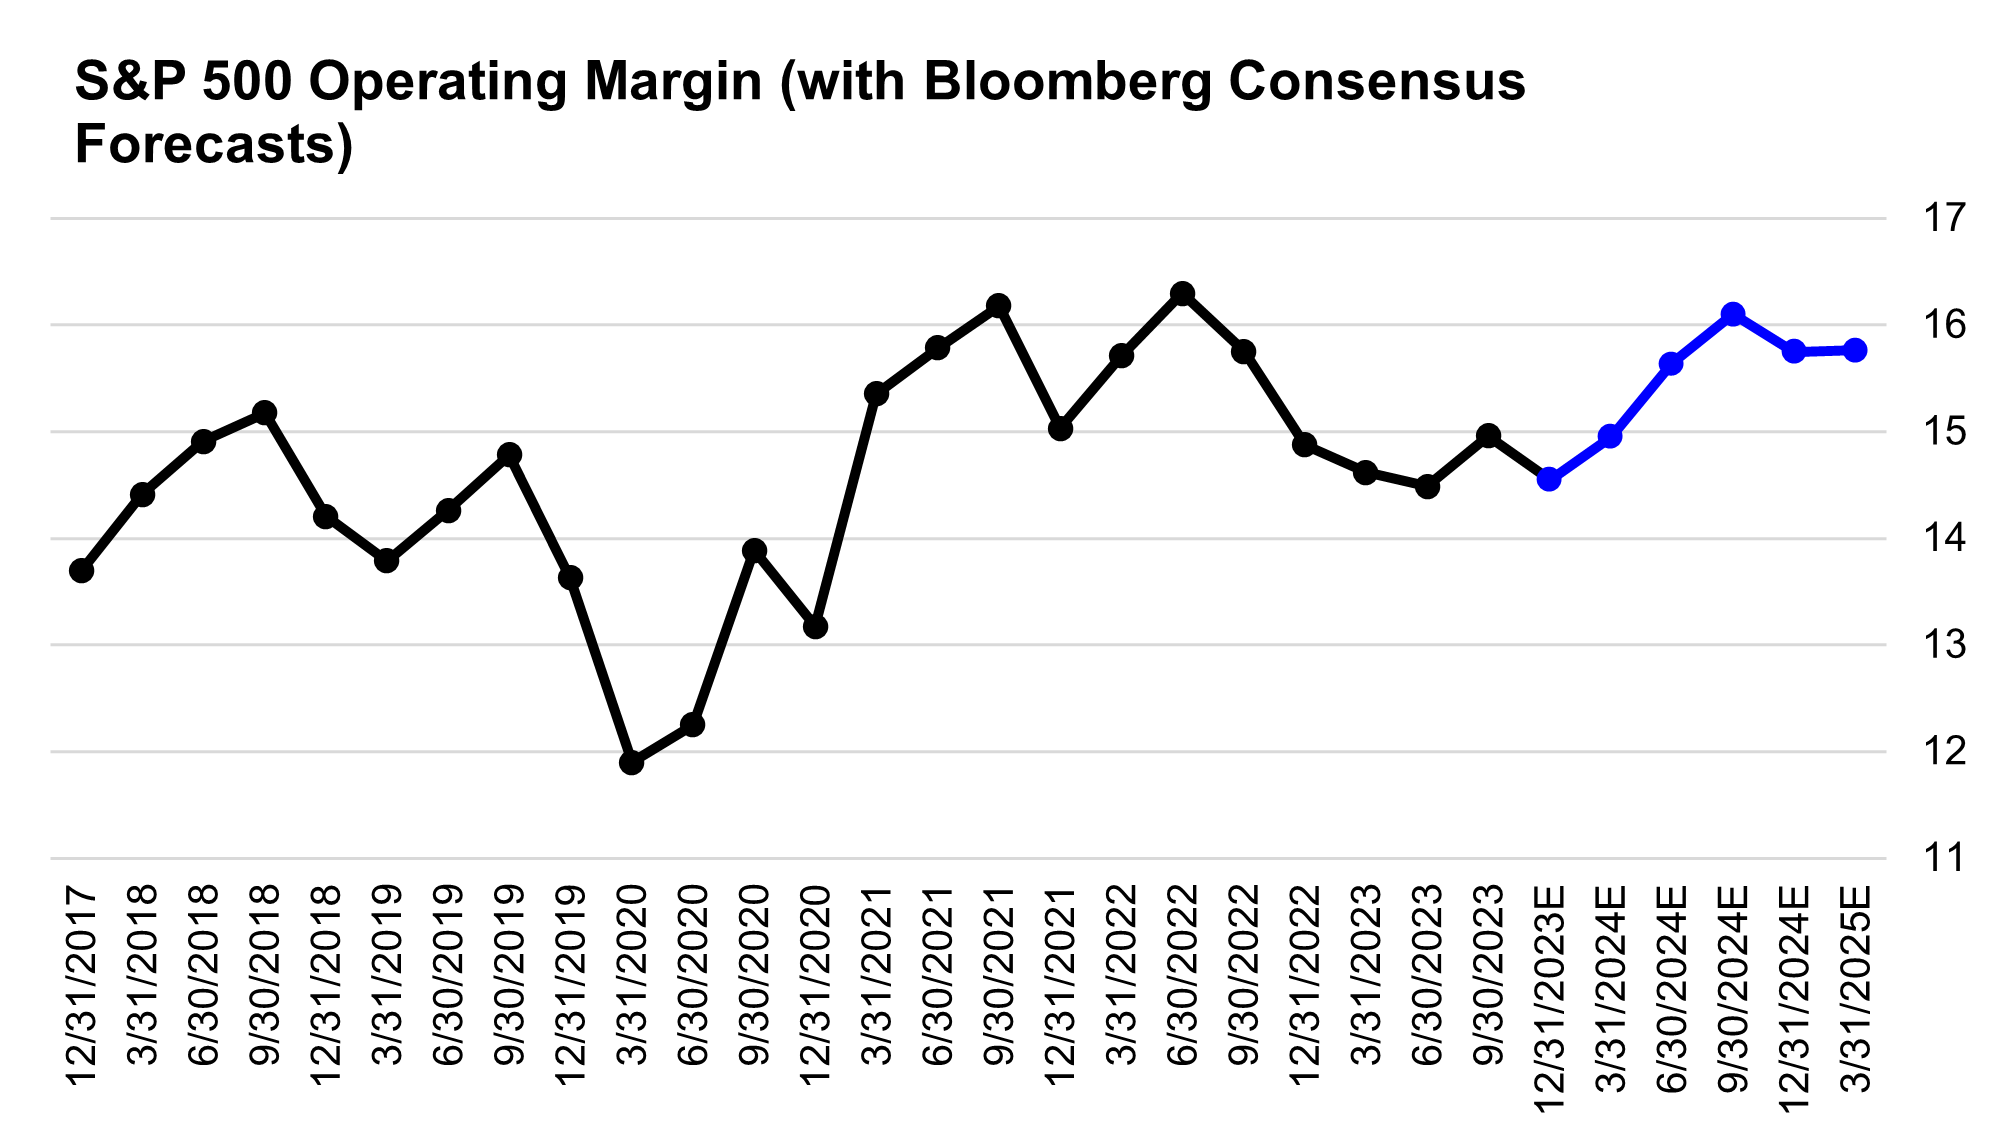
- Margins on Pace for Multi-Year Lows: Q4 operating margins are on pace to slide to 14.5%, a sequential decline from 15.0% quartering 3Q23 and down from 14.9% a year ago. Rising labor and input costs, along with fading pricing power, continue to heavily influence corporate profitability. If 14.5% is the average operating margin for Q4, it will market the lowest level of profitability since the fourth quarter of 2020.
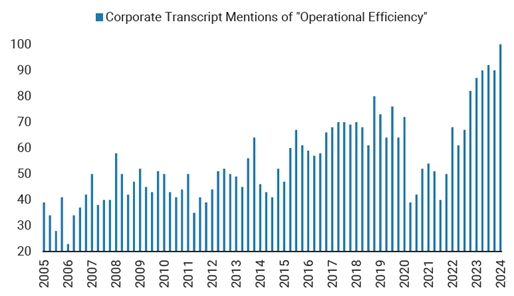
- Management Teams are focused on AI and Profitability: Thus far, we have seen a record high number of mentions of AI on corporate earnings calls, with over 90% of management teams mentioning the topic. The second most mentioned topic was “operational efficiency”, discussed by nearly 100% of management teams, which is clearly a priority in an environment of sluggish top line growth and declining margins.
Earnings & Revenue Growth: Beating (Low) Expectations
As we highlighted in our introduction, this earnings season has been a welcome surprise, with 5% YoY earnings growth that has thus far exceeded expectations. However, like the broader market, the largest companies in the index continue to be the primary driver of these positive results.
Notably, earnings expectations had also been revised lower by 8% entering the quarter, which is more than double the average downward revision, so in that context, it is less surprising to see earnings coming in ahead of expectations. Relative to history, results are also more modest, as the percentage of companies beating estimates is in line with the 10-year average of 75%, and the average earnings beat of 4% is below the 10-year average of 7%.
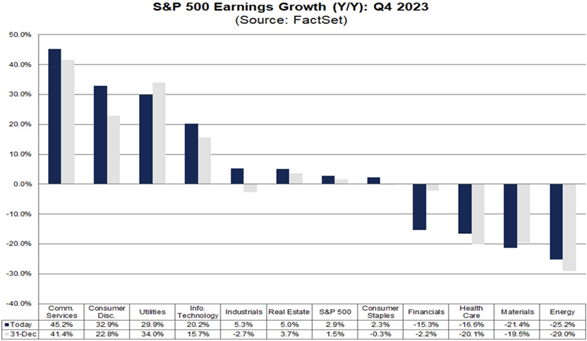
In aggregate, 7 of 11 sectors are on pace to deliver positive YoY earnings growth, matching the breadth from the prior quarter. Earnings growth at the sector level has been led by Communications +45% YoY, Discretionary +33% YoY, and Utilities +30% YoY. This growth is being offset by continued earnings declines in Healthcare -17% YoY, Materials -21% YoY, and Energy -25% YoY, three sectors that continue to see the greatest pressure on profitability.
Relative to expectations, three sectors have been substantial outperformers this quarter, measured by the percentage of companies beating estimates. In aggregate 91% of energy companies have exceeded earnings expectations, followed by technology at 85% and industrials at 84%.
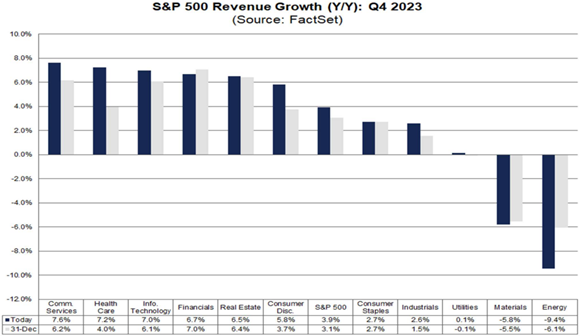
Revenues are on pace to rise 4% YoY, exceeding the 3% YoY growth expectations entering the quarter, and accelerating from the prior quarter’s 2% YoY growth. While these results are encouraging, they are slightly below the 10-year average revenue growth rate of 5%. In addition, relative to historical expectations revenue growth is on par with an average quarter. Thus far 65% of companies have reported revenues that are above expectations, and the average revenue beat has been 1.2%. Both metrics are in line with their 10-year averages.
In aggregate, 9 of 11 sectors are on pace to deliver positive YoY revenue growth, benefitting from accelerating economic growth in Q4, and representing an improvement in breadth from the prior quarter when 6 of 11 sectors delivered positive YoY revenue growth. Revenue growth this quarter has been led by the Communications, Healthcare, and Technology sectors, all of which are on pace to generate over 7% YoY growth. This growth has been offset by revenue declines in the energy sector -9% YoY, and the materials sector -6% YoY, as both sectors continue to face the headwind of lower commodity prices.
Margins: Profitability Remains Elusive
Fourth quarter 2023 index level operating margins are averaging 14.5%, weaker than the initial expectations of 14.6%, a sequential decline from 15.0% last quarter, and down from 14.9% a year ago.
In aggregate 8 of 9 sectors (excluding Financials and Real Estate) are on pace to post sequential operating margin declines, with Technology being the only sector posting a slight improvement in profitability. If 14.5% is the index level operating margin for the quarter, it will mark the lowest quarter of overall profitability since Q4 of 2020. Declining profitability continues to be driven by rising wage and input costs, higher borrowing costs, and fading pricing power, all of which are leading management teams to prioritize cost discipline, productivity, and seek operational efficiencies aimed at preserving margins (including layoffs).
Management Teams: Increasingly Focused on Efficiency
In reviewing quarterly earnings transcripts, we find a number of interesting takeaways that underscore the challenges to profitability we are seeing at the index level, while also illustrating how management teams are navigating the current environment.
This quarter has seen a record number of companies mention operational efficiency, artificial intelligence, and a soft landing (together mentioned by over 95% of companies). At the same time, mentions of borrowing costs, M&A, and layoffs are at multi-year highs.
Overall, it’s not surprising to see this shift in commentary at a time when operating margins are declining to multi-year lows, and it suggests we may see additional layoffs across industry groups and accelerating M&A in the months ahead. Large companies that have the ability to negotiate lower costs, offer differentiated products with inelastic pricing, and rely on minimal leverage/keep debt costs constraints are likely to continue to lead in this environment.
The Bumpy Road Ahead: Weaker Guidance and Lowered Expectations
Forward guidance is only offered by about a quarter of companies in the index, but thus far we have seen 71% of companies provide Q1 guidance that is lower than expected. The 10-year average for the percentage of companies issuing negative guidance has historically been 63% which suggests analyst estimates for Q1 S&P 500 earnings growth of 4% may be too high.
We have also seen downward revisions to full year earnings growth for the S&P 500 over the past several weeks of about 1%. Consensus bottom-up estimates now call for S&P 500 EPS of $243 in 2024 (roughly 9% growth YoY). The modest decline in earnings expectations for 2024 masks a wide dispersion under the surface, as the top five companies we highlighted in our introduction (Microsoft, Nvidia, Alphabet, Amazon, and Meta) have seen positive earnings revisions for 2024 averaging +7%. These companies account for 22% of the index weight and absent these names the downward revisions to index level EPS growth for 2024 would be even greater.
The following two charts look to illustrate this point, showing the progression of consensus earnings estimates for 2024 and 2025 since June 2023. As can be seen in the charts, estimates for the S&P 500 have been relatively flat, while estimates have been cut for the “average stock”, the S&P 500 Equal Weight Index. Making up this difference is the Magnificent 7 Index, where EPS estimates revisions have been magnificently positive (the index’s EPS estimates are up over 20% for both 2024 and 2025).


Closing Thoughts
Overall, we are encouraged by the results of the fourth quarter earnings season, even if these results are being driven by an increasingly narrow group of companies and are beating thanks to lowered expectations.
The earnings recession from the first half of 2023 appears to be in the rearview mirror, and the sequential improvement and continued momentum on the earnings trajectory certainly helps support today’s elevated market valuations. What is clear is that a meaningful earnings acceleration remains elusive in an environment of modest top line growth and continued pressures on corporate profitability, and that expectations of double-digit earnings growth in the back half of 2024 may need to be revised lower, which could then challenge elevated valuations. It is possible that management teams can execute on their goals of driving operational efficiency and continue to beat earnings expectations, however with potentially much of the low hanging fruit being picked, further efficiencies could be even harder to come by. It’s likely we will continue to see earnings leadership from a narrow group of large companies that have the scale and balance sheets to navigate this environment, until macro-economic conditions turn more supportive for a broader set of index constituents.
Top Points of the Week
By Austin Capasso and Ben Lope

1. Hot CPI Report – The Consumer Price Index (CPI) Report for January surprised to the upside, particularly on the Core CPI reading. Core CPI, which excludes volatile components of food and energy, accelerated 0.4% in January and up 3.9% from a year ago versus forecasts for 0.3% and 3.7%, respectively. Shelter prices, which comprise about one-third of the CPI weighting, accounted for the majority of the increase after rising 0.6% for the month. This puts the probability of a rate cut in May in doubt and it seems markets pulled back expectations to where the Fed wants. Although the disinflation may not be completely over (e.g., the gas component was quite negative), it underscores the resilience of the US economy and consumers.
2. US PPI Comes in Higher Than Expected – The Producer Price Index (PPI) for January came in stronger than expected on both the headline and core. Headline PPI on a monthly basis rose 0.3%, which is the biggest move since August 2023 and above the forecasted 0.1% increase. Core PPI, which excludes volatile components of food and energy, increased 0.5% on a monthly basis against expectations for a 0.1% gain. These results, just as the CPI reading, pared back investor’s expectations for a rate cut by the Fed as data comes in better than expected, resulting in a strong US consumer and economy.
3. Weaker US Retail Sales Report – Retail sales in January came in weaker than expected. Sales declined 0.8% on a monthly basis, which was the biggest drop in a year, although it should be taken with a grain of salt as January tends to be messy for retail sales given the weather and seasonality impacts to consumer spending. The control group component of retail sales, which is nominal and directly feeds into the US gross domestic product calculation, came in weaker than expected, down 0.4%.
4. The Week Ahead – Markets will be closed on Monday for President’s Day. Later in the week, we will get the January FOMC meeting Minutes and speeches from Fed President Raphael Bostic and other Fed members, which should give investors insight into the Fed’s mindset after the conflicting data this week.
*NVDA reflects Bloomberg consensus estimates. Q4 results will be posted on 2/21/24.
IMPORTANT DISCLOSURES
Abbreviations/Definitions: AI: artificial intelligence; Core CPI: measures the changes in the price of goods and services, excluding food and energy; Core PPI: measures the change in the selling price of goods and services sold by producers, excluding food and energy; CPI: Consumer Price Index; EPS: earnings per share; FOMC: Federal Open Market Committee; GDP: gross domestic product; PPI: Producer Price Index.
Index Information: All returns represent total return for stated period. S&P 500 is a total return index that reflects both changes in the prices of stocks in the S&P 500 Index as well as the reinvestment of the dividend income from its underlying stocks. Dow Jones Industrial Average (DJ Industrial Average) is a price-weighted average of 30 actively traded blue-chip stocks trading New York Stock Exchange and Nasdaq. The NASDAQ Composite Index measures all NASDAQ domestic and international based common type stocks listed on the Nasdaq Stock Market. Russell 2000 is an index that measures the performance of the small-cap segment of the U.S. equity universe. MSCI International Developed measures equity market performance of large, developed markets not including the U.S. MSCI Emerging Markets (MSCI Emerging Mkts) measures equity market performance of emerging markets. Russell 1000 Growth Index measures the performance of the large- cap growth segment of the US equity universe. It includes those Russell 1000 companies with relatively higher price-to-book ratios, higher I/B/E/S forecast medium term (2 year) growth and higher sales per share historical growth (5 years). The Russell 1000 Value Index measures the performance of the large cap value segment of the US equity universe. It includes those Russell 1000 companies with relatively lower price-to-book ratios, lower I/B/E/S forecast medium term (2 year) growth and lower sales per share historical growth (5 years). The BBB IG Spread is the Bloomberg Baa Corporate Index that measures the spread of BBB/Baa U.S. corporate bond yields over Treasuries. The HY OAS is the High Yield Option Adjusted Spread index measuring the spread of high yield bonds over Treasuries.
Sector Returns: Sectors are based on the GICS methodology. Returns are cumulative total return for stated period, including reinvestment of dividends.
The views and opinions included in these materials belong to their author and do not necessarily reflect the views and opinions of NewEdge Capital Group, LLC.
This information is general in nature and has been prepared solely for informational and educational purposes and does not constitute an offer or a recommendation to buy or sell any particular security or to adopt any specific investment strategy.
NewEdge and its affiliates do not render advice on legal, tax and/or tax accounting matters. You should consult your personal tax and/or legal advisor to learn about any potential tax or other implications that may result from acting on a particular recommendation.
The trademarks and service marks contained herein are the property of their respective owners. Unless otherwise specifically indicated, all information with respect to any third party not affiliated with NewEdge has been provided by, and is the sole responsibility of, such third party and has not been independently verified by NewEdge, its affiliates or any other independent third party. No representation is given with respect to its accuracy or completeness, and such information and opinions may change without notice.
Investing involves risk, including possible loss of principal. Past performance is no guarantee of future results.
Any forward-looking statements or forecasts are based on assumptions and actual results are expected to vary from any such statements or forecasts. No assurance can be given that investment objectives or target returns will be achieved. Future returns may be higher or lower than the estimates presented herein.
An investment cannot be made directly in an index. Indices are unmanaged and have no fees or expenses. You can obtain information about many indices online at a variety of sources including: https://www.sec.gov/answers/indices.htm.
All data is subject to change without notice.
© 2026 NewEdge Capital Group, LLC

