

Weekly Summary: January 30 – February 3
Key Observations:
- Similar to last week, we believe that this week’s financial market movements showed the importance of stock selectivity across many sectors and the benefits of maintaining a globally well-diversified portfolio for long-term investors in a volatile U.S. equity environment that continues to show a great resiliency – so far. The Federal Reserve’s (Fed) dovishness as expressed by Fed chair Powell’s statements this week served to further enhance U.S. stock market gains that appeared to be precipitated by Tuesday’s lower than expected Employment Cost Index (ECI). Among the many examples of Powell’s dovishness was that he no longer seemed very concerned about the easing of financial conditions recently. He even indicated the Fed’s focus was not on short term movements in financial conditions.
- As we highlighted in last week’s commentary, the Bank of Canada (BOC) was the first major central bank (CB) to indicate a “pause” in its rate hikes. It appears that other major CBs this week have become more dovish as well. We have stressed previously that the focus of financial markets this year could swing from inflation and interest rate concerns on the one hand and concerns of economic slowdowns and even recession risks on the other. We thought that the rallies of U.S. stocks largely in reaction to lower than expected ECI and a more dovish Fed were prime examples of the market focusing on lower interest rates and lower inflation. The much stronger than expected U.S. nonfarm payroll (NFP) data for January, released on Friday, reintroduced the focus on the possibility of showing economic growth due to a possible Fed “overreaction” in response to a very strong labor market. But we were encouraged by the containment of wage pressures. We also show that there are signs that the U.S. labor market might not be as tight as it first appears.
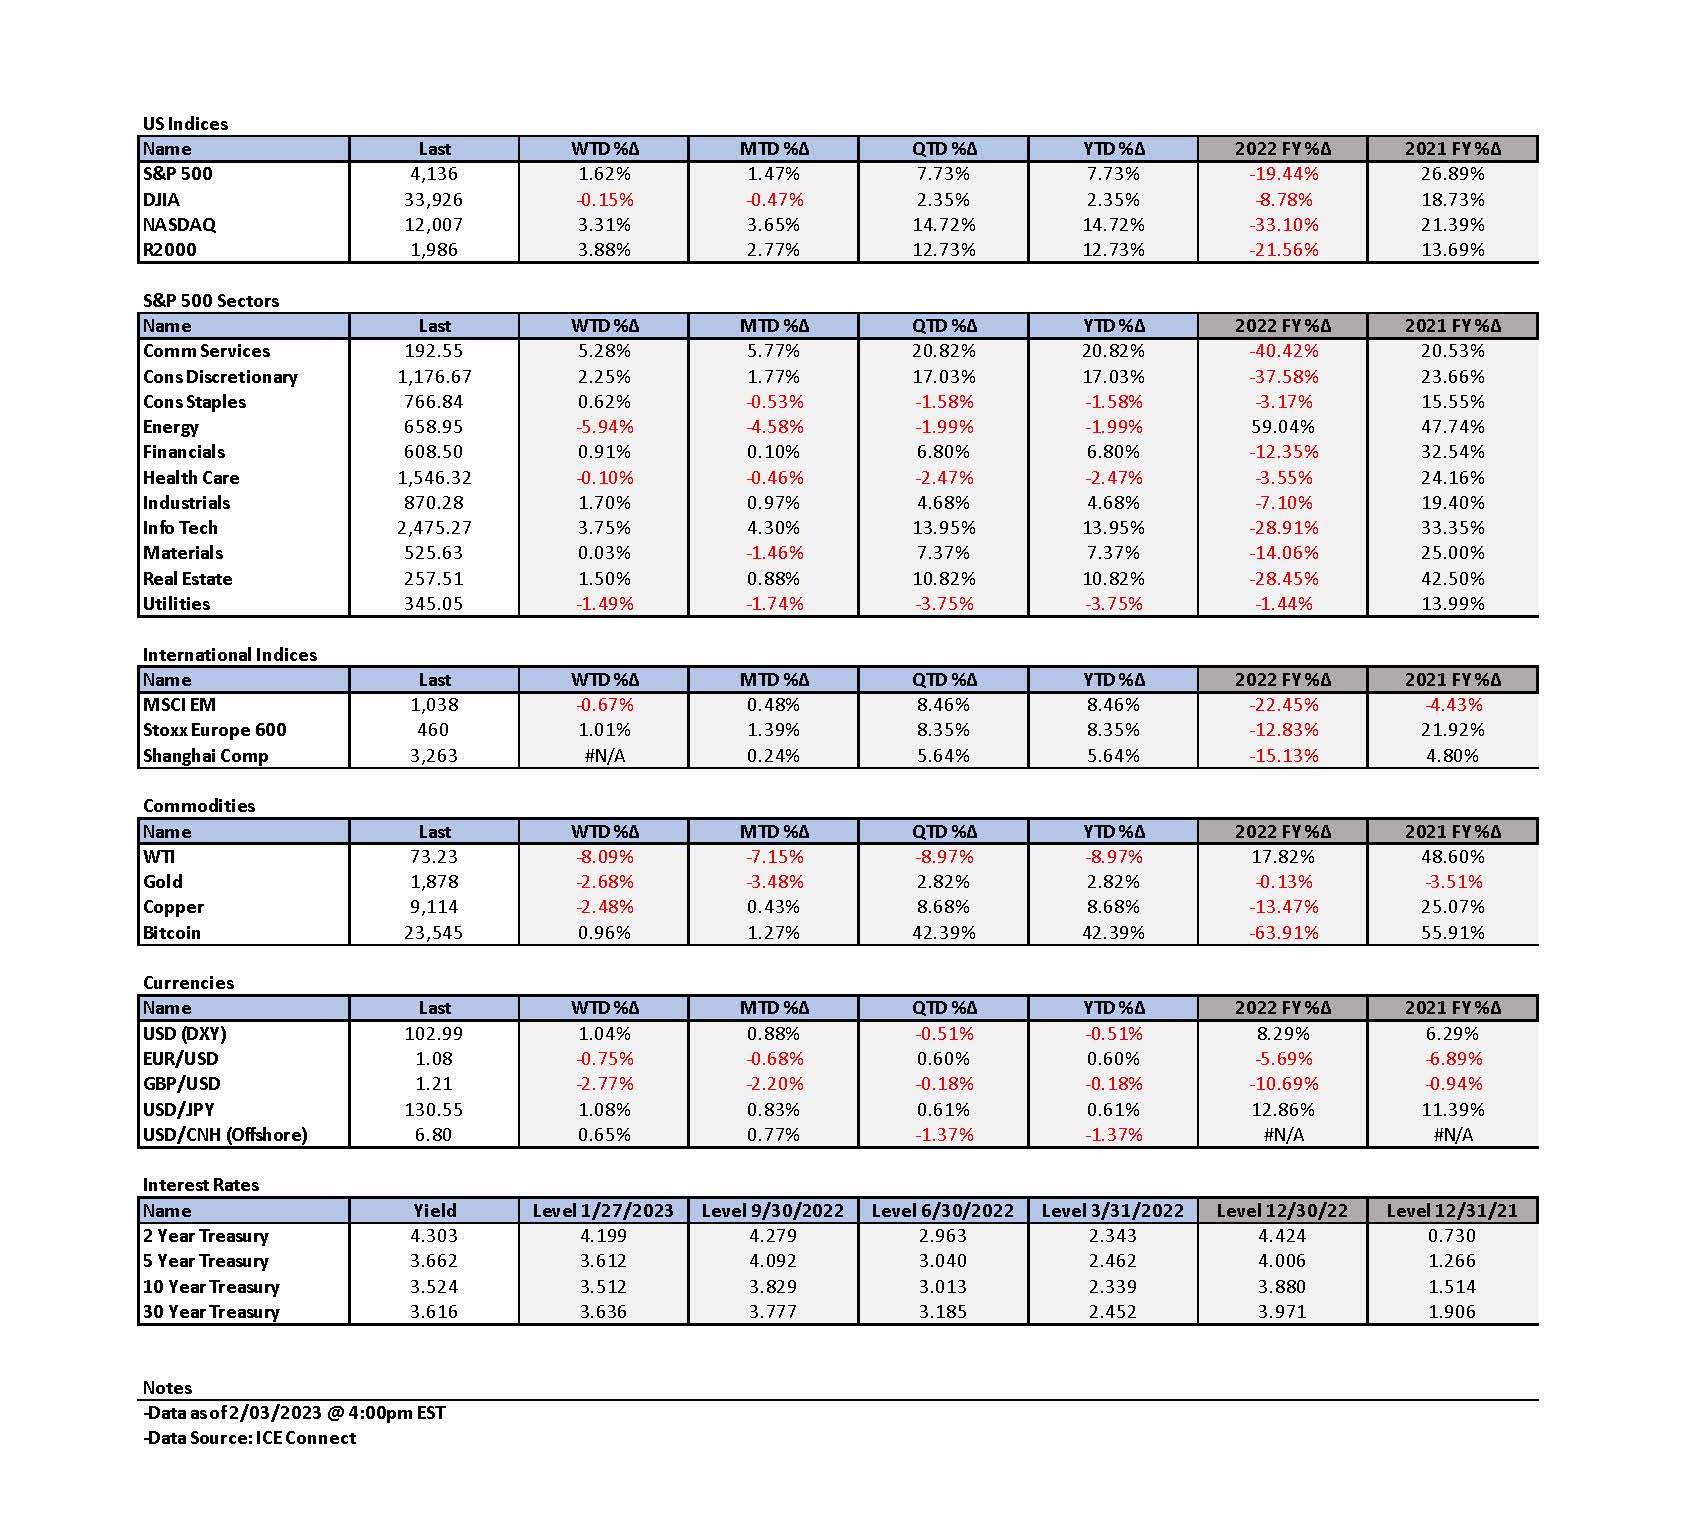
- The more dovish postures of the Bank of England (BOE) and the European Central Bank (ECB) revealed on Thursday helped to push interest rates further down. This was especially true across Europe. The Italian 10-year sovereign bond yield dropped 39 basis points (bps) on the day to yield 3.89%. This was biggest single day drop in its yield in almost three years. Friday’s strong NFP data helped reverse part of the precipitous drop in European rates on Thursday. U.S. Treasury yields also rose strongly on Friday as the 2-to-10-year yield curve inverted more. DXY, an index of USD relative to a “basket” of currencies increased by over 1% during Friday’s trading. Commodity prices were weak generally on Friday. A stronger USD usually is detrimental to commodity prices.
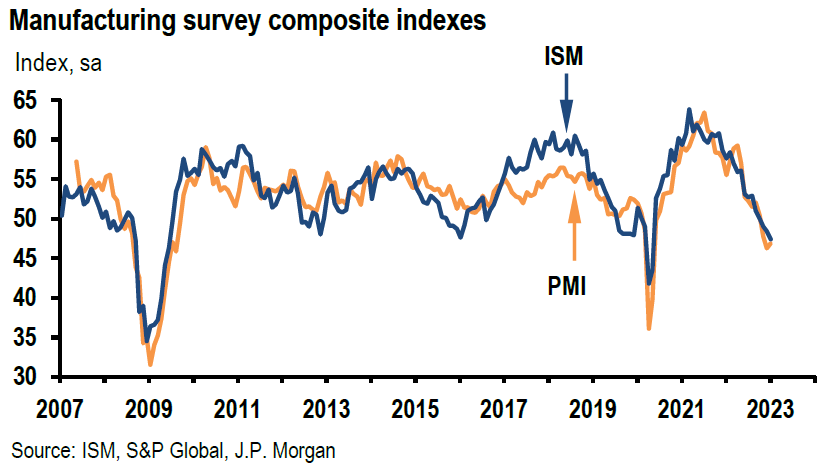
- The ISM manufacturing and Services PMIs reveal a varied U.S. economy – a contracting manufacturing economy and an expansionary services economy. We maintain our conviction that U.S. inflation will continue to dissipate more quickly than many people expect until it stalls at some point, perhaps in the 3.5% to 4.0% range. As Powell observed in his press conference consumer sentiment could improve as inflation dissipates, which could put a “floor” on U.S. economic growth. As we have previously highlighted, if inflation comes down faster than wage growth, profit margins at many companies could become compressed, leading to lowered earnings.
The Upshot: Our general investment approach remains the same as depicted in last week’s commentary. We maintain our preference for big cap quality stocks with good balance sheets, relatively stable cash flows with stable margins. We would also like to highlight the outperformance of many small cap stocks this year. Volatility across sectors continues to be supportive of a diversified global portfolio for long term investors.
We recommended selling selectively some growth/tech stocks with very high price/earnings (P/E) into the stock rally on Thursday morning. We thought that on a risk/reward basis the holding of full positions on such stocks could no longer be justified. We remain convinced that we will see more attractive entry points for many such stocks this year. We expect volatility to continue across asset classes.
Changing Monetary Stances at the Fed and Other CBs – Initial Market Reactions
The Fed raised the federal funds rate 25 bps at this week’s meeting as expected. With this increase, the Fed has raised the targeted federal funds rate to the 4.5%-to-4.75% range. But the Fed surprised the financial markets, many investors and analysts this week with a seemingly much more dovish stance than was expected, as well as when compared to the Fed’s most recent meetings. In our opinion, other major CBs – BOC last week, as well as BOE and ECB this week – also adopted relatively more dovish stances. U.S. equities, interest rates and the U.S. dollar (USD) all showed rather strong reactions to these shifts in CB stances. In reaction to the Fed’s more dovish stance, U.S. equities rallied most strongly in “long-duration stocks” – growth type stocks – and small cap stocks. The Nasdaq Index showed the most dramatic upside followed by the Russell 2000 Index. The Dow Industrial Average (Dow) exhibited the most muted response – and even fell on Thursday – while the other major U.S. equity indexes – including the S&P 500 – followed through positively. The Dow is characterized often as the most “value”-oriented U.S. equity index. The U.S, dollar recovered a portion of its Wednesday’s drop on Thursday. In our December 16 weekly, we surmised that the Federal Open Market Committee (FOMC) meeting of that week “could be the peak of Fed ‘hawkishness.’” So far, so good. We thought that many of the statements that Fed chair Powell made during his press conference after the Fed’s decision was announced mid-week were perhaps the most dramatic of all. We thought that Bob Dylan’s classic song “The Times They Are A-Changin” was the most apropos – given the changing stances of CBs and the rotations of various equity sectors this year. “For the loser now; Will be later to win; For the times they are a-changin’ … For he that gets hurt; Will be he who has stalled; … The slow one now; Will later be fast; As the present now; Will later be past; And the first one now; Will later be last; for the times they are a-changin.’”
FOMC Statement – More Dovish Interpretation of Changes
The FOMC statement released before Powell’s press conference already indicated changes in the Fed’s posture. The prior statement declared that inflation “remains elevated” and indicated the underlying factors. This was replaced with “inflation has eased somewhat but remains elevated.” Unlike the prior version, the latest version acknowledges progress on lessening inflation. Instead of blaming the Russia-Ukraine war and related events on contributing to inflation and weighing on global activity, this observation was now reduced to the war contributing to “elevated global uncertainty.” The prior focus of the Fed determining the pace of future increases in the target range of the federal funds rate was superseded by determining the extent of future increases. Even in December’s press conference, Powell acknowledged that the “policy rate” was “getting close to being sufficiently restrictive“ enough to help achieve the Fed’s targeted 2% rate of inflation. Powell has indicated that once the federal funds rate target range was close to being sufficiently restrictive, the focus should shift then to determining the terminal rate as the pace became of much less consequence at that point. We saw this latest change as merely memorializing Powell’s prior statements. Prior to the release of the latest FOMC statement, many analysts focused on whether the “ongoing increases” in the target range would be replaced by language that would be more unclear about any more “appropriate” rate hikes. It was thought that it would be considered hawkish if this phrase remained because it would indicate a number of additional hikes in the federal funds rate. Powell’s press conference statements sufficiently obfuscated this interpretation to such an extent so as to make it virtually irrelevant in determining the number of future hikes.
Powell’s Dovish Press Conference
Powell reiterated that the reason for maintaining the phrase “ongoing increases” was to indicate that the Fed has “more work to do” in achieving the targeted 2% inflation rate goal. Powell acknowledged that wage growth had slowed even as the U.S. labor market remained very tight, and he observed that U.S. economic growth had slowed “significantly“ last year. Additionally, Powell also observed that inflation had moderated recently but remained “too high.” For the first time, Powell referred to “disinflation” repeatedly. He stated that “for the first time” he could see that the “disinflation process has started.” Powell thought that we were now in the early stages of disinflation and that it would take “some time” for inflation to reach a 2% target. The financial markets interpreted this acknowledgement to be a dovish signal. The Fed has indicated that they were waiting to see a “sustained” downtrend in the rate of inflation. We interpreted these statements as an indication that a sustained downward inflation trajectory has finally begun. Powell stated that he could see most clearly the decrease in goods inflation. He assumed that new lease rates would come down and that he expected inflation in core services, excluding housing services, to come down as well – although he has yet to see this downturn. He also said that he expected housing services to continue increasing first, before coming down. Powell views the part of services inflation, excluding housing services, as the most “sticky” and most closely tied to wage growth. In Powell’s “base case,” the U.S. can return to 2% inflation without a “significant” decline in the economy or labor market. Powell envisions that U.S. economic growth will continue in 2023, but at a “subdued” level.
After reiterating that “ongoing increases” would be appropriate to get to a sufficiently restrictive level and to achieve the targeted 2% inflation rate, Powell added that the “terminal rate could certainly be higher than we are now.” Does this mean that no additional hikes might be needed? Perhaps Powell misspoke. Perhaps he wanted to indicate that he is open to many scenarios depending on incoming economic data. We still anticipate at least one more 25-bps hike at the Fed’s next meeting. Powell stated that he saw the global “picture” improving economically. He also gave specific reasons as to why he was sanguine in regard to U.S. 2023 economic growth. As inflation comes down, consumers’ sentiment should improve, and Powell thought that state and local government expenditures will help support positive growth in 2023. Powell stated that if inflation comes down “steadily” this year as the Fed predicts, he does not “see” any rate cuts in 2023. But he seemed to suggest that if inflation rates dropped much faster than the Fed expected, then we could possibly see rate cuts this year. This also appears to suggest that an economic downturn would not be necessarily a precondition for the Fed to cut rates this year under such circumstances. For the time being, our base case remains no rate cuts by the Fed this year. Powell finds it “assuring” that inflation expectations remained “well anchored” since inflation expectations are an important part of creating inflation. Furthermore, Powell also reminded us of history having shown us the dangers of a premature easing of a restrictive monetary policy in reining in high rates of inflation.
Although Powell stated that it was important that financial markets “properly” reflect what the Fed is doing, Powell said that he was not concerned about financial conditions having eased recently and said that he viewed financial conditions as having moved “sideways” since the Fed’s last meeting. He added that the Fed’s focus is not on short term moves in financial conditions. We viewed this as yet another change in the Fed’s stance. Minutes of a prior meeting indicated the Fed’s frustration in regard to the “unwarranted” easing of financial conditions and how such an “easing” made the Fed’s job more difficult in reining in inflation. In contrast, now there was no “pushback” to the recent easing of financial conditions.
BOC, BOE and ECB – More Dovish
As we highlighted in last week’s commentary, after raising its overnight rate by 25 bps, the BOC was the first major CB to indicate a “pause” in its raising of rates. We interpreted the statements of the BOE and ECB on Thursday of this week as indicating a more dovish stance as well. The BOE raised its key rate by 50 bps to a 4.0% level – its highest level since 2008. Additionally, the BOE indicated that it would be more data dependent before any further rate increases. In the minutes to this week’s meeting, the BOE acknowledged that some forward-looking indicators had started to “point” to a slowing in wage and inflation data. The BOE now projected a more shallow and shorter recession versus its last projections. On February 2, J.P. Morgan (JPM) remained skeptical that UK inflation had “turned the corner” and still expected hikes of 25 bps in both March and May. Even the BOE admitted that the risks to its lowered inflation expectations were large and skewed to the upside. In its most recent forecast, the International Monetary Fund (IMF) forecast that the UK would be the only major economy to contract in 2023.
The ECB raised its deposit rate by 50 bps to 2.5% – highest since 2008 – and signaled another 50-bps hike at its next meeting in March. Thereafter, the ECB would become more “data dependent.” The ECB’s Governing Council noted that the risks to its inflation and economic growth outlooks had become more “balanced,” but acknowledged inflation risks remained skewed to the upside. ECB’s president Lagarde stressed that underlying inflationary pressures remained “firm.”
U.S. Labor Market – Maybe Less Tight than Appears
On the surface, the Job Openings and Labor Turnover Survey (JOLTS) for December showed a surprising and unexpected large increase in job vacancies relative to the number of individuals unemployed – roughly a 1.9-to-one ratio. Fed chair Powell referred to this ratio as an indication of a very tight U.S. labor market. Job openings increased 572,000 – 5.5% month-over-month (m/m) – to 11.012 million, its highest level since last July. It looks like seasonal adjustments were once again distorting a more realistic depiction of “reality.” According to Goldman Sachs on February 1, “the seasonal adjustment factors boosted December job openings by about 300,000. In addition, alternative web-based measures of job openings have declined in January and the latest data are consistent with roughly 9.7 million job openings.”
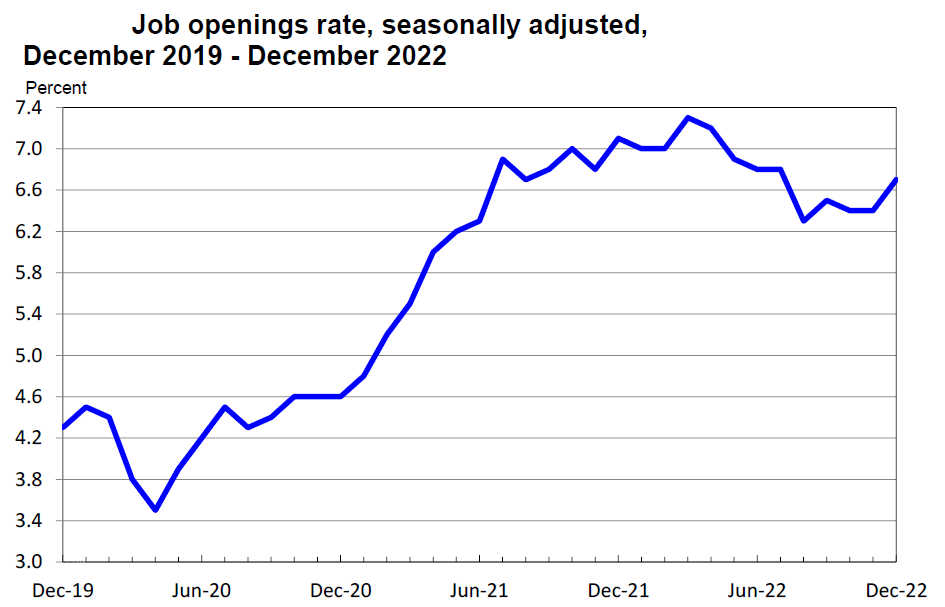
Source: US Department of Labor, Job Openings and Labor Turnover – December 2022 (2-1-2023)
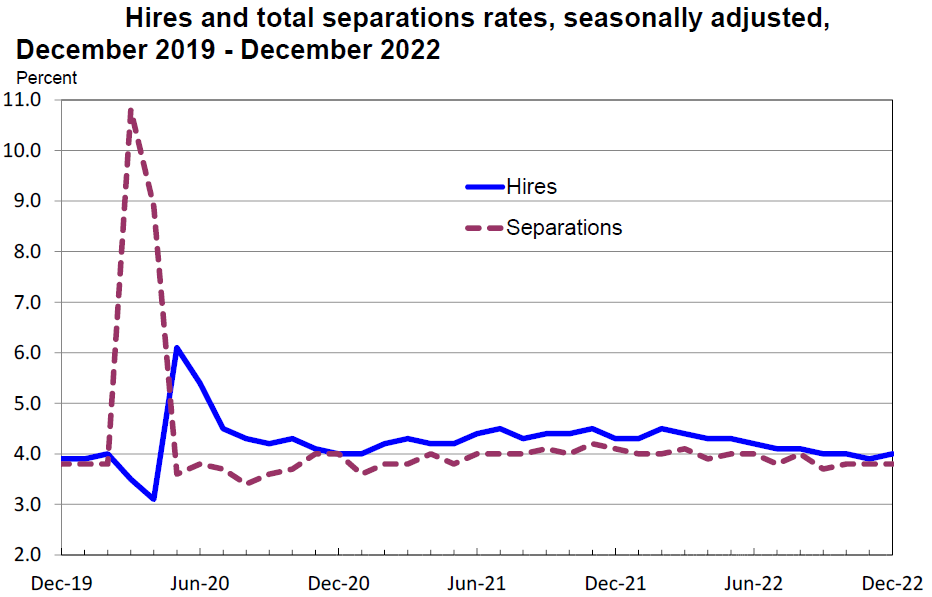
The initial claims for unemployment insurance is another measure that is relied on heavily as a more timely indicator of labor market tightness. For the week that ended January 28, initial jobless claims declined 3,000 to 183,000, the lowest level since last April. Once again, initial claims were less-than-expected. These low levels of claims suggest a very tight labor market. These figures are all seasonally adjusted as well. Are more distortions possible? The latest Challenger Job-Cut Report suggests a less-sanguine depiction of the U.S. labor market. The Challenger Report is an economic report that tracks job cuts by U.S. employers. The global outplacement and executive coaching firm Challenger, Grey & Christmas issues the monthly report. According to the latest report, U.S. based employers announced 103,000 job cuts in January versus 43,600 in December. Excluding the early pandemic period, the January total was the highest monthly total since July 2015. These figures are not seasonally adjusted. Announced job cuts in the tech industry have accounted for a large proportion of these job cuts recently – 41% in January and 49% over the past three months. According to JPM on February 2, “it is difficult to completely square the seemingly contrasting messages from the jobless claims data and the Challenger job cuts data. One possible explanation for the recent divergence is that people are getting laid off but they are not filing for unemployment insurance. This may be because people are easily able to find new work or because severance payments are delaying eligibility for unemployment benefits – specific rules regarding eligibility vary by state.” Tom Porcelli of RBC Capital also noted that many laid -off workers got severance payments and did not bother to apply for unemployment benefits, but that they would eventually apply for these benefits.
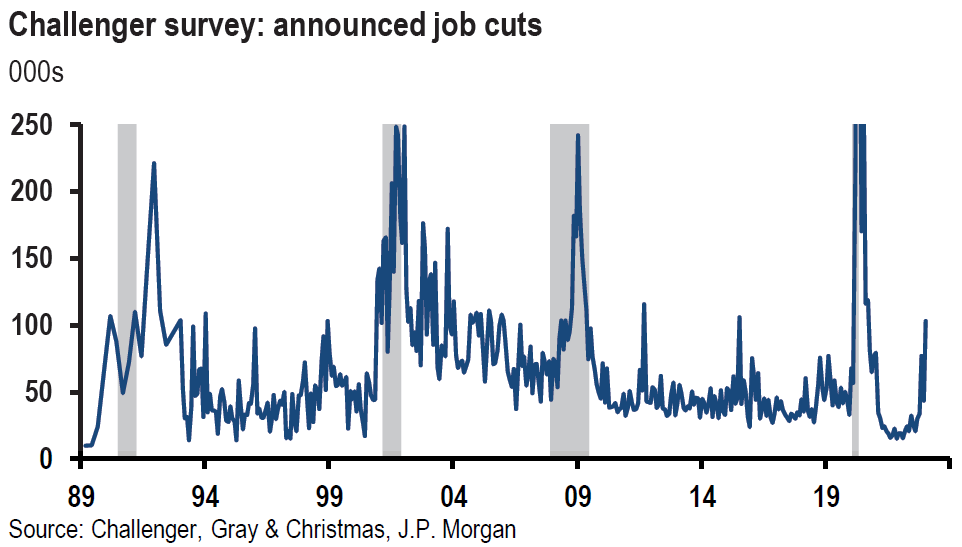
Source: JP Morgan, US: Initial claims stay low but job cut announcements rise (2-3-2023)
Encouraging Trends for Wage Growth
Employment Cost Index (ECI)
The ECI for Q4 2022 rose 1.0% versus an expected increase of 1.1% and versus 1.2% for Q3. Q4 was the third consecutive slowdown of ECI. Wages and salaries, which make up about 70% of ECI, rose 1.0% as well. Benefit costs rose 0.8% versus 1.0% in Q3. Compensation costs for civilian workers increased 5.1% year-over-year (y/y). Although higher on a y/y basis in 2022, compared to a lower y/y increase in 2021, the quarterly compensation costs increased at a steadily declining rate during the four quarters ended 2022. We expect a continued moderation in compensation costs that should be favorable eventually for services inflation.
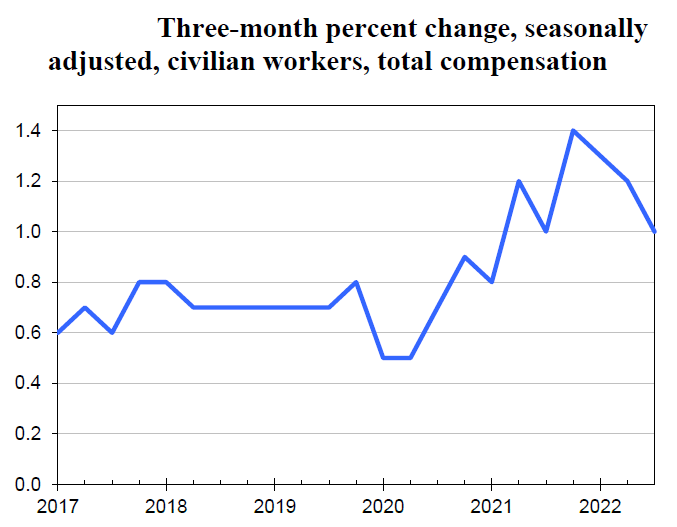
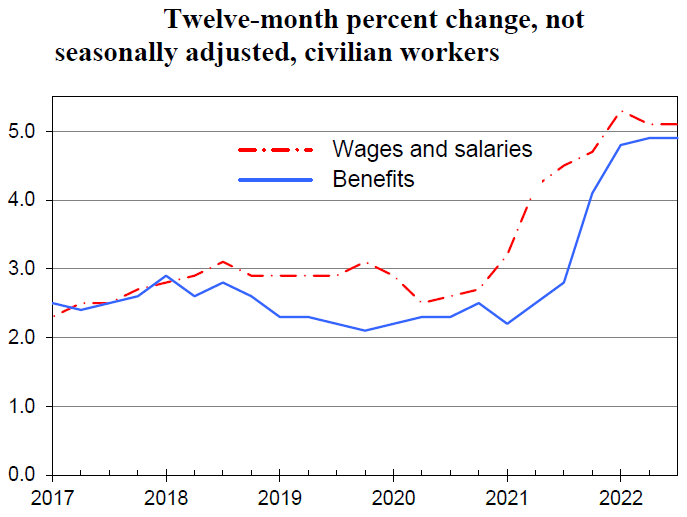
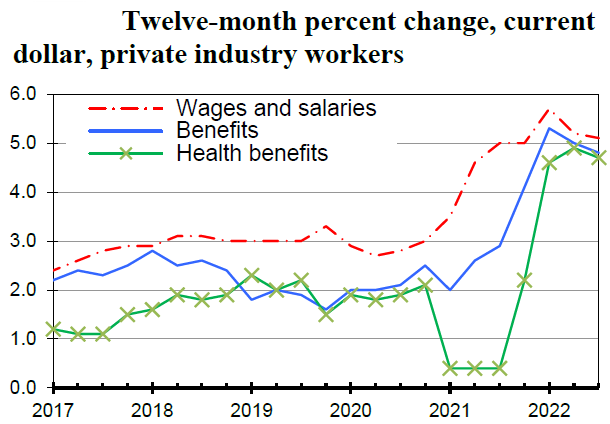
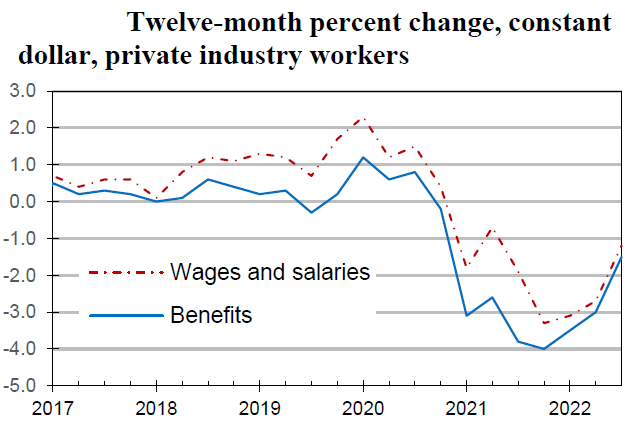
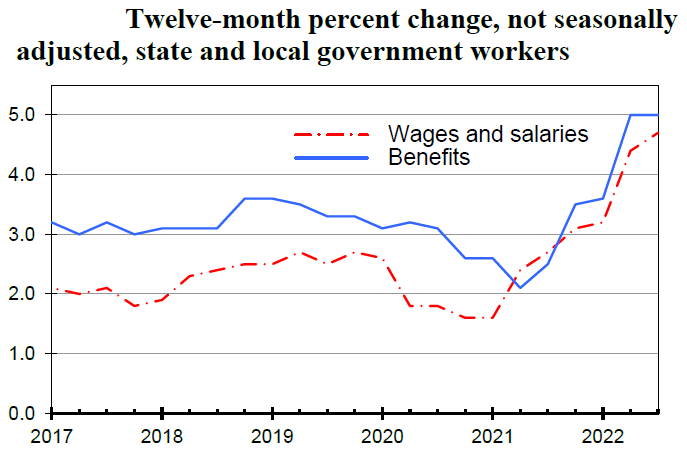
Source: US Department of Labor, Employment Cost Index – December 2022 (1-31-2023)
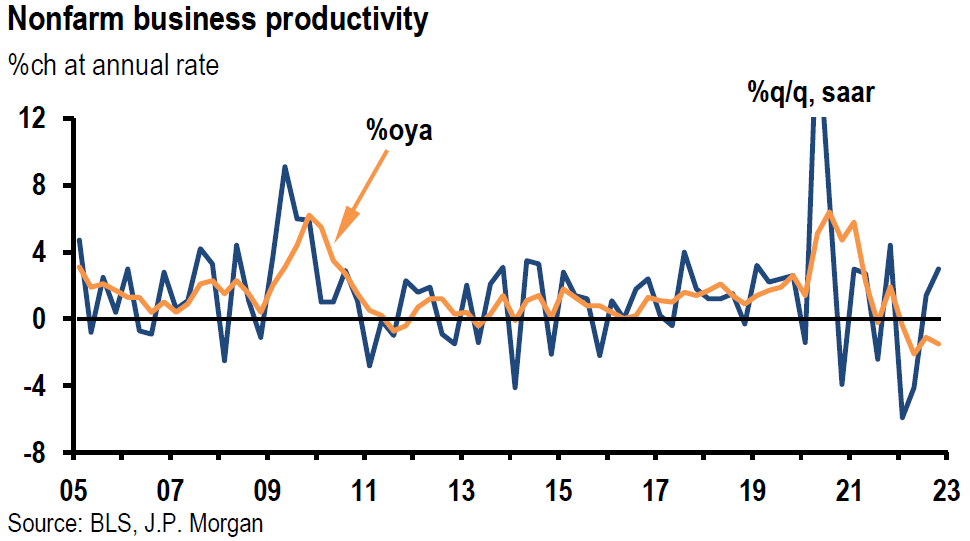
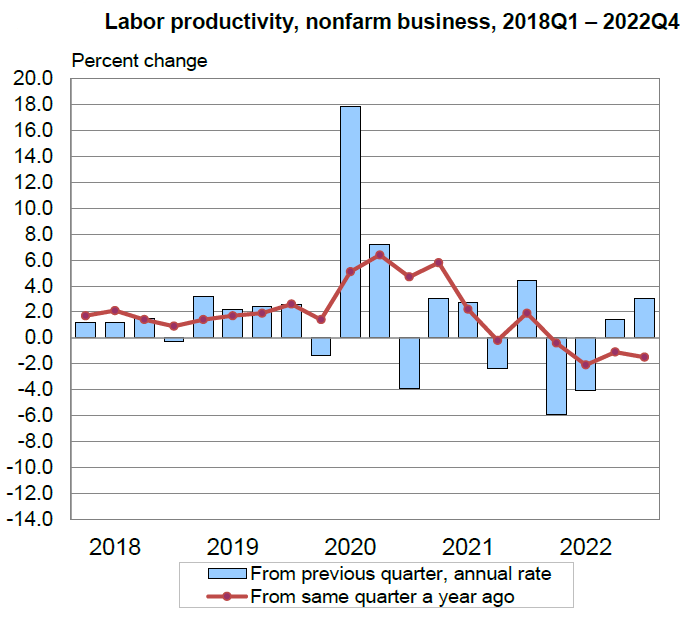
U.S. Nonfarm Labor Productivity
Nonfarm labor productivity rose 3.0% in Q4, above expectations for an increase of 2.4%. On a y/y basis, productivity decreased 1.5% in Q4, reflecting an increase of 0.8% in output and a 2.3% increase in hours worked. For all of 2022, productivity decreased by 1.3%., which was the largest decline since 1974 when productivity declined 1.7%. Once again, the recent increase in productivity was an encouraging sign for wage growth to slow.
Source: JP Morgan, US: Initial claims stay low but job cut announcements rise (2-3-2023)
Source: US Department of Labor, Productivity and Costs (2-2-2023)
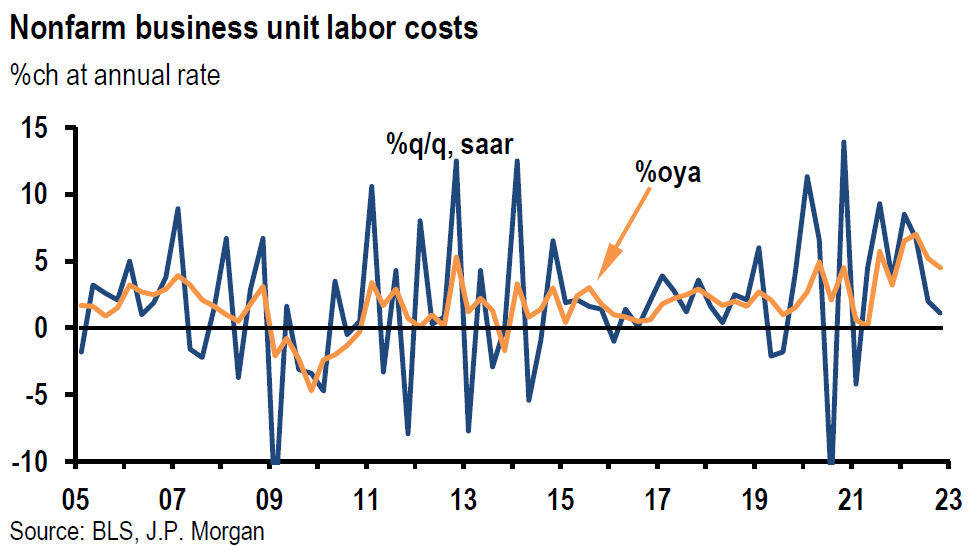
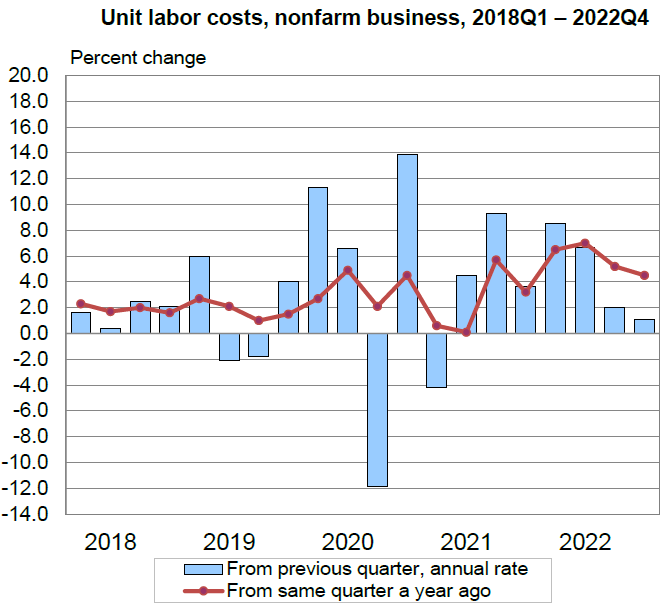
U.S. Nonfarm Unit Labor Costs
Nonfarm unit labor costs rose only 1.0% in Q4, below expectations for a much higher 1.5% increase and compared to a downwardly revised 2.0% increase for Q3. The Q4 increase in labor costs was the smallest increase since Q1 2021, reflecting a 4.1% increase in hourly compensation and a 3.0% increase in productivity. We are hopeful that this most recent trend may continue.
Source: JP Morgan, US: Initial claims stay low but job cut announcements rise (2-3-2023)
Source: US Department of Labor, Productivity and Costs (2-2-2023)
The Conference Board’s Consumer Confidence Index — Lower
The Consumer Confidence Index for January unexpectedly declined to 107.1 from an upwardly revised 109.0 level for December. The present situation index – based on consumers’ assessment of current business and labor conditions – increased to 150.9 from 147.4 in December. But the expectations index (short term outlook within six months) fell to 77.8 from 83.4. The Conference Board characterizes an expectations index of under 80 as being often a precursor to a recession within the next year. Consumers were “less upbeat” about the short-term outlook for jobs. They also expected business conditions to worsen in the near term. The Conference Board’s labor market differential, the difference between consumers’ view as jobs being “plentiful” – 48.2% in January versus 46.4% in December and their view that jobs are “hard to get” – 11.3%, down from 11.9% in December. This differential rose to 36.9 in January from December’s 34.5 level.
U.S. ISM Manufacturing PMI for January — Weaker
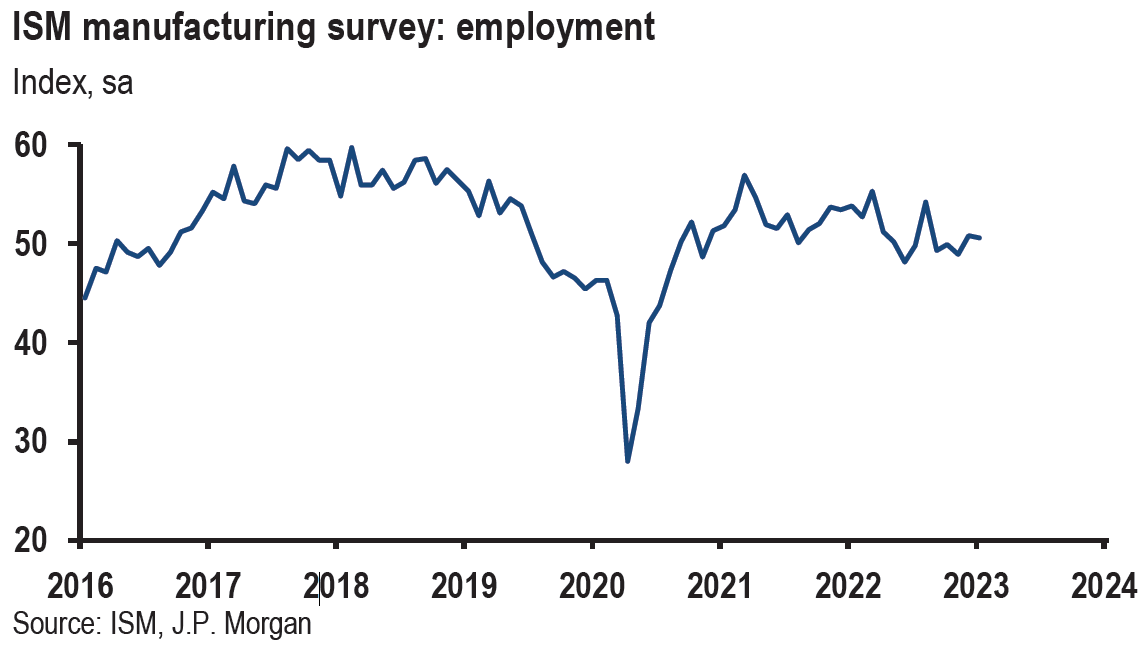
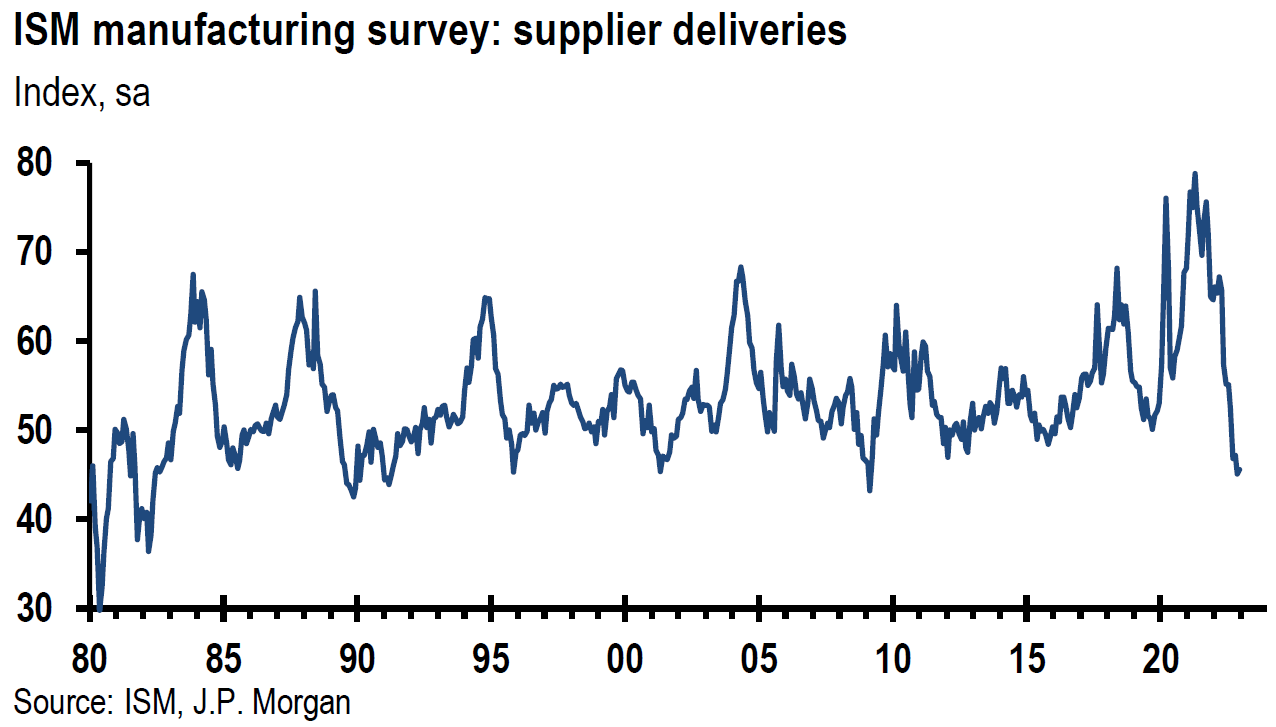
The Institute for Supply Management (ISM) manufacturing PMI declined to 47.4 in January versus an expected reading of 48.0 and below December’s reading of 48.4. January’s reading was the lowest since May 2020. Economic activity in the manufacturing sector contracted for the third consecutive month in January. New orders, production and backlogs all contracted. New export and import orders also contracted but at a slower rate of contraction. In spite of this weakness, companies indicated that they were not going to reduce substantially their “headcounts” as they remained positive about 2H 2023. The chair of the ISM manufacturing business survey committee observed that ‘with the business survey committee panelists reporting softening new order rates over the previous nine months, the January composite index reading reflects companies slowing outputs to better match demand in the first half of 2023 and prepare for growth in the second half of the year.”
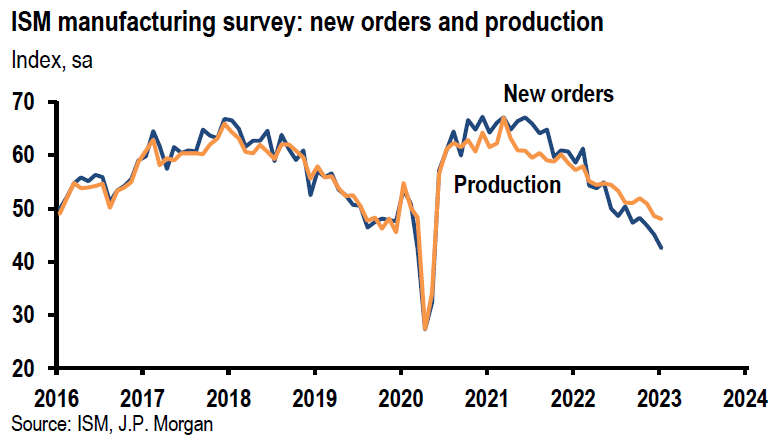
Source: JP Morgan, US: ISM manufacturing survey declines again (2-1-2023)
U.S. ISM Services PMI for January – Stronger
The ISM Services PMI rebounded rather dramatically from a 2-and-half year low of 49.2 in December to 55.2 versus an expected 50.4 reading. The December contraction was the first since May 2020. A majority of companies indicated that business was trending in a positive direction. Business activity/production rose to 60.6 from 53.5 in December. An even larger rebound was seen in new orders – rising from 45.2 to 60.4. Employment remained steady and price pressures eased to 67.8 from 68.1. “Some companies still find it difficult to fill open positions, while others are facilitating staff reductions.” Respondents indicated that capacity and logistics performance continued to improve. Given the “wild” swings in this survey over the past few months, we hesitate to draw any conclusions.
U.S. Total Nonfarm Payroll Employment for January – Much More than Expected
U.S. total nonfarm payroll employment for January rose 517,000 against expectations of roughly 190,000. December and November totals were revised higher by a total of 71,000. The unemployment rate dropped to 3.4% (lowest since 1969) versus an expected 3.6% and 3.5% for December. The labor force participation rate increased 0.1% to 62.4%. January’s job growth was widespread, led by leisure and hospitality’s gain of 128,000 jobs. Next was professional and business services 82,000 additional jobs followed by health care’s gain of 58,000 jobs. Government jobs also showed large gains of 74,000. Payrolls increased in 69.0% of industries, a six-month high. On February 3, Goldman Sachs observed that “fewer end-of-year layoffs likely contributed to the surge in payrolls, and … [they] would expect more trend-like gains in February and March.” Average hourly earnings increased 0.3% m/m as expected, matching December’s original figure, but which was revised higher to 0.4%. On a y/y basis, average hourly earnings were 4.4% higher versus an expected 4.4% rate of increase but lower than the 4.6% y/y increase of December. However, the December y/y rate was revised higher by 0.2% to 4.8%. We were encouraged that wage growth remained contained eve with the large payroll gains. Investor’s Business Daily on February 3 reported that financial markets were pricing 66% odds that a March hike in the federal funds rate would be the Fed’s last hike for this cycle. Subsequent to January’s employment report, financial markets were pricing a 50% chance of a May hike as well. We suspect that seasonal adjustments may have inflated the January job gains. According to USA Today on February 3, “quirks” in the Labor Department’s employment survey may have inflated the reported job gains. “For example, retailers and others typically hire many seasonal workers in the fall and let them go in January. But holiday hiring was weak last year and so fewer workers were laid off, boosting the January jobs figure.”
Bottom Line
For the time being we are maintaining our basic investment approach as expressed in last week’s commentary. We continue to prefer high quality big cap stocks that offer good balance sheets, as well as relatively stable cash flows and profit margins. We prefer a very diversified global portfolio for long term investors.
We believe that the Fed indicated a much more dovish stance this week in regard to their restrictive monetary policies. We still expect the Fed to hike the federal funds rate by another 25 bps at its next meeting. We will then decide if we believe another hike would be appropriate after that time. We remain data dependent. At this time, we do not expect the Fed to cut rates this year. We are also becoming more convinced that if the U.S. were to enter a recession this year, it would be a mild one. We still believe that the U.S. might avoid a recession this year.
Definitions
Federal Open Market Committee (FOMC) – The Federal Open Market Committee (FOMC) is the branch of the Federal Reserve System that determines the direction of monetary policy specifically by directing open market operations. The committee is made up of 12 members: the seven members of the Board of Governors; the president of the Federal Reserve Bank of New York; and four of the remaining 11 Reserve Bank presidents on a rotating basis.
Inverted Yield Curve – An inverted yield curve describes the unusual drop of yields on longer-term debt below yields on short-term debt of the same credit quality. Sometimes referred to as a negative yield curve, the inverted curve has proven in the past to be a relatively reliable lead indicator of a recession.
U.S. Dollar Index (DXY) – The U.S. dollar index is a measure of the value of the U.S. dollar relative to a basket of foreign currencies.
Basis Points (bps) – A basis point is one hundredth of one percent, used chiefly in expressing differences of interest rates.
Employment Cost Index (ECI) – The Employment Cost Index is a quarterly economic series published by the Bureau of Labor Statistics that details the growth of total employee compensation. The index tracks movement in the cost of labor, as measured by wages and benefits, at all levels of a company.
NASDAQ – The Nasdaq Composite Index is the market capitalization-weighted index of over 2,500 common equities listed on the Nasdaq stock exchange.
Russell 2000 – The term Russell 2000 Index refers to a stock market index that measures the performance of the 2,000 smaller companies. The Russell 2000 is managed by London’s FTSE Russell Group and is widely regarded as a bellwether of the U.S. economy because of its focus on smaller companies that focus on the U.S. market.
Dow Industrial Average (Dow) – The Dow Jones Industrial Average (DJIA), also known as the Dow 30, is a stock market index that tracks 30 large, publicly-owned blue-chip companies trading on the New York Stock Exchange (NYSE) and Nasdaq.
S&P 500 – The S&P 500 is a total return index that reflects both changes in the prices of stocks in the S&P 500 Index as well as the reinvestment of the dividend income from its underlying stocks.
Job Openings and Labor Turnover Survey (JOLTS) – The job openings and labor turnover survey are a monthly report by the Bureau of Labor Statistics (BLS) of the U.S. Department of Labor counting job vacancies and separations, including the number of workers voluntarily quitting employment.
Job Openings – JOLTS defines Job Openings as all positions that are open (not filled) on the last business day of the month.
Initial Unemployment Insurance Claims – Initial claims are new jobless claims filed by U.S. workers seeking unemployment compensation, included in the unemployment insurance weekly claims report.
Continuing Claims – Continuing claims track the number of U.S. residents filing for ongoing unemployment benefits in a given week. Continuing claims measure ongoing unemployment benefits, which is in contrast to initial claims, which track new filings for benefits.
ISM Manufacturing PMI – The ISM manufacturing index, also known as the purchasing managers’ index (PMI), is a monthly indicator of U.S. economic activity based on a survey of purchasing managers at more than 300 manufacturing firms. It is considered to be a key indicator of the state of the U.S. economy.
ISM Services PMI – The Institute of Supply Management (ISM) services PMI (formerly known as Non-Manufacturing Index) is an economic index based on surveys of more than 400 non-manufacturing (or services) firms’ purchasing and supply executives.
Nonfarm Payrolls – Nonfarm payrolls is the measure of the number of workers in the U.S. excluding farm workers and workers in a handful of other job classifications. The nonfarm payrolls classification excludes farm workers as well as some government workers, private households, proprietors, and non-profit employees.
Nonfarm Productivity – Nonfarm Productivity measures the annualized change in labor efficiency when producing goods and services, excluding the farming industry. Productivity and labor-related inflation are directly linked-a drop in a worker’s productivity is equivalent to a rise in their wage.
IMPORTANT DISCLOSURES
The views and opinions included in these materials belong to their author and do not necessarily reflect the views and opinions of NewEdge Capital Group, LLC.
This information is general in nature and has been prepared solely for informational and educational purposes and does not constitute an offer or a recommendation to buy or sell any particular security or to adopt any specific investment strategy.
NewEdge and its affiliates do not render advice on legal, tax and/or tax accounting matters. You should consult your personal tax and/or legal advisor to learn about any potential tax or other implications that may result from acting on a particular recommendation.
The trademarks and service marks contained herein are the property of their respective owners. Unless otherwise specifically indicated, all information with respect to any third party not affiliated with NewEdge has been provided by, and is the sole responsibility of, such third party and has not been independently verified by NewEdge, its affiliates or any other independent third party. No representation is given with respect to its accuracy or completeness, and such information and opinions may change without notice.
Investing involves risk, including possible loss of principal. Past performance is no guarantee of future results.
Any forward-looking statements or forecasts are based on assumptions and actual results are expected to vary from any such statements or forecasts. No assurance can be given that investment objectives or target returns will be achieved. Future returns may be higher or lower than the estimates presented herein.
An investment cannot be made directly in an index. Indices are unmanaged and have no fees or expenses. You can obtain information about many indices online at a variety of sources including: https://www.sec.gov/fast-answers/answersindiceshtm.html or http://www.nasdaq.com/reference/index-descriptions.aspx.
All data is subject to change without notice.
© 2024 NewEdge Capital Group, LLC


