


As we highlighted in our mid-year outlook, one of the most surprising dynamics we have seen in 2023 is the surge in valuations back to pandemic-era levels, especially given the backdrop of elevated interest rates and hawkish Fed policy.
No metric encapsulates this dynamic better than the equity risk premium (ERP), which compares the valuation of equities to Treasury yields. The ERP is calculated by taking the earnings yield (the inverse of the PE multiple, meaning a lower earnings yield equals a higher valuations) and subtracting a risk-free rate, like Treasury yields.
In the chart below, you can see how today’s combination of high equity valuations and high bond yields have resulted in an ERP of 1.2%, at its lowest level since the years descending from the tech bubble in the early 2000’s.
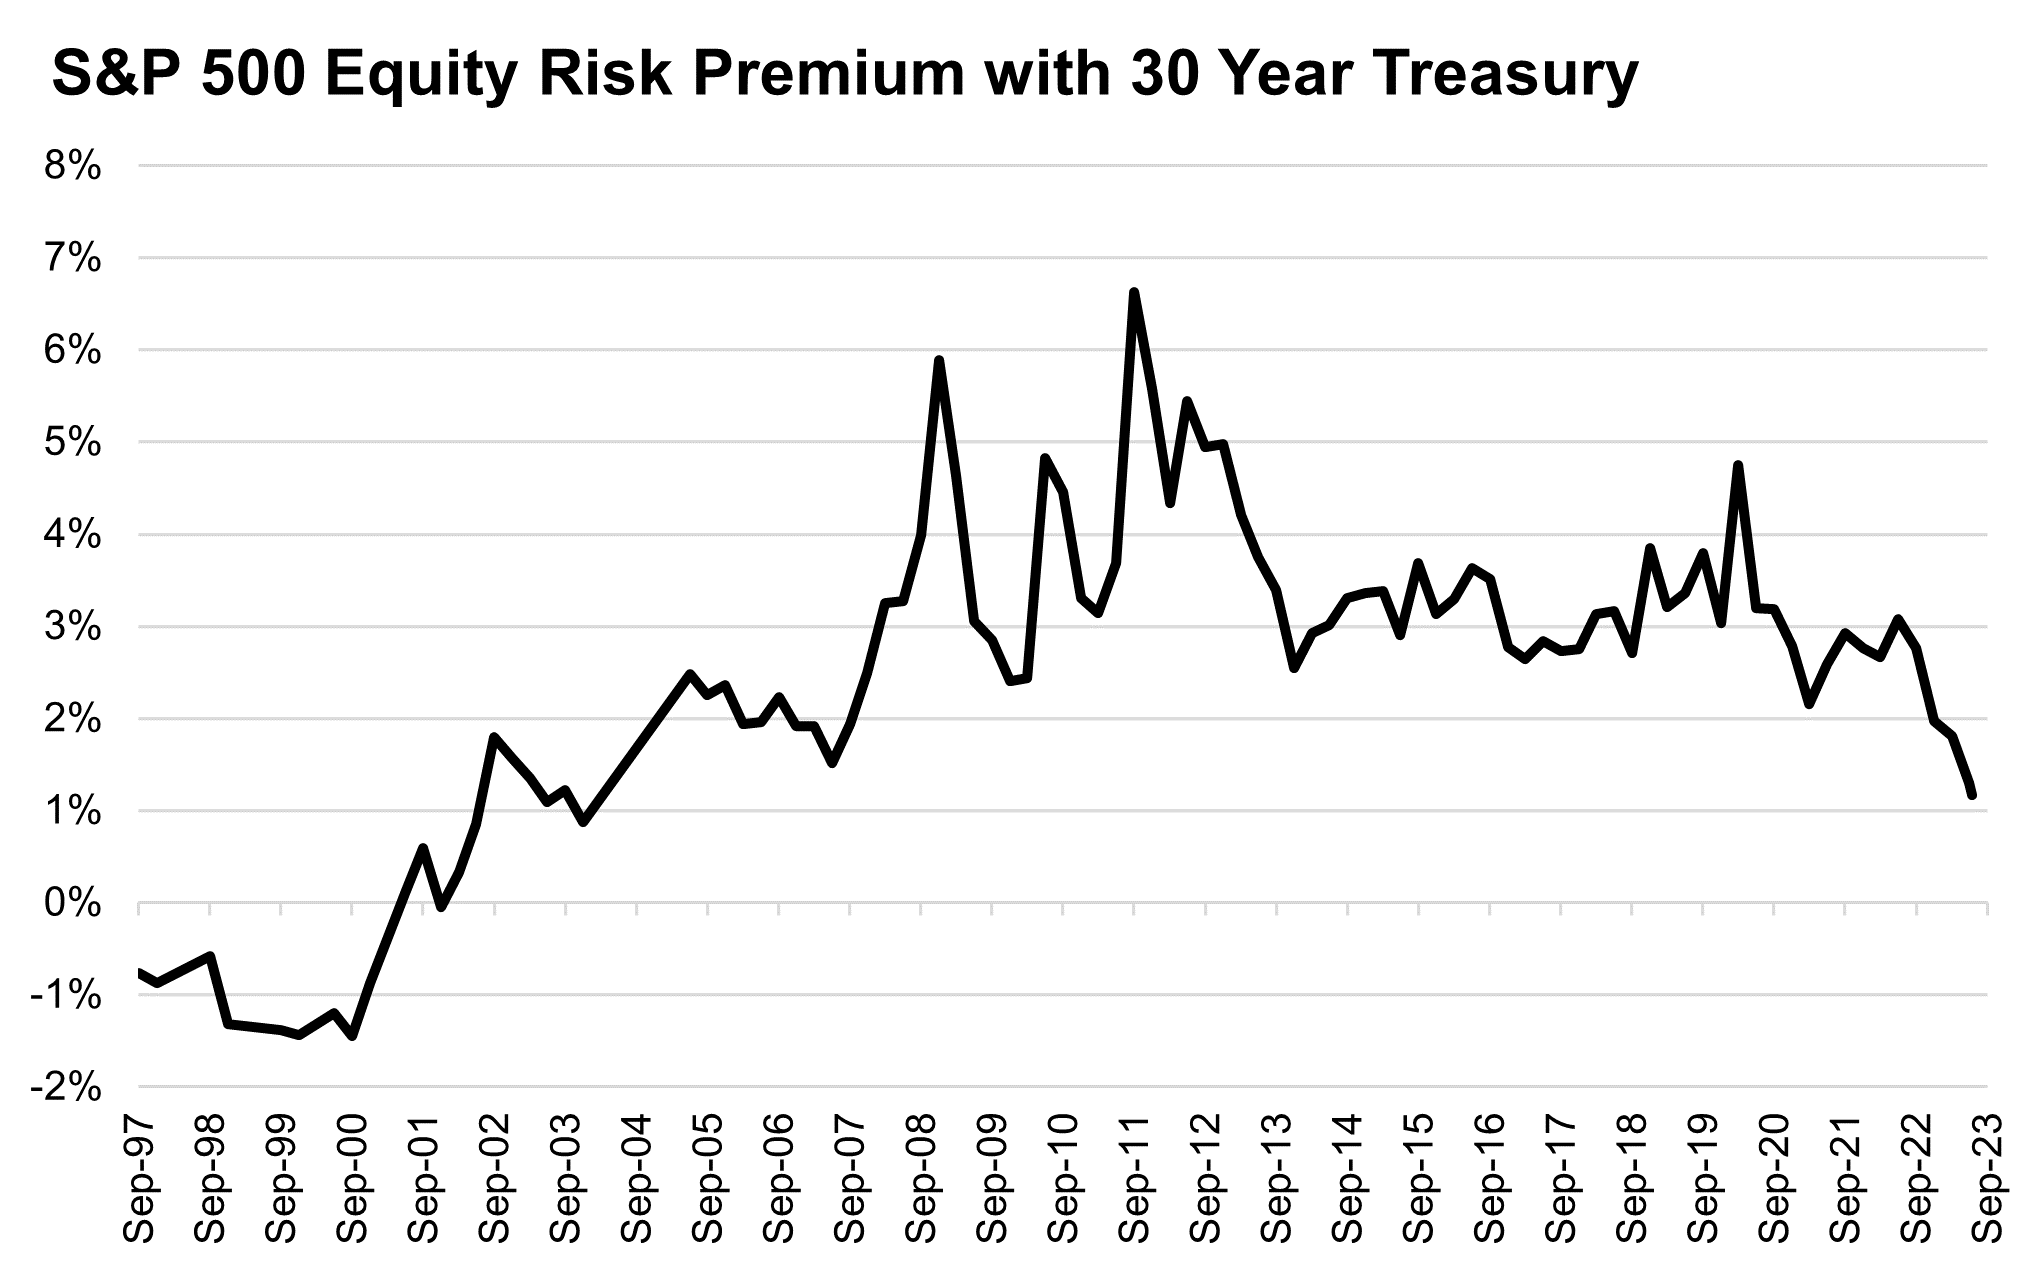
This chart appears alarming, mostly for investors that recall the painful popping of the tech bubble’s heady valuations, but how should today’s equity investors think about elevated valuations relative to bond yields?
This chart appears alarming, mostly for investors that recall the painful popping of the tech bubble’s heady valuations, but how should today’s equity investors think about elevated valuations relative to bond yields?
We have talked at length about how valuations are a poor timing tool, with little predictive power for forward returns looking out 1 year, but more efficacy looking out 2 years and beyond (meaning that higher valuations today have historically been associated with lower returns over the medium-term). The reason for this poor short-term efficacy is that valuations can “go high and stay high”, meaning they can persist at elevated levels that may appear to diverge from underlying fundamentals, (the same is true in reverse, staying depressed for longer than is warranted by fundamentals).
The late 1990’s and early 2000’s is a great example of this. In the chart above, we can observe that the ERP was negative for nearly 5 years until the tech bubble burst. Investors who avoided the equity market solely because of this valuation metric missed out on a period of extraordinary equity returns (which of course was followed by an extraordinary collapse; “Alexa, play Kenny Rogers The Gambler”).
We think the other dynamic around the ERP and valuation’s impact on equity returns has to do with a fundamental building block of economics: tradeoffs.
In a way, comparing equity prices to bond yields, we are asking where investors will put an incremental dollar of capital based on these valuations. It is a question of “this or that?”, meaning will I choose equities at this valuation or bonds at this yield. It is a question and analysis of tradeoffs.
But sometimes these tradeoffs do not apply, meaning relative valuation, and even absolute valuation for that matter, are not the primary drivers of allocation decisions.
When these tradeoffs do not apply is when investors are under-allocated to equities (whether they are under-allocated based on historical allocation levels, or perceive that they are under-allocated due to dynamics like the “fear of missing out” and “irrational exuberance”, as was the case in the tech bubble).
In this scenario, the relative and absolute valuation does not matter for the decision to invest. It is not “this or that”, it is “just get invested.”
To put it another way, in the short term, positioning matters more than valuations.
We can see this in real-time in 2023. Look at positioning measures, such as Deutsche Bank’s Consolidated Equity Positioning and observe that investors/traders began 2023 deeply underweight equities. As equity prices rebounded and sentiment about return potential improved, participants were dragged back into the market. In the journey from deeply underweight to start 2023 to stretched overweight to start 2022, we have moved above 75% of the way to being overweight.
All of this is happening with a backdrop of valuations that have now become historically very expensive, pushing into territory only seen during the pandemic and policy-fueled bubble of 2020 and 2021, and the tech bubble of the late 1990’s and early 2000’s.

But high valuations have not mattered for investors that started the year underweight the asset class. Looking forward, we think that valuations will not be a primary driver of allocation decisions for investors until we see equity positioning get stretched and overweight. It is at this positioning extreme that the decision of “this or that”, “stocks or bonds”, comes back into play.
We saw this dynamic at work at prior local peaks of both valuation and positioning. Early 2018, early 2020, and early 2022 all were periods when both positioning and valuations were stretched. It wasn’t until positioning caught up to valuations, meaning investors became fully allocated to equities, that high valuations became a problem for markets.
In today’s market, we still see room for positioning to become more overweight as investors get drawn into market strength. This positioning chase is currently met with still-robust short-term momentum and improving market breadth (wider participation in the rally), all of which supports a short-term continuation of the rally, which could drive valuations to even more stretched levels (even if unsupported by underlying fundamentals).
Of course, when positioning eventually becomes extended and faces these stretched valuations, the decision returns to being a tradeoff “this or that”, meaning valuations could become an impediment for further upside and even a source of downside (as they were in 2018, 2020, and 2022).
We’re not “there yet”, but we’ll be monitoring this closely.
Top Points of the Week
By Ben Lope
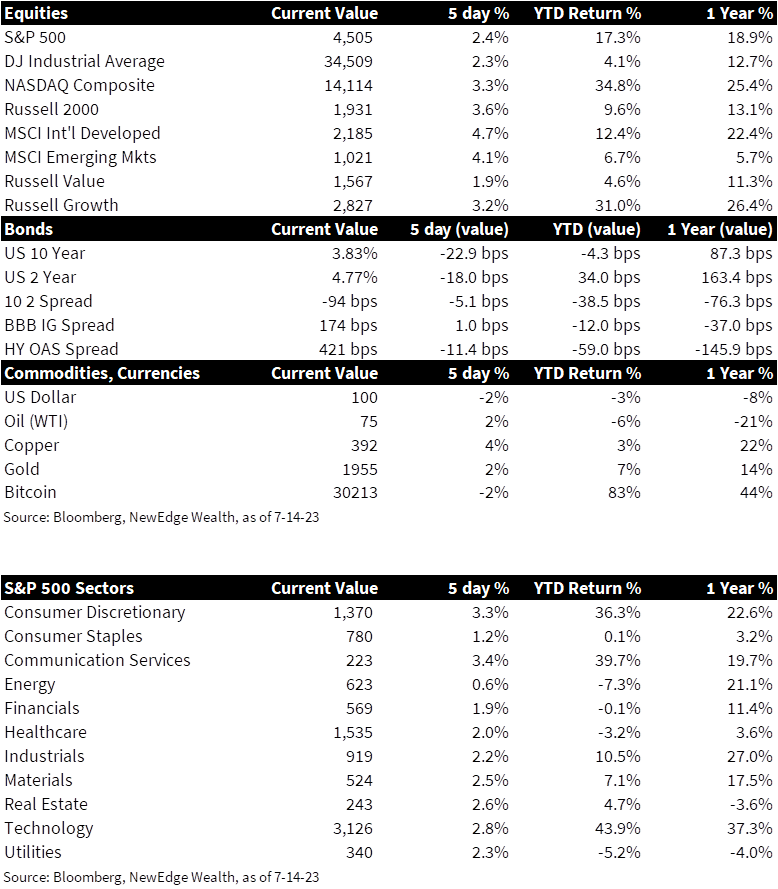
1. Global equities move higher – The S&P 500 broke above 4,500 on a week that saw broad US equities continue their march higher. Small caps and tech stocks, represented by the Russell 2000 and NASDAQ, respectively, were up over 3% this week and led amongst US indices. International developed and emerging market indices both outperformed broad measures of US equities and were up over 4%, perhaps fueled by a further decline in the US dollar.
2. Yields drop on positive CPI news – Yields on US Treasurys fell sharply following the announcement of softer than expected US Consumer Price Index (CPI). Yields on 2-year Treasury bills staged a strong rally on Friday but were still down nearly 20bps from Monday’s levels. Yields on 10-year Treasury bills were down about 25bps over the same period, bringing the level of yield curve inversion back below triple digit levels to about 95bps.
3. Oil prices increase modestly – Oil prices increased modestly this week, with Brent crude briefly eclipsing the $80/bbl mark for the first time in two months but failing to hold above this level as of Friday’s close. The effects of tighter monetary across the globe has contributed to lower energy demand, but a softer USD, the currency that virtually all crude transactions are quoted in, could lead to a pickup in demand in ex-US markets.
4. USD drops to new 2023 low – The US dollar (USD) fell to a new low on the year and is on pace for its worst week of 2023, down between 2.0% and 2.5% from its Monday levels. Encouraging signs of continued disinflation in US CPI and PPI figures released this week may provide further downward pressure on the USD, as fewer rate hikes priced into US markets relative to international markets, some of which are struggling to combat more stubborn inflation than that seen in the US, could encourage traders to establish or increase short dollar positions. A weaker dollar generally benefits international markets, as payments related to dollar-denominated debt and imports become less burdensome.
5. CPI marks lowest reading in over two years – June CPI figures released on Wednesday revealed that year-over-year inflation fell to its slowest pace since March 2021. Headline CPI increase by 3% from last June, a month that exhibited what has thus far been this cycle’s peak inflation rate: 9.1%. Core inflation, which excludes price fluctuations related to energy and food and is seen by the Fed as a better gauge of the effects of central bank policy, increased at a 4.8% year-over-year pace. This is the slowest annual increase since October 2021.
6. PPI data shows disinflation – Similar to Wednesday’s encouraging CPI print, the Labor Department’s release of June Producer Price Index (PPI) figures on Thursday revealed that inflationary pressures are easing for businesses as well. PPI increased by 0.1% in June, marking the smallest annual increase since August 2020. Disinflation in PPI figures has been largely attributed to a slowdown in demand for goods as supply chain pressures have eased and consumers have reversed pandemic-era habits and reverted to higher spending on services relative to goods.
7. US consumer sentiment spikes to highest level in nearly two years– Preliminary results from the University of Michigan’s July survey of consumers showed US consumer sentiment increasing 13% month-over-month, reaching the highest levels since September 2021. The director of the survey attributed the large increase to “the continued slowdown in inflation along with stability in labor markets.” Importantly for the Fed, long-run (5-10 years) annualized inflation expectations remained anchored at 3.1%.
8. China extends and expands stimulus – Chinese equities performed well this week on the back of the government announcing on Tuesday that they would extend policies intended to strengthen the property market, a stimulative measure whose tone was matched by the PBOC’s Friday announcement that the central bank “will make comprehensive use of various monetary policy tools, such as the reserve requirement ratio, medium-term lending facility, open market operations” to further bolster the economy. This week’s announcements are a continuation of efforts by Chinese officials to provide targeted stimulus to an economy that has sputtered since emerging from pandemic protocols.
9. Bank earnings kick off with mixed results among largest banks – Among large banks, JPMorgan Chase (JPM) and Wells Fargo (WFC) saw their share prices pop Friday morning following positive earnings announcements after Thursday’s close, while share of Citi (C) dropped after the bank announced a sharp pullback in profits. JPM reported that revenues rose 34% amid healthy trends across the business, with CEO Jamie Dimon offering some additional optimistic commentary on the US economy and state of the consumer. WFC guided its full year net interest income forecast up to 14% from a previous level of 10%, citing higher rates as a tailwind. C’s profit fell 36% compared to Q2 last year, mostly due to weakness in its trading and investment banking units. Goldman Sachs (GS), Bank of America (BAC), and Morgan Stanley (MS) report Q2 earnings next week.
10. Economic events and notable earnings next week – Next week’s economic calendar is relatively light, but will provide insights into June retail sales, housing starts, and existing home sales, alongside July manufacturing data. It is likely that more headlines will be garnered by Q2 earnings season kicking off in earnest, with notable names including BAC, GS, MS, and American Express (AXP) within Financials, Johnson & Johnson (JNJ) and Novartis (NVS) within Health Care, Netflix (NFLX) within Communication Services, and, perhaps most noteworthy, Tesla (TSLA) within Consumer Discretionary.
IMPORTANT DISCLOSURES
Abbreviations: Brent blend: a blend of crude oil extracted from oilfields in the North Sea between the United Kingdom and Norway. It is an industry standard because it is “light,” meaning not overly dense, and “sweet,” meaning it’s low in sulfur content; Core CPI: measures the changes in the price of goods and services, excluding food and energy; CPI: Consumer Price Index; ERP: equity risk premium, which compares the valuation of equities to Treasury yields and is calculated by taking the earnings yield (the inverse of the PE multiple, meaning a lower earnings yield equals a higher valuations) and subtracting a risk-free rate, like Treasury yields; Headline CPI: the raw inflation figure reported through CPI that calculates the cost to purchase a fixed basket of goods to determine how much inflation is occurring in the broad economy; PPI: Producer Price Index; University of Michigan Consumer Sentiment Index: a survey of personal consumer confidence in economic activity, which is used to estimate future spending and saving.
Index Information: All returns represent total return for stated period. S&P 500 is a total return index that reflects both changes in the prices of stocks in the S&P 500 Index as well as the reinvestment of the dividend income from its underlying stocks. Dow Jones Industrial Average (DJ Industrial Average) is a price-weighted average of 30 actively traded blue-chip stocks trading New York Stock Exchange and Nasdaq. The NASDAQ Composite Index measures all NASDAQ domestic and international based common type stocks listed on the Nasdaq Stock Market. Russell 2000 is an index that measures the performance of the small-cap segment of the U.S. equity universe. MSCI International Developed measures equity market performance of large, developed markets not including the U.S. MSCI Emerging Markets (MSCI Emerging Mkts) measures equity market performance of emerging markets. Russell 1000 Growth Index measures the performance of the large- cap growth segment of the US equity universe. It includes those Russell 1000 companies with relatively higher price-to-book ratios, higher I/B/E/S forecast medium term (2 year) growth and higher sales per share historical growth (5 years). The Russell 1000 Value Index measures the performance of the large cap value segment of the US equity universe. It includes those Russell 1000 companies with relatively lower price-to-book ratios, lower I/B/E/S forecast medium term (2 year) growth and lower sales per share historical growth (5 years). The BBB IG Spread is the Bloomberg Baa Corporate Index that measures the spread of BBB/Baa U.S. corporate bond yields over Treasuries. The HY OAS is the High Yield Option Adjusted Spread index measuring the spread of high yield bonds over Treasuries.
Sector Returns: Sectors are based on the GICS methodology. Returns are cumulative total return for stated period, including reinvestment of dividends.
The views and opinions included in these materials belong to their author and do not necessarily reflect the views and opinions of NewEdge Capital Group, LLC.
This information is general in nature and has been prepared solely for informational and educational purposes and does not constitute an offer or a recommendation to buy or sell any particular security or to adopt any specific investment strategy.
NewEdge and its affiliates do not render advice on legal, tax and/or tax accounting matters. You should consult your personal tax and/or legal advisor to learn about any potential tax or other implications that may result from acting on a particular recommendation.
The trademarks and service marks contained herein are the property of their respective owners. Unless otherwise specifically indicated, all information with respect to any third party not affiliated with NewEdge has been provided by, and is the sole responsibility of, such third party and has not been independently verified by NewEdge, its affiliates or any other independent third party. No representation is given with respect to its accuracy or completeness, and such information and opinions may change without notice.
Investing involves risk, including possible loss of principal. Past performance is no guarantee of future results.
Any forward-looking statements or forecasts are based on assumptions and actual results are expected to vary from any such statements or forecasts. No assurance can be given that investment objectives or target returns will be achieved. Future returns may be higher or lower than the estimates presented herein.
An investment cannot be made directly in an index. Indices are unmanaged and have no fees or expenses. You can obtain information about many indices online at a variety of sources including: https://www.sec.gov/answers/indices.htm.
All data is subject to change without notice.
© 2026 NewEdge Capital Group, LLC

