


Top 10 Charts to Watch for May
The first week of May proved to be action-packed: another bank failed and was acquired out of receivership, the Federal Reserve met and raised interest rates, earnings continued to roll in, equity markets experienced renewed volatility after a lull, and economic data continued to be resilient “in spite of it all”.
To help make sense of all of these macro and market moves, we present the Top 10 Charts to Watch for May:
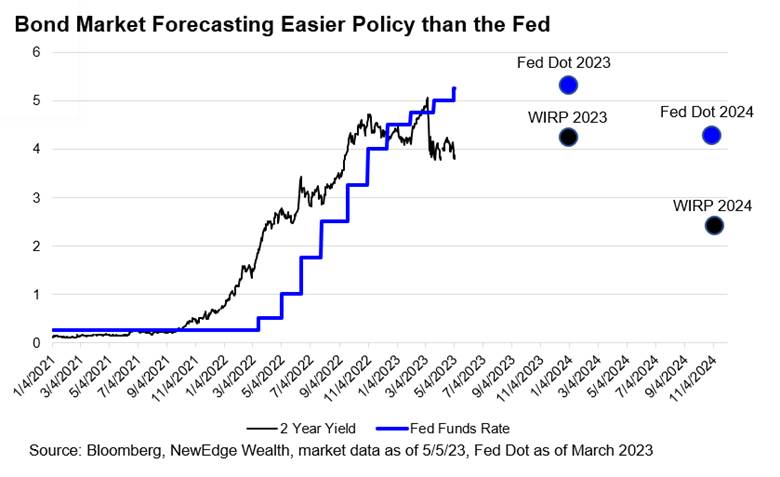
- You Take the High Road, I Take the Low Road: The bond market continues to price in a lower, easier policy path than the Fed’s “higher for longer” guidance. The 2-Year Treasury yield (3.90%) is now meaningfully below the Fed Funds rate (5.25%), a condition that usually occurs when the bond market perceives the Fed as being too tight, with interest rate cuts forthcoming. The difference today vs. recent cycles is, of course, elevated inflation and a tight jobs market. Maybe the bond market and the Fed will meet on the bonnie banks of Loch Lomond.
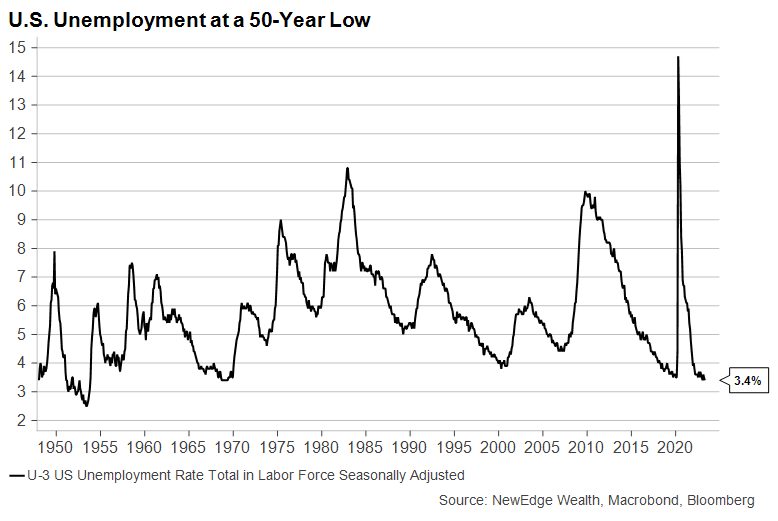
2. Everybody’s Working (for the Weekend): A key factor keeping the Fed in its “higher for longer” mode, despite banking issues, is the tight labor market. Friday’s Nonfarm Payrolls report dropped the unemployment rate down to 3.4%, at the 50-year low.
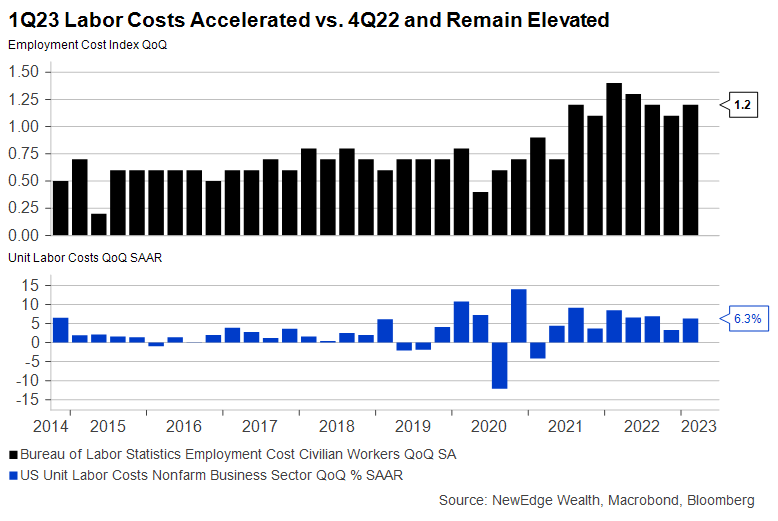
3. Money, Get Away, You Get a Good Job with More Pay and You’re Ok: The tight labor market is also contributing to still-elevated wage growth. Two reads on 1Q23 labor costs in the past week (Employment Cost Index at 1.2% QoQ and Unit Labor Costs at 6.3% QoQ SAAR) continued to show signs that wage growth is too high to be consistent with the Fed’s 2% inflation goal. The Fed is concerned that if they ease policy into a tight labor market, inflation could come roaring back.
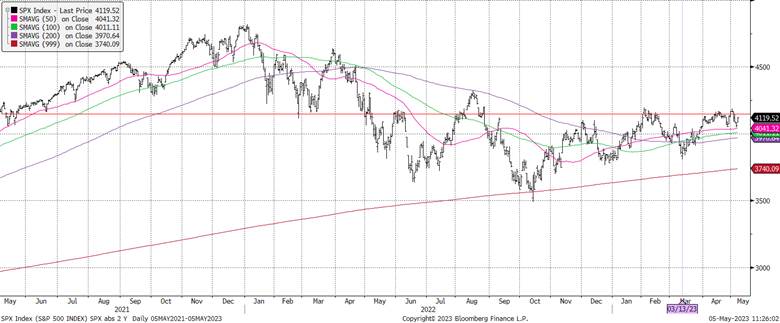
4. And Yes, it Seems as Though I’m Going Nowhere Really Fast: The S&P 500 has now been flat for 2 years (May 2021-May 2023). In that time, we experienced a blow of bull-market in late 2021 and a jarring bear market in 2022, only to churn sideways for 2023. In May 2021, the S&P 500 was trading at 21.6x earnings, with full year 2021 EPS expected at $190/sh. Today, the S&P 500 is trading at 18.7x earnings, with full year 2023 EPS expected at $220/sh. The S&P’s valuation during 2021 was arguable in bubble territory (levels not seen since the late-90’s tech bubble), which requires indices to “grow into” such elevated valuations, hence the flat returns.
Flat for 2 Years: The S&P 500 Has Gone Nowhere Since May 2021
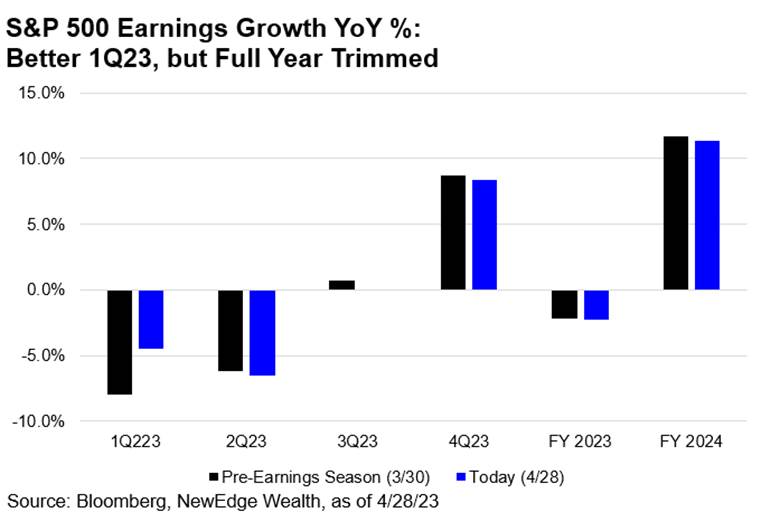
5. Erase/Rewind: 1Q23 earnings are coming in better than expected (80% of companies have beat estimates, compared to an average of 77% over the past 5 years, according to FactSet). Going into earnings season, analysts were expecting an -8% decline for 1Q23, but that is now tracking at -4.5%. Interestingly, analysts are not raising their estimates for FY2023, however note the large rebound projected for 4Q23 (+9.5%) and FY2024 (+11.5%). 2024’s estimate of $243/sh is equal to the forecast for 2023 estimates that markets held in the summer of 2022 (effectively pushed out one year).
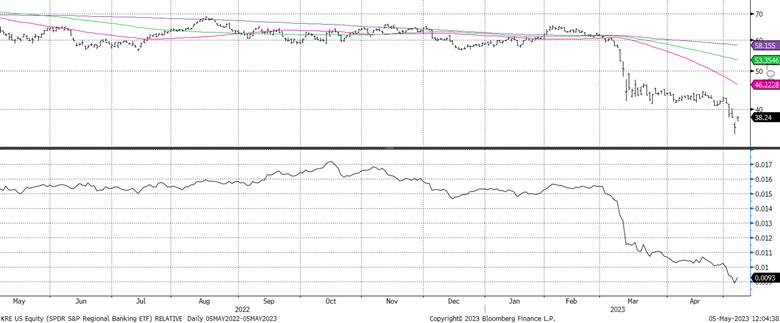
6. Is There No World for Tomorrow, if We Wait for Today?: Regional banks had another tough weak of trading following the acquisition out of receivership of First Republic and renewed fears that other banks with similar geographic and customer exposures could face challenges. Shares bounced back on Friday as sell-side bank analysts (at other banks!) called the sell-off overdone. The lack of sustained recovery in bank stock prices has been a signal that banking stresses may not be completely behind us.
KRE Regional Bank ETF Absolute (Top) and Relative (Bottom) with 50, 100, 200 day moving averages
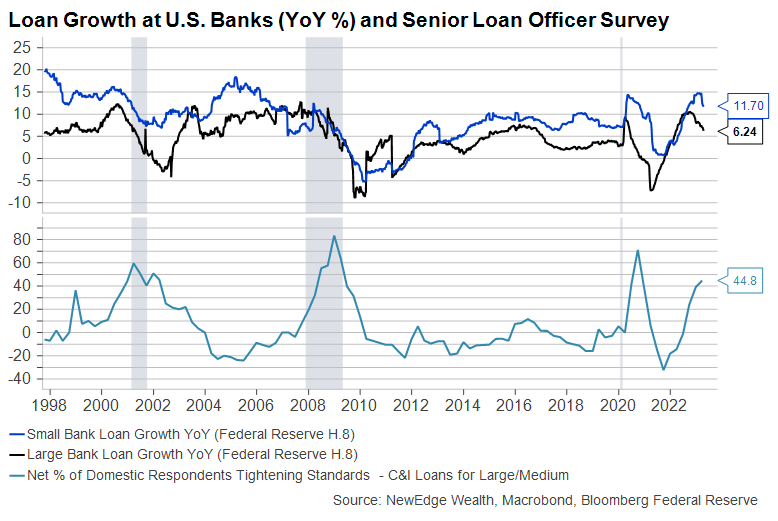
7. The Times They Are A-Changin’?: After a robust period of loan growth, primarily for small banks, the market is on watch for signs of sharp slowing in loan growth following regional bank issues. Interestingly, the Senior Loan Officer Survey had been pointing to tighter lending conditions and slower loan growth all through 2022, but loan growth remained robust (helping to explain 2022’s resilient economic growth). Today, regional banks have begun to guide to either slowing the pace of loan growth or even shrinking their balance sheets.
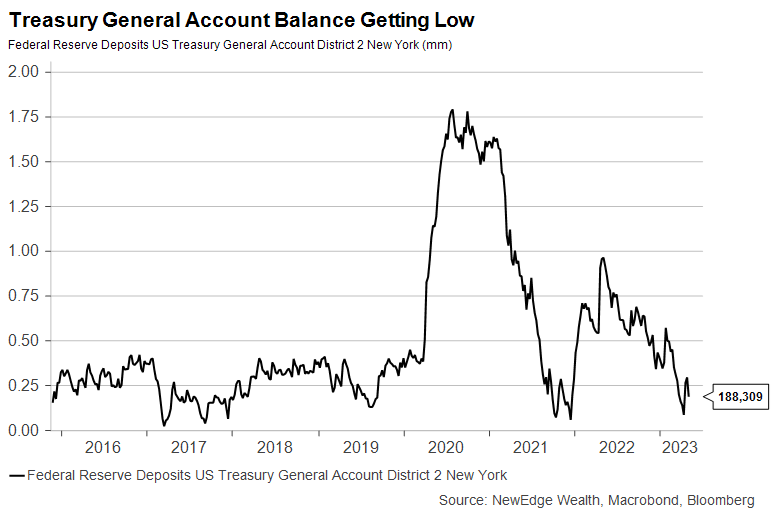
8. And Our Time is Running Out, You Can’t Push it Underground: The Debt ceiling fight was kicked into high gear this week when Treasury Secretary Yellen warned of a June “X-Date” (when the Treasury exhausts its extraordinary measures used to not go over the debt limit), sooner than analysts expected. The Treasury General Account nearing zero (this account falls when the Treasury spends its cash instead of issuing new bonds) will drive the urgency around a solution to the debt ceiling.
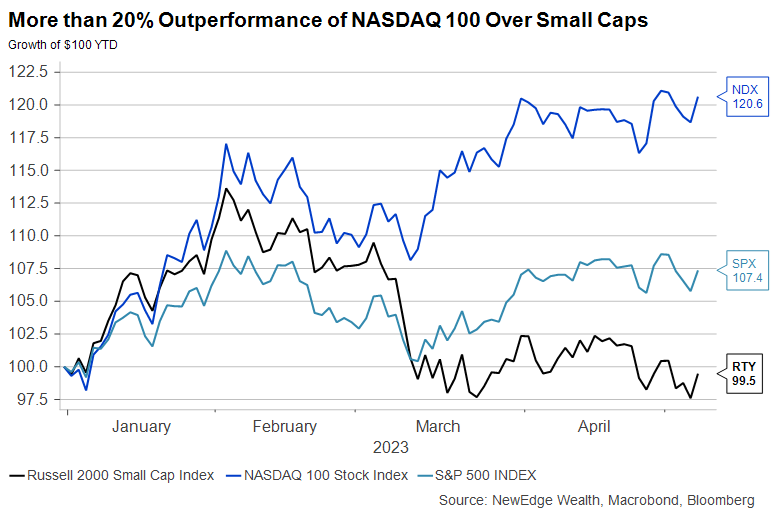
9. Well, it’s (Not) Alright to be Little Bitty: Small caps (Russell 2000), though possibly Alan Jackson’s favorite index, continue to under perform large and mega-cap indices. Small caps and other risk-on/pro-cyclical assets often lead coming out of major market lows, so small caps’ underperformance in 2023 is notable given hopes that equity markets have entered a new bull phase. Small caps are lower quality and more interest rate sensitive, with 40% of Russell 2000 companies being unprofitable, with a high exposure to floating rate debt.
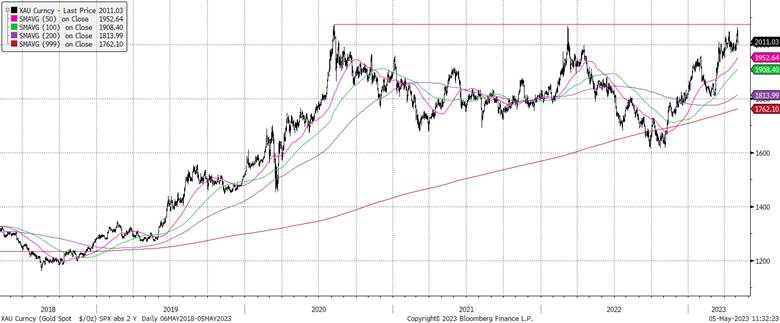
10. Knockin’ on Heaven’s Door: Gold continues to try to make a run for a new all-time high, but has yet to break through. Friday’s strong jobs report and bank stabilization led to a sharp sell-off in Gold on the day. Gold will likely continue to benefit on risk-off days marked by U.S. financial stability concerns (lower yields and a weaker USD), while it could lag on risk-on days supported by resilient data (higher yields and a stronger USD).
Gold Spot (XAU Currency)
Top Points of the Week
By Jay Peters and Ben Emons
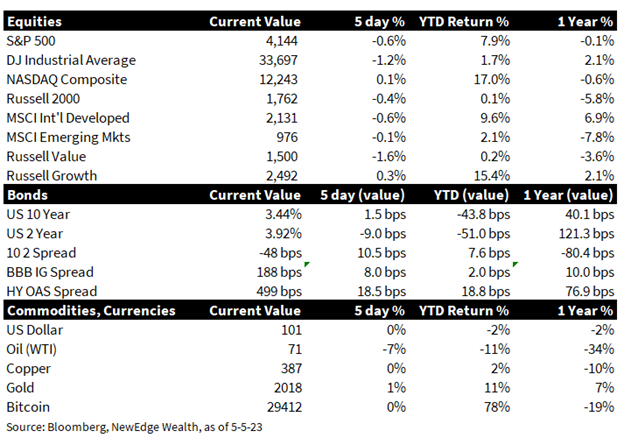
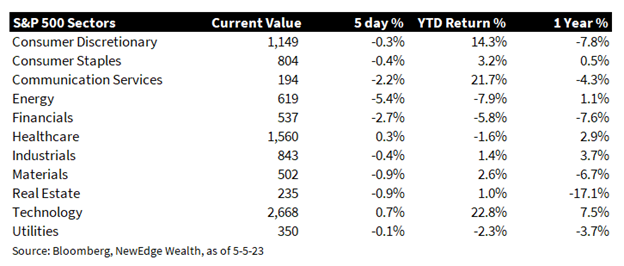
- Equities weaker: Large-cap U.S. equities declined for the week, although Friday’s strong labor report helped markets recover some of these losses on Friday. For the week the S&P500 declined, while growth equities (Russell 1000 Growth) outperformed value equities (Russell 1000 Value) by nearly 2%. Technology was the top-performing sector of the week, driven by solid results from Apple Inc., which beat both top and bottom-line expectations.
- Earnings highlight (AAPL): The largest U.S. company Apple, reported fiscal 2Q23 earnings on Thursday and results exceeded analyst expectations on both the top and bottom lines. Revenues declined (-2.5%) year over year but were above expectations. Earnings were flat year over year, driven by resilient iPhone and services demand, which offset continued weakness in iPad and Mac products. CEO Tim Cook emphasized a continued challenging macro environment on the earnings call while the expansion in gross margins indicates Apple continues to efficiently manage its supply chain. The company also announced a $90B share repurchase authorization, the same level as 2022.
- Earnings next week: We are now in the late innings of the first quarter earnings season and notables reporting next week include Disney, Paypal, and Devon Energy. This weekend is highlighted by results from Berkshire Hathaway on Saturday. As usual, investors will focus on commentary from the Oracle of Omaha regarding both the economic environment and companies/industries where Berkshire has significant stakes. The largest Berkshire holdings include Apple, Bank of America, Chevron, Coca-Cola, and American Express.
- Economic Data next week: Inflation data for April will take center stage on the economic front next week with the Consumer Price Index (CPI) data released on Wednesday. Expectations call for a 5% year-over-year increase in the Headline CPI, matching the March report, but down from the 8.3% read from April of 2022. If 5% is the actual CPI reading it will be the first time the current Fed Funds rate will have exceeded the broad inflation rate since early 2020.
- Fed Meeting: On Wednesday, the FOMC voted to raise policy rates 25 bps to 5.25% at the upper bound. The policy statement was watched closely for signs that this hike could be the last in the cycle. The statement changed key language from “some additional policy firming may be appropriate” to “the extent to which additional policy firming may be appropriate.” This is a signal of a possible conditional pause of tightening that depends on data and the Fed’s assessment of the banking crisis on credit conditions and the economy. Powell reiterated that rate cuts were not likely this year because inflation remains persistently above their 2% target.
- Banking Crisis update: In the wake of JP Morgan’s acquisition of First Republic, regional bank stocks sold off sharply. The market priced in the possibility of stock and bondholders being wiped out in the future if the next regional bank is seized by the Federal Deposit Insurance Corporation before an acquisition. The stock prices of regional banks PacWest and Western Alliance experienced sharp volatility during the week (falling 50%+, rallying 80% in a day, for example).
- Yields on the move: As the banking crisis’s second phase unfolded, a flight to safety pushed yields lower. The 2-year yield declined by 20 basis points on the week as the market reassessed the Fed’s next move in June. The Fed Funds futures imply a 90% probability of that the Fed will keep rates unchanged in June, and a 30% percent chance that the Fed will cut rates in July. The volatility of Treasury yields remained elevated on stronger-than-expected ISM Manufacturing prices paid index and non-farm payrolls (with stronger data putting upward pressure on yields). The 10-year yield ended the week below the 200-day moving average and near the critical support zone of around 3.4%.
- Non-Farm Payrolls: The jobs report showed no signs of a recession. In April, 253,000 jobs were added compared to 185,000 expected. The report showed broad strength across sectors with healthcare adding 64K, goods-producing added 33K, and financial services added 23K in new jobs. Temporary employment fell by 23K, while leisure and hospitality slowed to 31K. The labor force participation headline was flat at 62.6% but average hourly earnings rose by 0.5% M/M and 4.4% Y/Y.
- US data: ISM Manufacturing saw a rebound in employment into expansion territory at 50.2, and the prices paid index rose to 53.2, the highest since July last year. New orders and sentiment improved. ISM Services prices paid rose to 59.3 although employment slipped to 50.8. The ADP report surprised at 296K vs. 150K expected with small and mid-size companies’ robust hiring. The JOLTS data showed a third consecutive monthly decline in job openings.
- Other Central banks: The Australian central bank surprised markets by hiking by 25 basis points versus expectations of a pause. The RBA cited that inflation was too high and the hike reaffirmed their determination to bring inflation to target. The ECB raised rates by 25 basis points and communicated clearly there would not be a pause or rate cut in the foreseeable future.
IMPORTANT DISCLOSURES
Abbreviations: CPI: Consumer Price Index; ECB: European Central Bank; EPS: Earnings per Share; Fed Fund futures are a direct reflection of collective marketplace insight regarding the future course of the Federal Reserve’s monetary policy; FOMC: Federal Open Market Committee; JOLTS: Job Openings and Labor Turnover Survey; Oracle of Omaha: Warren Buffet; Powell: Jerome Powell, Chair of the Board of Governors of the Federal Reserve System; RBA: Reserve Bank of Australia; Senior Loan Officer Survey: the Senior Loan Officer Opinion Survey on Bank Lending Practices is a survey the Federal Reserve conducts to gain insight into bank lending practices and conditions. The voluntary survey polls up to 80 large domestic banks and 24 branches of international banks.
Index Information: All returns represent total return for stated period. S&P 500 is a total return index that reflects both changes in the prices of stocks in the S&P 500 Index as well as the reinvestment of the dividend income from its underlying stocks. Dow Jones Industrial Average (DJ Industrial Average) is a price-weighted average of 30 actively traded blue-chip stocks trading New York Stock Exchange and Nasdaq. The NASDAQ Composite Index measures all NASDAQ domestic and international based common type stocks listed on the Nasdaq Stock Market. Russell 2000 is an index that measures the performance of the small-cap segment of the U.S. equity universe. MSCI International Developed measures equity market performance of large, developed markets not including the U.S. MSCI Emerging Markets (MSCI Emerging Mkts) measures equity market performance of emerging markets. Russell 1000 Growth Index measures the performance of the large- cap growth segment of the US equity universe. It includes those Russell 1000 companies with relatively higher price-to-book ratios, higher I/B/E/S forecast medium term (2 year) growth and higher sales per share historical growth (5 years). The Russell 1000 Value Index measures the performance of the large cap value segment of the US equity universe. It includes those Russell 1000 companies with relatively lower price-to-book ratios, lower I/B/E/S forecast medium term (2 year) growth and lower sales per share historical growth (5 years). The BBB IG Spread is the Bloomberg Baa Corporate Index that measures the spread of BBB/Baa U.S. corporate bond yields over Treasuries. The HY OAS is the High Yield Option Adjusted Spread index measuring the spread of high yield bonds over Treasuries.
ISM manufacturing prices paid is a diffusion index of ISM Manufacturing PMI calculated by adding the percent of responses indicating they paid more for inputs plus one-half of those responding that they paid the same for inputs. The Services ISM Report on Business is based on data compiled from purchasing and supply executives nationwide. Membership of the Services Business Survey is diversified by NAICS, based on each industry’s contribution to gross domestic product (GDP).
Sector Returns: Sectors are based on the GICS methodology. Returns are cumulative total return for stated period, including reinvestment of dividends.
The views and opinions included in these materials belong to their author and do not necessarily reflect the views and opinions of NewEdge Capital Group, LLC.
This information is general in nature and has been prepared solely for informational and educational purposes and does not constitute an offer or a recommendation to buy or sell any particular security or to adopt any specific investment strategy.
NewEdge and its affiliates do not render advice on legal, tax and/or tax accounting matters. You should consult your personal tax and/or legal advisor to learn about any potential tax or other implications that may result from acting on a particular recommendation.
The trademarks and service marks contained herein are the property of their respective owners. Unless otherwise specifically indicated, all information with respect to any third party not affiliated with NewEdge has been provided by, and is the sole responsibility of, such third party and has not been independently verified by NewEdge, its affiliates or any other independent third party. No representation is given with respect to its accuracy or completeness, and such information and opinions may change without notice.
Investing involves risk, including possible loss of principal. Past performance is no guarantee of future results.
Any forward-looking statements or forecasts are based on assumptions and actual results are expected to vary from any such statements or forecasts. No assurance can be given that investment objectives or target returns will be achieved. Future returns may be higher or lower than the estimates presented herein.
An investment cannot be made directly in an index. Indices are unmanaged and have no fees or expenses. You can obtain information about many indices online at a variety of sources including: https://www.sec.gov/answers/indices.htm.
All data is subject to change without notice.
© 2026 NewEdge Capital Group, LLC
