


By Ben Lope and Jay Peters, CFA®
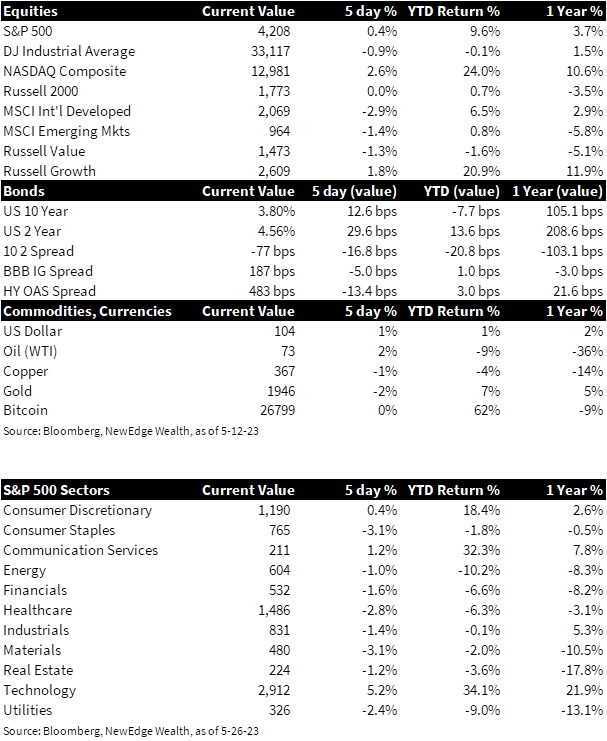
- Equities: Broad US equity indices marched higher on the Friday leading into Memorial Day Weekend, resulting in the S&P 500 notching a slight weekly gain while the tech-heavy NASDAQ and Russell 1000 indices produced weekly gains of 1.5% – 2.5% and the Dow Jones Industrial Average and Russell 1000 Value indices fell 1.0% – 1.5% on the week. Momentum and optimism surrounding market opportunities in artificial intelligence pushed growth names higher despite a general increase in yields. International indices produced negative weekly returns as the USD strengthened by over 1.0%.
- Yields Climb: U.S. Treasury yields rose for the week, primarily at the front end with the 2-Year Yield rising 37bps and the 10-Year yield rising 17bps, both of which reached the highest levels since March. Yields were lifted by positive economic data, inflationary pressures, and late week progress towards a debt ceiling resolution. The yield curve measured by the spread between 2-Year and 10-Year yields, inverted further to -75bps which is the deepest inversion since mid-March.
- U.S. Inflation Picks Up: On Friday, the monthly release of the personal consumption expenditures price index or PCE, one of the Fed’s preferred inflations gauges, illustrated prices rising at a faster-than-expected +0.4% in April, and +4.4% YoY. The core measure which excludes food and energy also came in above expectations rising +0.4% from the prior month and +4.7% YoY. The monthly increases were the highest since January, evidence that inflation remains sticky and well above the Fed’s 2% target. The data increased the odds of a hike at the next Fed meeting on June 14th to 58%.
- Oil Prices Edge Higher: WTI prices inched higher for the week, rising above $72 a barrel. Oil prices continue to reflect concerns about slowing global economic growth and restrictive monetary policies, although supply and demand fundamentals remain broadly constructive. OPEC+ meets on June 4th and thus far there have been mixed messages about the potential for a further supply cut.
- U.S. Equity Earnings Update: More than 97% of S&P 500 constituents have reported first quarter earnings and the results have been better than expected. Overall earnings are on pace to decline 2.1% on the quarter, which would mark the second straight quarter of declining earnings but is well above March 31st consensus estimates for a 6.7% decline in broad earnings. Encouragingly, consensus expectations still call for positive full year earnings growth of 1.3%, with a projected 6.3% decline in Q2 earnings to be offset by growth of 1.0% and 8.4% in Q3 and Q4, respectively. A quiet week on the earnings front was jolted by a report from semiconductor company Nvidia, which rose 24% after reporting first quarter results. The increased guidance was the main story, as management expected second quarter revenues to be more than 50% above analyst expectations, driven by robust demand for their GPUs which offer faster processing of AI models.
- Fed Minutes Highlight Divergent Views: This week offered a look at the Fed’s May 2nd policy meeting minutes, which broadly indicated officials were leaning towards pausing rate increases at the June meeting. The minutes showed a clear difference of opinion among members however, with some members saying, “more tightening may not be necessary” and other saying more increases would “likely be warranted”. With odds of a June hike above 50% and a July hike around 40%, we believe it is increasingly likely that an additional hike may be implemented over the next two months.
- U.S. GDP Shows Surprising Resilience: Both first quarter GDP and consumer spending were revised higher this week, with GDP rising at a 1.3% annualized rate and consumer spending rising at a 3.8% annualized rate, illustrating that American consumers continued to spend in the first few months of the year, supported by a strong labor market. The first quarter GDP growth represents a decline from the 2.3% annualized growth in the fourth quarter of 2022, although it remains in expansionary territory.
- Debt Ceiling Update: Round-the-clock negotiations between the Biden administration and the Republican team operating alongside House Speaker Kevin McCarthy are contributing to what the Speaker has called continued “progress,” but a stalemate on the ultimate level of government spending allowed under a renewed debt ceiling bill leaves us without a resolution heading into Memorial Day weekend. If a solution is not reached within the next 5 days, the United States will cross into the “x date” period, upon which, by Treasury Secretary Janet Yellen’s estimation, the Treasury may exhaust their ability to continue funding the government through extraordinary measures, potentially forcing a sovereign debt default. Both sides are adamant about avoiding this uncharted scenario. Republicans have offered a two-year extension in government spending that holds all non-military and veteran-related spending at 2022 levels and allows the next round of negotiations to fall outside the 2024 election cycle, while Democrats have cited the need for increased spending to bolster IRS tax enforcement and entitlement program spending, among other priorities. Member of the House are on recess for Memorial Day weekend but have been made aware that that they should be prepared to return to Washington within 24 hours should deal terms be struck by the Democrat and Republican negotiation teams.
- Deeper Dive into NVDA/AI: Chip maker Nvidia (NVDA) announced earnings after the bell on Wednesday and forecasted current-quarter revenue of $11B vs. consensus expectations of just over $7B. The announcement highlighted opportunities in the nascent artificial intelligence (AI) landscape and sent shares over 30% higher in extended trading hours. NVDA closed 24% higher during Thursday’s regular trading hours and achieved the third largest one-day market capitalization increase in stock market history, vaulting NVDA close to the $1 trillion company club alongside AAPL, MSFT, GOOGL, and AMZN. The AI buzz proved contagious and pulled the broad semiconductor index up over 10% on the week. Competing narratives cast the AI revolution as either “the next internet” or yet another crypto/NFT/metaverse “hype trade.” Interestingly, despite the large rally in NVDA shares during the week, it ended the week at a lower P/E multiple (50x next twelve month earnings) than it started the (65x next twelve month earnings) thanks to a large upward revision in earnings expectations for the company.
- Earnings & Economic Data Next Week: Notable companies reporting next week include Salesforce (CRM) and Broadcom (AVGO). The release of May Consumer Confidence and Dallas Fed Manufacturing figures on Tuesday, JOLTS on Wednesday, ISM Manufacturing on Thursday, and non-farm payrolls on Friday will provide the Fed and market watchers plenty of data points to determine whether June’s FOMC meeting is a “live” meeting that could include further rate hikes, as Fed Funds Futures markets are increasingly predicting.
IMPORTANT DISCLOSURES
Abbreviations: AI: artificial intelligence; FOMC: Federal Open Market Committee; GDP: gross domestic product; GPU: graphic processing unit; ISM Manufacturing PMI: Institute for Supply Management Purchasing Managers Index; JOLTS: Job Openings and Labor Turnover Survey; OPEC+: a group of 23 oil-exporting countries which meets regularly to decide how much crude oil to sell on the world market; PCE: personal consumption expenditures; West Texas Intermediate (WTI) Crude: refers to a grade or a mix of crude oil, and/or the spot price, the futures price, or the assessed price for that oil; colloquially WTI usually refers to the price of the New York Mercantile Exchange WTI Crude Oil futures contract or the contract itself.
Index Information: All returns represent total return for stated period. S&P 500 is a total return index that reflects both changes in the prices of stocks in the S&P 500 Index as well as the reinvestment of the dividend income from its underlying stocks. Dow Jones Industrial Average (DJ Industrial Average) is a price-weighted average of 30 actively traded blue-chip stocks trading New York Stock Exchange and Nasdaq. The NASDAQ Composite Index measures all NASDAQ domestic and international based common type stocks listed on the Nasdaq Stock Market. Russell 2000 is an index that measures the performance of the small-cap segment of the U.S. equity universe. MSCI International Developed measures equity market performance of large, developed markets not including the U.S. MSCI Emerging Markets (MSCI Emerging Mkts) measures equity market performance of emerging markets. Russell 1000 Growth Index measures the performance of the large- cap growth segment of the US equity universe. It includes those Russell 1000 companies with relatively higher price-to-book ratios, higher I/B/E/S forecast medium term (2 year) growth and higher sales per share historical growth (5 years). The Russell 1000 Value Index measures the performance of the large cap value segment of the US equity universe. It includes those Russell 1000 companies with relatively lower price-to-book ratios, lower I/B/E/S forecast medium term (2 year) growth and lower sales per share historical growth (5 years). The BBB IG Spread is the Bloomberg Baa Corporate Index that measures the spread of BBB/Baa U.S. corporate bond yields over Treasuries. The HY OAS is the High Yield Option Adjusted Spread index measuring the spread of high yield bonds over Treasuries.
Sector Returns: Sectors are based on the GICS methodology. Returns are cumulative total return for stated period, including reinvestment of dividends.
The views and opinions included in these materials belong to their author and do not necessarily reflect the views and opinions of NewEdge Capital Group, LLC.
This information is general in nature and has been prepared solely for informational and educational purposes and does not constitute an offer or a recommendation to buy or sell any particular security or to adopt any specific investment strategy.
NewEdge and its affiliates do not render advice on legal, tax and/or tax accounting matters. You should consult your personal tax and/or legal advisor to learn about any potential tax or other implications that may result from acting on a particular recommendation.
The trademarks and service marks contained herein are the property of their respective owners. Unless otherwise specifically indicated, all information with respect to any third party not affiliated with NewEdge has been provided by, and is the sole responsibility of, such third party and has not been independently verified by NewEdge, its affiliates or any other independent third party. No representation is given with respect to its accuracy or completeness, and such information and opinions may change without notice.
Investing involves risk, including possible loss of principal. Past performance is no guarantee of future results.
Any forward-looking statements or forecasts are based on assumptions and actual results are expected to vary from any such statements or forecasts. No assurance can be given that investment objectives or target returns will be achieved. Future returns may be higher or lower than the estimates presented herein.
An investment cannot be made directly in an index. Indices are unmanaged and have no fees or expenses. You can obtain information about many indices online at a variety of sources including: https://www.sec.gov/answers/indices.htm.
All data is subject to change without notice.
© 2026 NewEdge Capital Group, LLC
