


As Federal Reserve Chairman Jerome Powell hosted the post-Federal Open Market Committee meeting press conference this week, he probably should have ditched the suit and worn a black t-shirt and ripped jeans instead, because he seemed to send one Wayne Campbell-like message to markets: “party on!”.
We couldn’t help but be reminded of 1992’s Wayne’s World as Powell delivered a dovish message and rallying markets shouted “game on!”.
For this week’s Weekly Edge, we have built a chart deck that overviews the Fed’s dovish message, important economic data, and market movements. You can access the chart deck here.
For those who would like a quick summary of the takeaways, they are as follows:
The Fed was dovish on multiple counts this week, signaling that they really want to cut rates.
- Still 3 Rate Cuts Despite Raising Growth and Inflation Forecasts: The updated Dot Plot maintained the median dot for 2024 at 3 cuts. This is despite the Fed raising its 2024 inflation target (2.6% vs. 2.4% in December for Core PCE) and growth target (2.1% vs. 1.4% in December for Real GDP). When asked about this dovish mix of higher growth and inflation and rate cuts, Powell said, “we continue to make good progress on bringing inflation down” and that financial markets “believe we will achieve that goal” [of 2% inflation]. Someone should show him 5 Year Breakeven inflation rates jumping to a new 1-year high of 2.48%.
- Comfort With or At Least No Push Back Against Easy Financial Conditions: When asked about the recent easing of financial conditions, Powell expressed zero concern and even zero acknowledgment that broad measures of financial conditions have eased back to 2021 ultra-easy levels. He instead said, “we do think that financial conditions are weighing on economic activity,” and discussed peripheral labor data that has slowed recently. This gave the green light to risk assets to rally, as Powell does not see these easy financial conditions as a risk to achieving the 2% inflation target (unlike the summer of 2022, when Powell talked down markets that had rallied in hopes of a policy pivot).
- A High Bar for Hikes/Hold, a Low Bar for Cuts: Powell signaled a much higher bar for further rate hikes and even a hold of current policy rates, compared to a lower bar to deliver on cuts. This is seen clearly in the revised forecasts for higher growth and inflation, combined with the continued expectation for 3 cuts. For markets, this appears to be a “have your cake and eat it too” moment, meaning risk assets can enjoy higher growth and still get rate cuts from the Fed, while also knowing that the Fed is willing to cut rates swiftly if growth were to soften. Said another way, “tails I win, heads you lose.”
- A Plan to Slow Quantitative Tightening (QT) and Keep Liquidity Ample: Powell discussed the emerging plan to begin to slow Quantitative Tightening (the shrinking of the Fed’s balance sheet) in order to keep liquidity ample. This is celebrated by liquidity-sensitive risk assets, which struggled in years like 2022 and 2018 when the Fed did allow liquidity to become scarcer.
Why was the Fed so dovish?:
- Despite U.S. economic resilience, they likely do not want to be late to the cutting game, given other central banks moved to cut rates this week (Switzerland, Mexico, Brazil).
- The Fed also does not seem overly concerned about the recent hot inflation data, instead it has expressed confidence that the recent disinflationary trends from 2023 will continue. Further, as described above, the Fed does not see easy financial conditions as working against their inflation goals.
- We are watching gasoline prices, commodity prices (Gold, copper, agricultural, etc.), and inflation breakevens as important signals that could challenge the Fed’s sanguine inflation view.
Market Observations:
- For yields: Yields remain in a range, where a break in either direction sends an important signal. A break higher could suggest stronger growth, higher inflation, and a challenge to the Fed’s easing plans. A break lower could suggest weaker growth, lower inflation, and the Fed delivering on rate cuts.
- For credit: Credit spreads for investment grade and high yield bonds hit new year-to-date lows this week and are nearing levels last seen during the ultra-easy period of 2021. This reflects rising forecasts for both economic and earnings growth for large companies (small cap earnings forecasts continue to be trimmed). Signs of complacency will have to be watched for closely, as tight spreads reflect less compensation investors receive for taking on risk. Factors like falling growth forecasts or a refinancing wave (at higher rates!) could cause spreads to widen.
- For equities: Equities cheered the combination of easier policy and stronger growth (as seen in credit as well). This boosted the S&P 500 PE multiple to a heady 21.2x forward earnings, back to 2021 territory when the Fed was easing policy aggressively. Abundant liquidity (bank reserves at a new YTD high and a new all-time high in money market balances) is also supporting elevated valuations. Sentiment and positioning are stretched but not extreme yet, suggesting a challenge in the medium-term and a high bar for upside surprise, but continued room to run in the short-term given powerful momentum. Rotations are happening under the surface, with Technology sector strength becoming narrower, while cyclical sectors like Industrials, Materials, Energy, and Financials are improving.
For more details, you can access the chart deck here.
Top Points of the Week
By Austin Capasso and Ben Lope
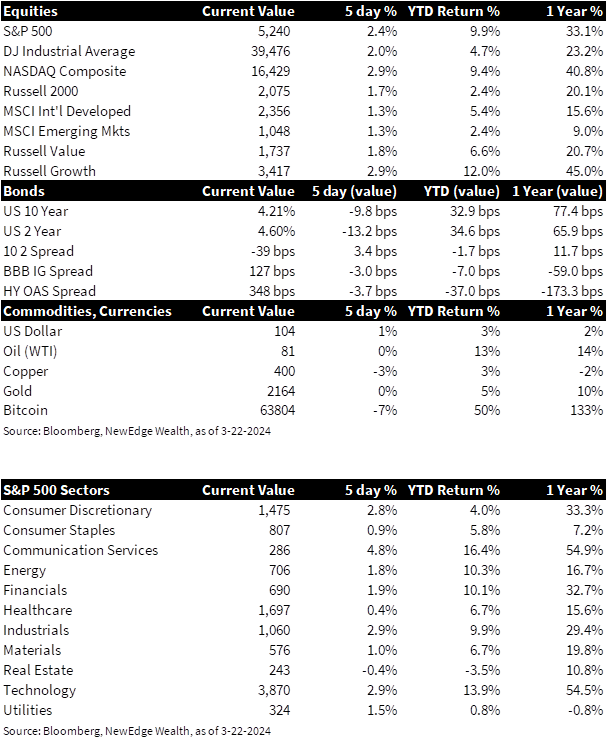
1. Equities – All three major indexes, S&P 500, Dow Jones, and Nasdaq, saw all-time highs this week after each rose over 2% as the AI and growth stock frenzy continues. Small caps within the Russell 2000 index also spiked nearly 2%, indicating a risk-on feel to markets.
2. Rates – Yields dropped this week as a result of the stellar performance in equity markets. The US 10 year remains around its 4.2% resistance range, finishing the week at 4.21%.
3. Commodities – Not much action in the commodities space this week, although copper saw a 3% move lower for the week after reaching an 11-month high last week. In the crypto space, Bitcoin saw a 7% move lower after its recent spike to an all-time high.
4. Fed Day Recap – Jerome Powell and the Federal Reserve met this week for the monthly Federal Open Market Committee (FOMC) meeting to discuss a decision on interest rates and the overall US economy. The meeting was extraordinarily dovish, and the Fed indicated they plan to cut rates despite the strong growth we have seen. The Fed seems to be giving themselves more leeway to reach their 2% target on inflation. Markets are projecting a 60% chance of a rate cut in June’s FOMC meeting.
5. Reddit’s Successful IPO – Reddit saw a 48% pop in its stock price after its initial public offering (IPO) onto the NYSE. The stock was initially priced at $34 per share and reached a top price of $57.80, which was an increase of 70%. It was interesting that the IPO lifted both equities and fixed income markets after the stock hit the market at such a large premium. Reddit’s results further indicate that IPO activity in the banking sector may start to heat up.
6. UK Inflation Comes in Lower Than Expected – We are starting to see deflationary trends around the globe. UK headline inflation fell to 3.4% on an annual basis in February, which was under the 4% posted in January and the lowest result since September 2021. On a monthly basis, the headline inflation rose by 0.6%, returning to positive territory after a -0.6% reading in January. The Bank of England (BOE) has been holding interest rates steady, but like other central banks, it seems like only a matter of time rate cuts are implemented.
7. Bank of Japan Hikes and Gets Rid of its YCC Policy – The Bank of Japan (BOJ) made a historic pivot to hike interest rates for the first time in 17 years, which brings an end to their 8 years of negative interest rates. The decision to finally hike rates came on the back of the country’s major corporations increasing wages for their workers to help them cope with the rising cost of living. The BOJ also abandoned their yield curve control (YCC) policy, where they would buy Japanese government bonds to control interest rates.
8. Earnings Update – The majority of major companies have already reported earnings for this quarter, but we will see announcements from GameStop and Walgreens. This week, we saw results from retail giants Lululemon and Nike, who both gave weaker guidance going forward, attributed to slower consumption and a shift in consumer spending towards experiences.
9. The Week Ahead – Next week is jam-packed with economic data. The marquee release will be the Personal Consumption Expenditures (PCE) Index, which is the Fed’s preferred measure of inflation. We will also see an abundance of Fed Speak from members like Jerome Powell (on Friday), Fed Governor Cook and Fed Governor Waller. Lastly, we get insight into the US consumer with results from durable goods, consumer confidence and personal spending.
IMPORTANT DISCLOSURES
Abbreviations/Definitions: AI: artificial intelligence; BOE: Bank of England; BOJ: Bank of Japan; Cook: Lisa D. Cook, member of the Federal Reserve Board of Governors;
Dot Plot: the Fed dot plot is published quarterly as a chart showing where each of the 12 members of the FOMC expect the federal funds rate to be for each of the next three years and the long term; Fed speak: refers to speeches about monetary policy given by members of the U.S. Federal Reserve Bord of Governors; FOMC: Federal Open Market Committee; GDP: gross domestic product; Quantitative tightening (QT): means the Fed is selling assets to put upward pressure on longer-term rates; PCE: personal consumption expenditures; PE: price to earnings ratio, the ratio of share price of a stock to its EPS; Powell: Jerome Powell, Chair of the Board of Governors of the Federal Reserve System; Waller: Christopher Waller, member of the Federal Reserve Board of Governors; YCC: Yield Curve Control is a monetary policy action whereby a central bank purchases variable amounts of government bonds or other financial assets in order to target interest rates at a certain level.
Index Information: All returns represent total return for stated period. S&P 500 is a total return index that reflects both changes in the prices of stocks in the S&P 500 Index as well as the reinvestment of the dividend income from its underlying stocks. Dow Jones Industrial Average (DJ Industrial Average) is a price-weighted average of 30 actively traded blue-chip stocks trading New York Stock Exchange and Nasdaq. The NASDAQ Composite Index measures all NASDAQ domestic and international based common type stocks listed on the Nasdaq Stock Market. Russell 2000 is an index that measures the performance of the small-cap segment of the U.S. equity universe. MSCI International Developed measures equity market performance of large, developed markets not including the U.S. MSCI Emerging Markets (MSCI Emerging Mkts) measures equity market performance of emerging markets. Russell 1000 Growth Index measures the performance of the large- cap growth segment of the US equity universe. It includes those Russell 1000 companies with relatively higher price-to-book ratios, higher I/B/E/S forecast medium term (2 year) growth and higher sales per share historical growth (5 years). The Russell 1000 Value Index measures the performance of the large cap value segment of the US equity universe. It includes those Russell 1000 companies with relatively lower price-to-book ratios, lower I/B/E/S forecast medium term (2 year) growth and lower sales per share historical growth (5 years). The BBB IG Spread is the Bloomberg Baa Corporate Index that measures the spread of BBB/Baa U.S. corporate bond yields over Treasuries. The HY OAS is the High Yield Option Adjusted Spread index measuring the spread of high yield bonds over Treasuries.
Sector Returns: Sectors are based on the GICS methodology. Returns are cumulative total return for stated period, including reinvestment of dividends.
The views and opinions included in these materials belong to their author and do not necessarily reflect the views and opinions of NewEdge Capital Group, LLC.
This information is general in nature and has been prepared solely for informational and educational purposes and does not constitute an offer or a recommendation to buy or sell any particular security or to adopt any specific investment strategy.
NewEdge and its affiliates do not render advice on legal, tax and/or tax accounting matters. You should consult your personal tax and/or legal advisor to learn about any potential tax or other implications that may result from acting on a particular recommendation.
The trademarks and service marks contained herein are the property of their respective owners. Unless otherwise specifically indicated, all information with respect to any third party not affiliated with NewEdge has been provided by, and is the sole responsibility of, such third party and has not been independently verified by NewEdge, its affiliates or any other independent third party. No representation is given with respect to its accuracy or completeness, and such information and opinions may change without notice.
Investing involves risk, including possible loss of principal. Past performance is no guarantee of future results.
Any forward-looking statements or forecasts are based on assumptions and actual results are expected to vary from any such statements or forecasts. No assurance can be given that investment objectives or target returns will be achieved. Future returns may be higher or lower than the estimates presented herein.
An investment cannot be made directly in an index. Indices are unmanaged and have no fees or expenses. You can obtain information about many indices online at a variety of sources including: https://www.sec.gov/answers/indices.htm.
All data is subject to change without notice.
© 2026 NewEdge Capital Group, LLC

