


As we pass the halfway point of the second quarter U.S. equity earnings season, this week we are providing our assessment of the current earnings environment, evaluating the expectations for earnings in 2024, and examining if more fundamentally driven equity performance is possible, which we believe will be key if markets are to build on gains generated in the first half of the year.
Summary
- As often happens in the short run, broad index valuations today have diverged from underlying fundamentals.
- Earnings growth continues to be pressured by profitability headwinds, yet markets continue to benefit from improved investor sentiment, enthusiasm for AI fueled growth, and hopes for a more accommodative Fed next year.
- Q2 earnings season has been better than expected but lackluster forward guidance has resulted in muted equity performance, and while we are approaching the trough in this earnings cycle, we expect a more modest recovery in earnings growth in 2024 due to continued margin pressures.
- Ultimately, we see a convergence between sentiment and fundamentals ahead, resulting in more modest equity market performance in the coming quarters and greater dispersion between those companies that can generate incremental margin expansion and those that can’t.
- Investors prioritizing profitability, valuation and shareholder return may be those who benefit the most in this environment.
Oh, we’ve gotta hold on, ready or not
You live for the fight when that’s all that you’ve got
Whoa, we’re half way there
Whoa oh, livin’ on a prayer
“Livin’ on a Prayer” – Bon Jovi
In our view, Bon Jovi’s 1986 song “Livin’ on a Prayer”, about enduring hard times, is a fitting analogy for the recent strength of U.S. equity markets amidst a precarious corporate earnings environment. This year has clearly demonstrated that earnings growth is not a prerequisite for equity market performance in the short run, as the increased odds of an economic soft landing, AI enthusiasm, and the prospect of peaking policy rates have led to 20% expansion in multiples, accounting for nearly all the year-to-date return of the S&P500 Index. However, over longer time periods earnings growth is not only important but a necessity as it drives the vast majority of equity market returns.
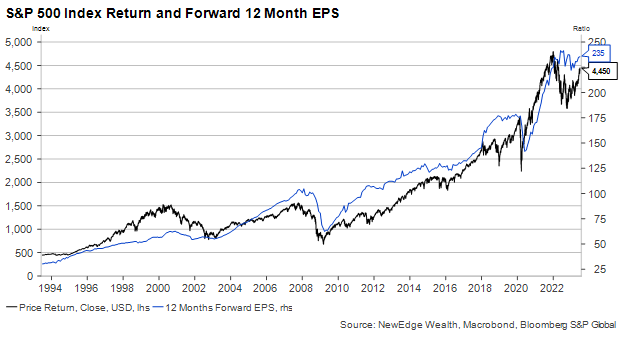
Over the past 30 years, the S&P500 Index has generated annualized total returns of 10.0% and over that same period earnings per share have grown at a 9.8% annualized rate. The last 30 years has seen wild valuation swings as well, as the forward P/E ratio (measuring price relative to the next twelve months earnings estimates), has traded between a low of 10x and a high of 31x, reflecting shifts in investor sentiment during several recessions, a tech bubble, a pandemic, and a period of massive fiscal and monetary stimulus. While investors who capitalize on these shifts in sentiment can be rewarded with higher returns when multiples expand, those opportunities can be few and far between. We believe time in the market is an investor’s best friend, and the combination of a valuation disciplined approach married with a consistent examination of future earnings growth provides the greatest opportunity for success.
Taking a step back, historically about half of corporate earnings have come from revenue growth, which tends to follow nominal GDP growth. The remainder comes from margin expansion, or the ability of companies to drive profitability through effective cost management and productivity enhancements. Share buybacks are also a factor but their contribution to long-term earnings growth is less than half a percent. With this in mind, it is clear that sustaining and growing margins is possibly the most important lever companies have in generating earnings growth and creating shareholder value.
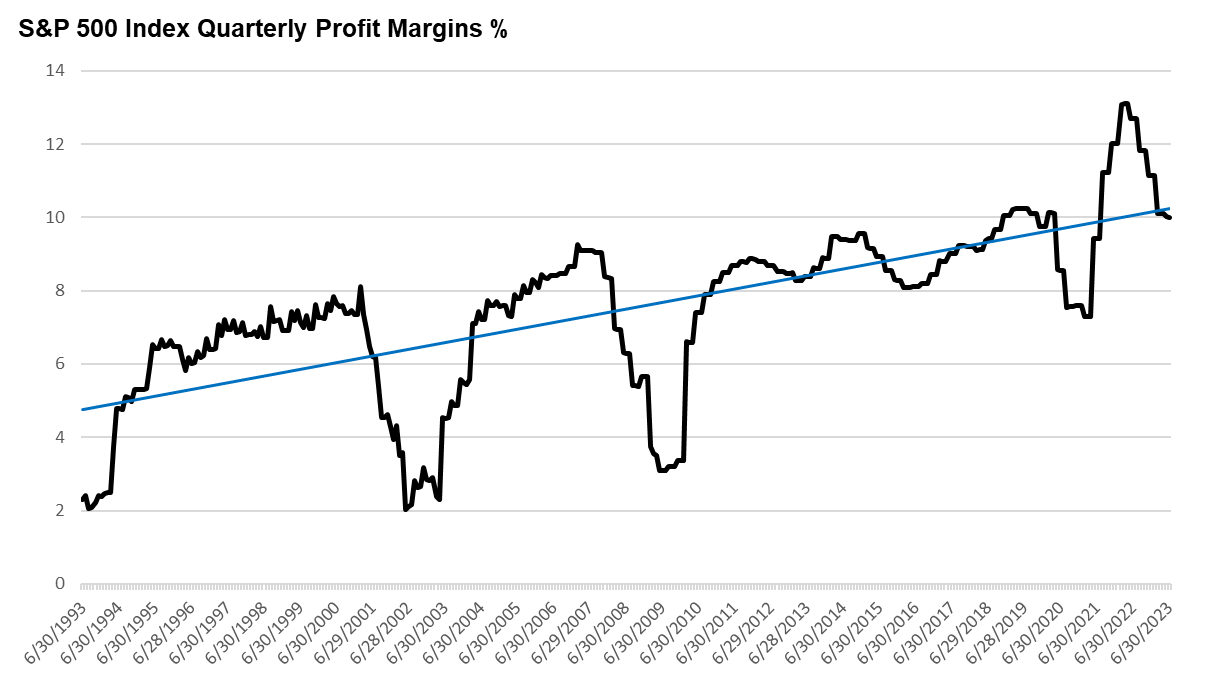
In our view, one of the most important market drivers over the past 30 years has been the threefold expansion in profit margins, driven by globalization, productivity enhancements, and falling borrowing costs and tax rates. Recently, these secular tailwinds have turned into headwinds and have caused profit margins to decline from record highs two years ago, to about 11.5% today. These continued margin pressures, combined with the stimulus fueled pull forward of earnings in prior years, are the main reasons why corporate profits have been in a prolonged decline this year.
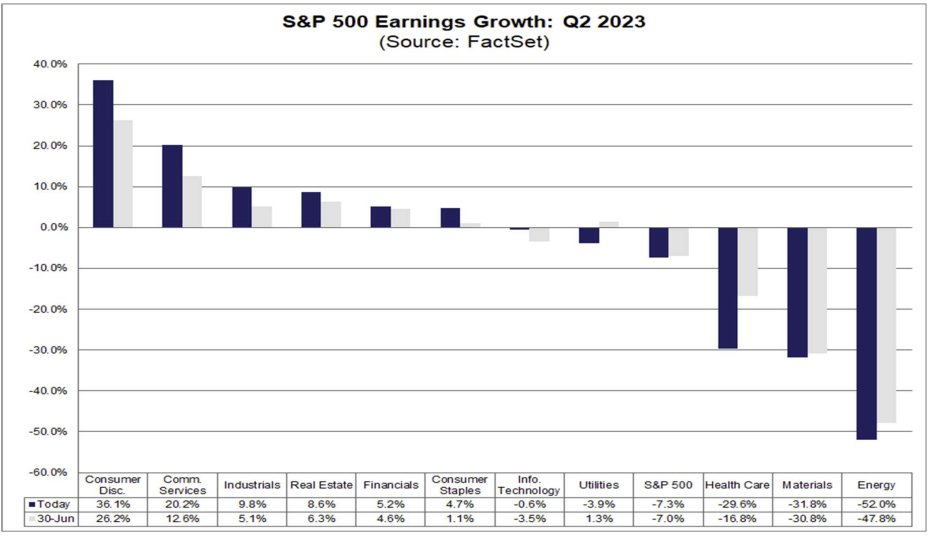
Turning to the current earnings season, with more than half of the S&P500 constituents reported, results so far have been better than expected. We are seeing 65% of companies beat top line estimates and 80% of companies beat bottom line estimates, led by the technology and communications sectors where earnings beats are averaging 90%. Results thus far have lifted year-over-year growth relative to expectations, although the absolute measures of earnings growth paint a more challenging picture. This will be the third straight quarter of declining earnings growth, with blended results now pointing to year-over-year declines in earnings of -6.5% and revenues of -0.5%. In addition, the magnitude of earnings beats is well below historical five-year average, and the average price return of companies that beat estimates is a disappointing -0.5%. In our view this reflects both the valuation environment, where many companies may be priced to perfection, and a reflection of weaker forward guidance around revenue growth and profitability.
The main drag on index level earnings growth has been the performance of the healthcare and energy sectors, which are seeing year-over-year declines in earnings of -30% and -52%. Both sectors are posting worse results than previously expected and are seeing the largest declines in profit margins of any sector. This drag has been partly offset by better-than-expected results in the discretionary and communications sectors, which have posted earnings growth of 36% and 20%, exceeding expectations by roughly 10%, and driven by increasing profit margins. Interestingly, on earnings calls, we are seeing a shift in what is causing margin pressures. Fewer companies are referencing the headwinds of recession, inflation, and supply shortages, yet more companies are mentioning higher costs, emphasizing the impact of continued wage pressures and a tight labor market on profitability.
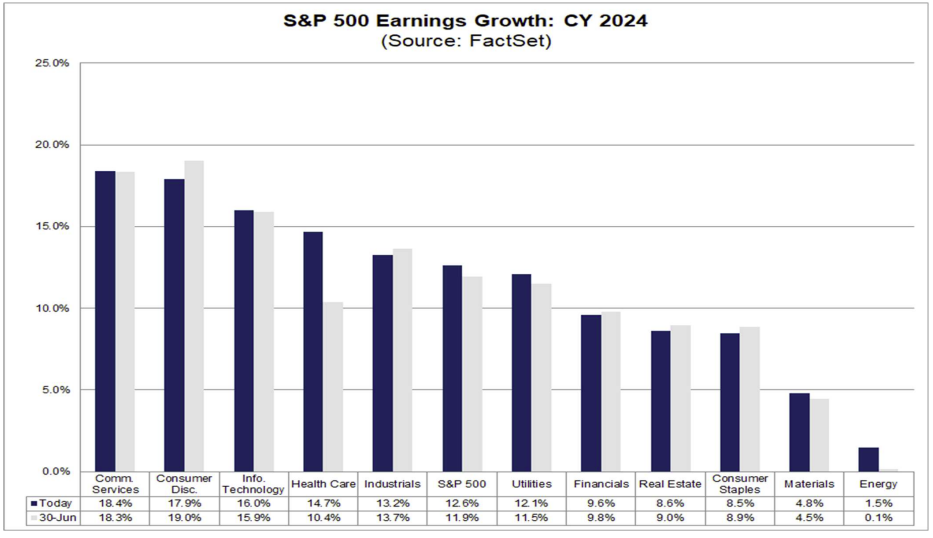
Looking ahead to 2024, the underlying earnings trends among sectors look poised to continue, with ongoing weakness in energy EPS and relative strength in communications and discretionary sector EPS. Consensus bottom-up estimates for S&P500 EPS in 2024 are currently $246, representing 12.6% year-over-year earnings growth and 5% revenue growth. Despite the increased odds of a soft landing, expectations for 2024 have not moved materially higher over the last several months, which can create a lower bar for earnings beats. However, this expectation of double-digit earnings growth in 2024 includes a return to the peak margin levels of 2021, a year that saw 16% revenue growth and more modest cost pressures. To achieve these peak margins in 2024 with one-third the revenue growth, we will need to see a dramatic reversal in the recent margin headwinds, including declining interest expenses, further declines in input cost and wage costs, and an even greater push towards production efficiency.
In our view, equity markets will emerge from the 2023 earnings trough in the quarters ahead, but we think the recovery in earnings growth will be more gradual than consensus expectations given the continued pressures on corporate profitability. Ultimately, we see a convergence between sentiment and fundamentals ahead, resulting in more modest equity market performance in the coming quarters and greater dispersion between companies that can generate incremental margin expansion and those that can’t. In this environment we continue to favor high quality companies, defined as those with industry leading profit margins, robust free cash flow generation, attractive relative valuation, and strong competitive advantages.
Top Points of the Week
By Austin Capasso
1. US equities and rates in the red – All three major US equity indexes finished with sizeable losses for the week. The S&P 500, Nasdaq, and Dow Jones Industrial indexes all ended the week in the red and notched their worst weeks since March. The downgrade of US long term debt initially pushed rates up but capped off the week negative overall.
2. Fitch Ratings downgrades US debt – Fitch Ratings downgraded the US government’s long term foreign currency issuer default rating to AA+ from AAA on Tuesday. The change was attributed to the repeated debt limit political standoffs and last minute resolutions, which wore away at Fitch’s confidence of fiscal management. Fitch placed the US credit rating on negative watch in May after mentioning they expect further fiscal deterioration and growing debt burden for the next three years.
3. Jobs report release for the month of July – Job growth in July pointed to a slight cooldown of the US economy. Nonfarm payrolls expanded by 187,000, which missed Dow Jone’s expectation of 200,000, but showed a modest gain from the downward revised number in June of 185,000. The unemployment rate was 3.5%, which puts the rate just above the lowest level since late 1969.
4. BOE hikes by 25bps – The Bank of England (BOE) increased rates by 25 bps on Wednesday, bringing the central bank’s main rate to 5.25% and lifting the rate to its highest level since February 2008. This is the 14th time in a row the BOE has raised their key interest rate. UK consumer prices were 7.9% higher on a year-over-year basis, compared with 5.5% in the Eurozone and 3% in the US. BOE members discussed pushing the key rate even higher if inflation remains persistent.
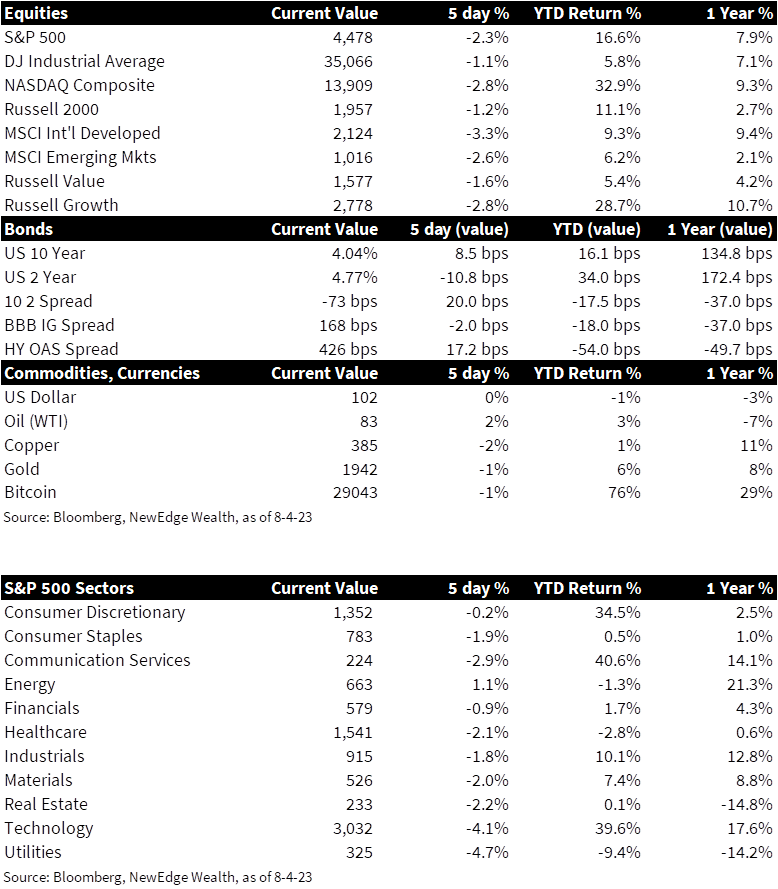
5. Saudi Arabia extends oil production cut – Despite US gas prices hitting nine-month highs, OPEC leader Saudi Arabia is extending its oil production cut for at least another month. This move would likely push gasoline and other energy prices even higher. WTI Oil currently has a price of $83 and is up 2% on the week and 3% year-to-date.
6. US productivity jumps by most since 2020 – US productivity jumped the most since 2020 after posting its biggest increase in the second quarter in almost 3 years. The 3.7% annualized increase reflects a sizeable rebound from the revised 1.2% pace for the first quarter. The latest reading ends 5 consecutive quarters of declines in US productivity on a year-over-year basis, mostly a result of workers having difficulty finding jobs during the pandemic.
7. Fed’s Senior Loan Officer Opinion Survey shows stricter credit conditions – The Fed’s Senior Loan Officer Survey released Monday. The survey is used by the Fed to get a view into credit and lending conditions to assist in their decisions to set interest rates and discount rates. The survey indicated further tightening across the board, citing stricter credit conditions and an overall decline in the demand for loans. Banks noted that lending conditions will likely continue to get tighter.
8. China Caixin PMIs release for July – The China Caixin Manufacturing PMI, measuring factory activity in China, slipped back into contractionary territory after the index fell to 49.2 from 50.5 in June. This was the first time in three months the manufacturing PMI fell below the 50 mark. The Services PMI, which gauges business activity in the services sector, popped to 54.1 from the recent five-month low in June of 53.9. The reading on the services PMI points to a continued recovery in the Chinese services sectors and the effects from recent stimulus China has been implementing into their economy.
9. Eurozone GDP beats expectations – Although recession fears remain, the Eurozone economy is showing resiliency after second quarter GDP beat expectations and inflation declined. GDP growth accelerated by 0.3%, beating the expected 0.2% increase. Headline inflation in the Eurozone read 5.3% for July, lower than the 5.5% reading registered in June but still well above the ECB’s target of 2%. Core inflation, which excludes food and energy, was disappointing after remaining unchanged from the previous month at 5.5%.
10. Next Week: CPI, PPI and more earnings releases – All eyes will be on the CPI and PPI reports on Wednesday and Friday respectfully, which will be a key data points in the Fed’s decision at the next FOMC meeting. Other notable economic releases next week include US Consumer Credit, NFIB Small Business Optimism Survey, and US Consumer Confidence. So far, 84% of companies in the S&P 500 have announced Q2 earnings.
IMPORTANT DISCLOSURES
Abbreviations: AI: artificial intelligence; BOE: Bank of England; China Caxin Services PMI: Caixin China General Services PMI seeks to provide the most up-to-date possible indication of what is happening in the country’s growing services industry by tracking variables such as sales, employment, inventories and prices; Caixin China General Manufacturing PMI: one of the first available indicators every month of the strength of the Chinese economy and is based on data compiled from monthly replies to questionnaires sent to purchasing executives in over 500 manufacturing companies; Consumer Confidence Survey: measures the level of consumer confidence in economic activity; Consumer credit: includes necessities such as food and discretionary purchases such as cosmetics or dry-cleaning services and reflects the portion of a family or individual’s spending that goes to goods and services that depreciate quickly; CPI: Consumer Price Index; ECB: European Central Bank; EPS: earnings per share; FOMC: Federal Open Market Committee; NFIB Small Business Optimism Index: The Small Business Optimism Index is a composite of ten seasonally adjusted components. that provides an indication of the health of small businesses in the U.S., which account of roughly 50% of the nation’s private workforce; Organization of the Petroleum Exporting Countries (OPEC) – The Organization of the Petroleum Exporting Countries is a cartel consisting of 13 of the world’s major oil-exporting nations that aims to regulate the supply of oil in order to set the price on the world market; PE: price to earnings ratio, the ratio of share price of a stock to its EPS; PPI: Producer Price Index; Senior Loan Officer Survey: the Senior Loan Officer Opinion Survey on Bank Lending Practices is a survey the Federal Reserve conducts to gain insight into bank lending practices and conditions. The voluntary survey polls up to 80 large domestic banks and 24 branches of international banks; West Texas Intermediate (WTI) Crude: refers to a grade or a mix of crude oil, and/or the spot price, the futures price, or the assessed price for that oil; colloquially WTI usually refers to the price of the New York Mercantile Exchange WTI Crude Oil futures contract or the contract itself.
Index Information: All returns represent total return for stated period. S&P 500 is a total return index that reflects both changes in the prices of stocks in the S&P 500 Index as well as the reinvestment of the dividend income from its underlying stocks. Dow Jones Industrial Average (DJ Industrial Average) is a price-weighted average of 30 actively traded blue-chip stocks trading New York Stock Exchange and Nasdaq. The NASDAQ Composite Index measures all NASDAQ domestic and international based common type stocks listed on the Nasdaq Stock Market. Russell 2000 is an index that measures the performance of the small-cap segment of the U.S. equity universe. MSCI International Developed measures equity market performance of large, developed markets not including the U.S. MSCI Emerging Markets (MSCI Emerging Mkts) measures equity market performance of emerging markets. Russell 1000 Growth Index measures the performance of the large- cap growth segment of the US equity universe. It includes those Russell 1000 companies with relatively higher price-to-book ratios, higher I/B/E/S forecast medium term (2 year) growth and higher sales per share historical growth (5 years). The Russell 1000 Value Index measures the performance of the large cap value segment of the US equity universe. It includes those Russell 1000 companies with relatively lower price-to-book ratios, lower I/B/E/S forecast medium term (2 year) growth and lower sales per share historical growth (5 years). The BBB IG Spread is the Bloomberg Baa Corporate Index that measures the spread of BBB/Baa U.S. corporate bond yields over Treasuries. The HY OAS is the High Yield Option Adjusted Spread index measuring the spread of high yield bonds over Treasuries.
Sector Returns: Sectors are based on the GICS methodology. Returns are cumulative total return for stated period, including reinvestment of dividends.
The views and opinions included in these materials belong to their author and do not necessarily reflect the views and opinions of NewEdge Capital Group, LLC.
This information is general in nature and has been prepared solely for informational and educational purposes and does not constitute an offer or a recommendation to buy or sell any particular security or to adopt any specific investment strategy.
NewEdge and its affiliates do not render advice on legal, tax and/or tax accounting matters. You should consult your personal tax and/or legal advisor to learn about any potential tax or other implications that may result from acting on a particular recommendation.
The trademarks and service marks contained herein are the property of their respective owners. Unless otherwise specifically indicated, all information with respect to any third party not affiliated with NewEdge has been provided by, and is the sole responsibility of, such third party and has not been independently verified by NewEdge, its affiliates or any other independent third party. No representation is given with respect to its accuracy or completeness, and such information and opinions may change without notice.
Investing involves risk, including possible loss of principal. Past performance is no guarantee of future results.
Any forward-looking statements or forecasts are based on assumptions and actual results are expected to vary from any such statements or forecasts. No assurance can be given that investment objectives or target returns will be achieved. Future returns may be higher or lower than the estimates presented herein.
An investment cannot be made directly in an index. Indices are unmanaged and have no fees or expenses. You can obtain information about many indices online at a variety of sources including: https://www.sec.gov/answers/indices.htm.
All data is subject to change without notice.
© 2026 NewEdge Capital Group, LLC

