


The When We Were Young Festival is this weekend, and though no NewEdge Wealth team members are joining the angsty youth in attendance, we can’t help but think that the emo music from this festival matches the mood of today’s market (don’t forget the song “answer key” after the last chart!).
The broad collection of charts looks at price action for the major U.S. equity indices, taking cues from market leadership about risk appetite and growth expectations. It also includes a look at yields and the drivers of the recent move higher, and highlights some of the recent deterioration in high yield spreads that are worth watching closely.
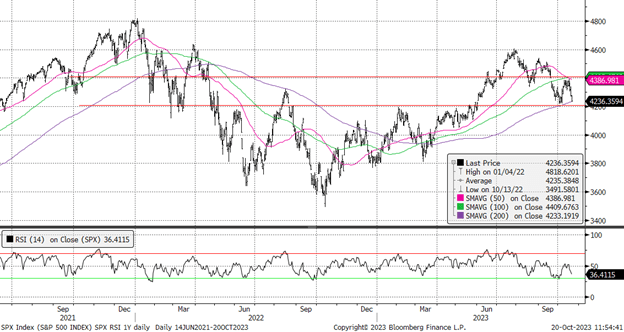
1. “The Mixed Tape”: It’s a tough tape for the S&P 500. The index is sandwiched between its moving averages, with the 50- and 100- day moving average at the top (~4,400) and the 200-day moving average at the bottom (~4,200). All eyes are on the 200-day moving average level to hold as a sign that the much-hoped-for fourth quarter seasonal rally could still materialize. Note that the index, though testing the 200-day on Friday, is not quite “oversold” again yet (as measured by the Relative Strength Index below), which could indicate that there is more digestion to come in the short term.
S&P 500 with its Relative Strength Index
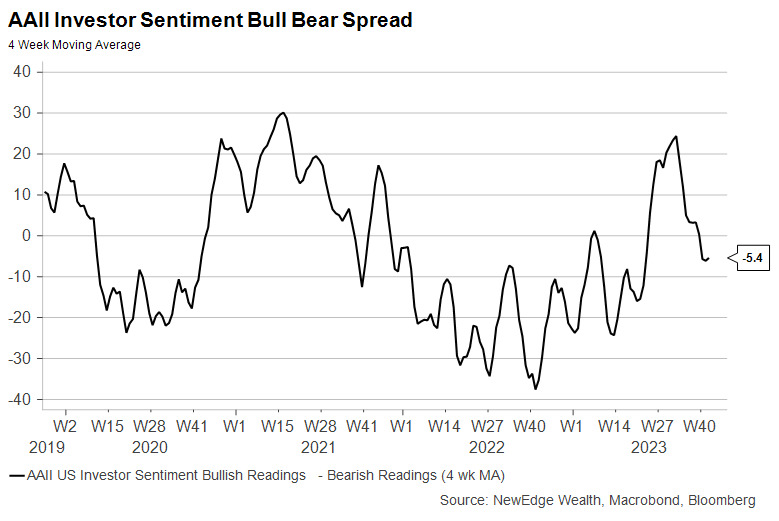
2. “Rapid Hope Loss”: After getting into a joyous mood over the summer as the U.S. equity barreled to its July peak, investor sentiment has deteriorated sharply since August. Notably, investors sentiment is not yet “washed out”, as seen by comparing today’s reading of the spread between AAII Bulls and Bears being well above the dire, hopeless, washed-out levels of late 2022.
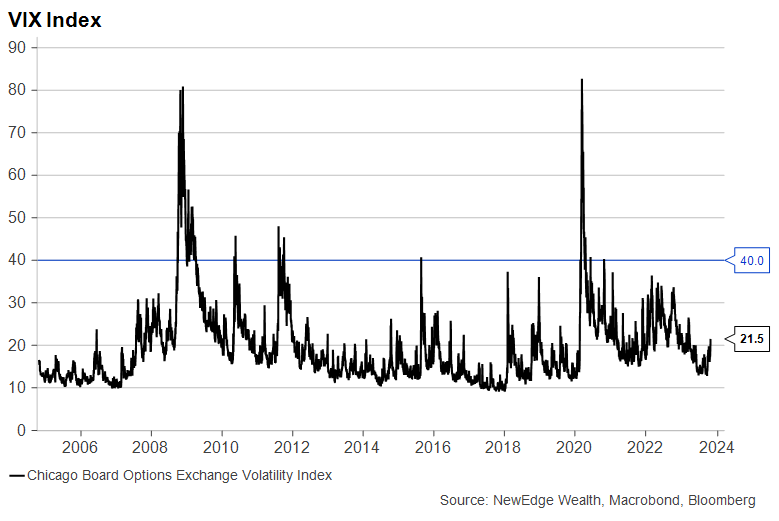
3. “The Ghost of You”: After being a “ghost” all through the August and September market weakness, volatility has finally started to pick up, with the VIX Index trading over 20 for the first time since the March banking woes. Spikes in volatility are often seen as a sign of market capitulation and peak pessimism, making the recent ghost-like behavior of the VIX leaving many to believe that more volatility was to come before this corrective phase is over.
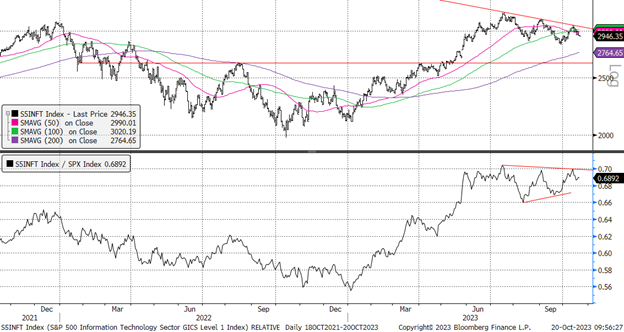
4. “… Sic Transit Gloria … Glory Fades”: One of the most important charts to watch in this market is the absolute and relative performance of the Technology sector given its weight in the index and psychological importance. After gloriously trouncing the market to start 2023, Tech peaked on an absolute and relative basis (vs. the S&P 500) in July. Encouragingly, Tech relative performance is holding up well despite higher rates and market volatility. This could be partially driven by “window dressing” (funds wanting to show they own the year’s winners) and tax gain deferral (not wanting to recognize gains late in the tax year), meaning relative performance should be closely watched as we roll into 2024.
S&P 500 Technology Sector Absolute (Top) and Relative to the S&P 500 (Bottom)
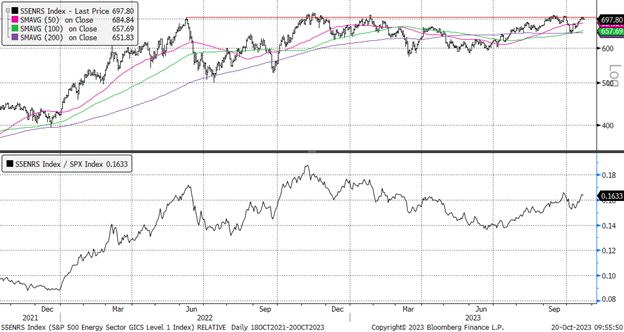
5. “The Only Exception”: Energy is one of the “only exceptions” in this market, showing strength on an absolute and relative basis, boosted by higher oil prices and likely geopolitical hedging. We do note that Energy continues to trade right below a powerful resistance level from June and November in 2022 and July and September in 2023. Breaking through this resistance will be an important next step in order for Energy to remain market leadership.
S&P 500 Energy Sector Absolute (Top) and Relative to the S&P 500 (Bottom)
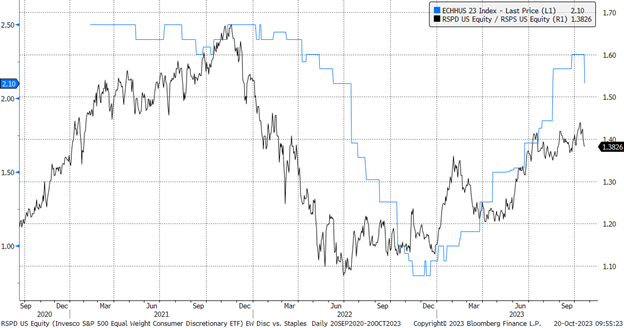
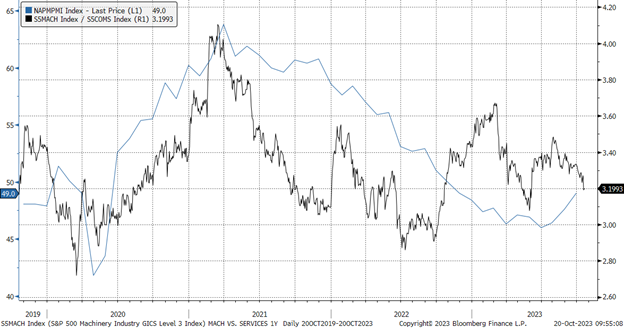
6. “The Future Freaks Me Out”: We continue to watch for signs from equity market leadership about the future path for growth in 2023 and beyond. The two most important ratios for this watch are the Equal Weight Consumer Discretionary vs. Consumer Staples and Machinery vs. Waste/Services industries within the Industrials sector. The former, Discretionary vs. Staples, has yet to weaken enough to signal that growth expectations for the consumer will soon be revised lower, while the latter, Machinery vs. Waste, broke down significantly this week, calling into question the consensus expectation of a coming rebound in manufacturing activity as measured by the PMI.
Equal Weight Consumer Discretionary vs. Consumer Staples & Bloomberg Consensus Forecast for 2023 Household Consumption in GDP
S&P 500 Machinery Industry vs. Industrial Professional Services (includes Waste) Industry & US Manufacturing ISM Purchasing Managers Index
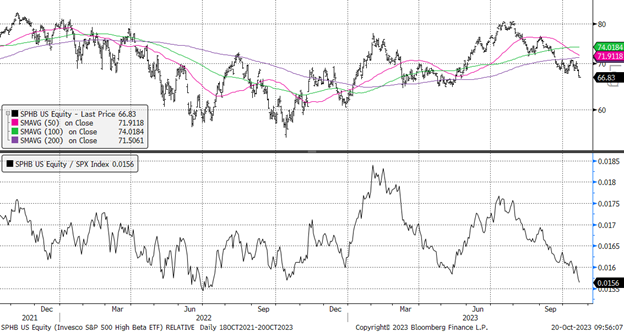
7. “You’re So Last Summer”: Looking back on the summer of 2023, we likely will call it the summer of “dead cats”, bounces that is. The summer saw many low-quality, speculative, beaten-up areas of the market rally as sentiment turned bullish and positioning chased into the market. This surge in risk-appetite was not enough to boost high beta stocks, an important barometer for risk appetite, to a new relative high, an important divergence we have flagged numerous times. We continue to see a turn in high beta stocks as an important indicator that we could be entering in a new risk-on period. This turn has yet to materialize.
S&P 500 High Beta ETF (SPHB) Absolute (Top) and Relative to the S&P 500 (Bottom)
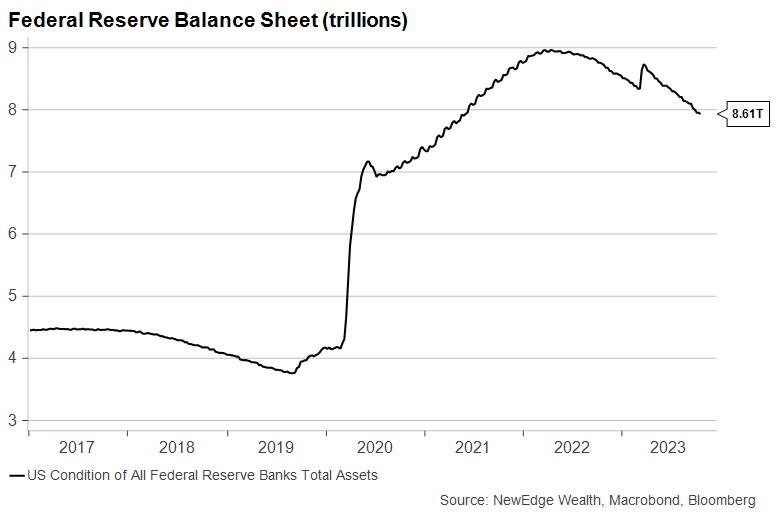
8. “A Decade Under the Influence”: After a decade plus of Quantitative Easing (the Fed expanding its balance sheet by buying bonds), the Fed has receded from the market by pursuing Quantitative Tightening (the Fed shrinking its balance sheet by selling bonds or not reinvesting bond maturities). This is an important reason why we have seen bond yields spike recently, as the Fed is removed as a “non-economic” buyer of bonds, able to absorb the recently higher Treasury issuance. This is why it is not entirely accurate when the Fed says it can let “the market do the work for it”, given the Fed is a big portion of “the market” after their unprecedented Quantitative Easing from the last cycle.
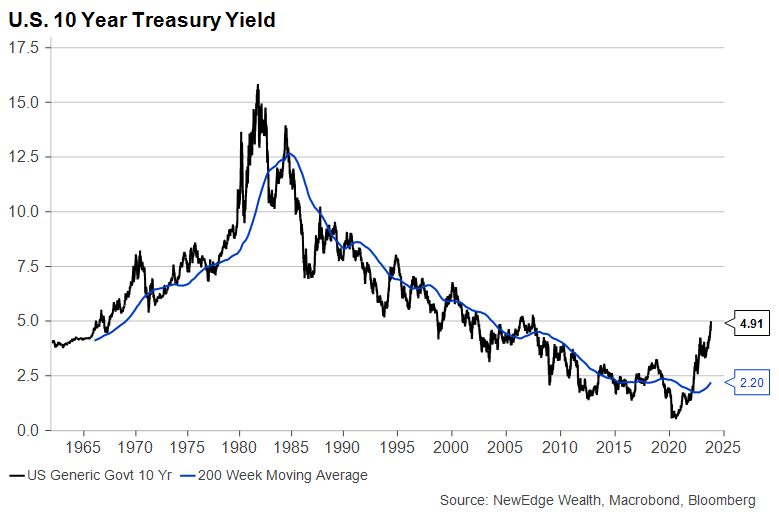
9. “Roses for the Dead”: The 40-year bond bull market is dead. This is not to say that yields will not fall in the future, they are likely to do so if growth were to weaken and the Fed were to return to easy policy. However, the era of a steady march lower in yields, with successive lower highs and lower lows since the early 1980s, is clearly behind us. This could have broad sweeping implications for asset price returns across the asset class spectrum.
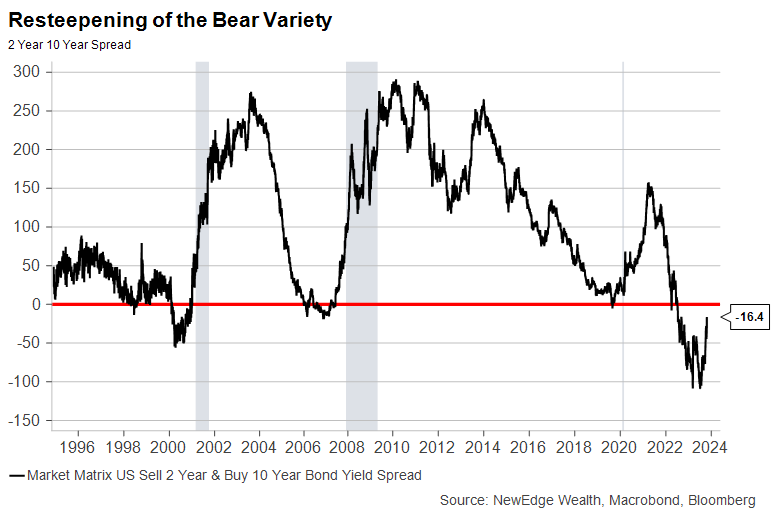
10. “The Curse of Curves”: The 10-2 curve, or the spread between the 10 Year Treasury and the 2 Year Treasury, has shrank materially in recent months as long end yields have shot higher while short end yields have only risen slightly. This dynamic of higher long end yields causing a resteepening of the yield curve, called a Bear Steepener, is a rare occurrence, mostly after such a deep inversion that was experienced earlier in the year. This is because after a prolonged period of inversion, recession risks are usually rising, which causes a resteepening driven by 2 Year yields falling at a faster pace than 10 Year yields (short rates falling price in coming Fed rate cuts, with this dynamic called a Bull Steepener). The degree of inversion and the sharp Bear resteepening speaks to the prior distortions in bond market pricing related to the Fed’s large balance sheet (described above).
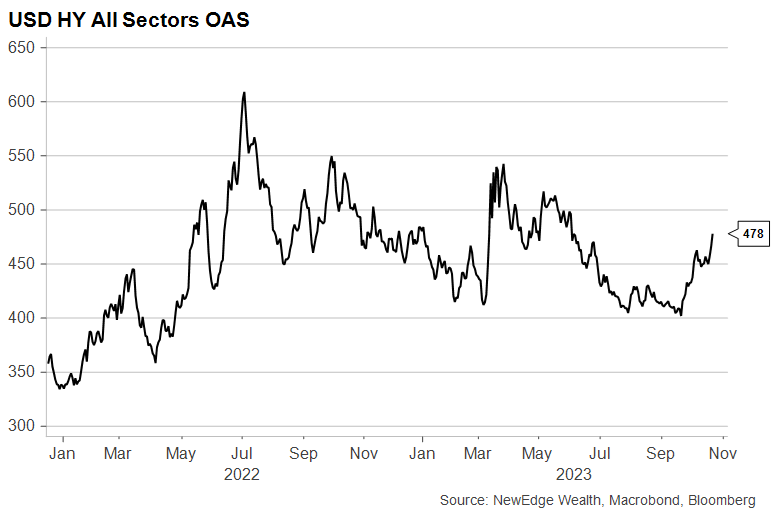
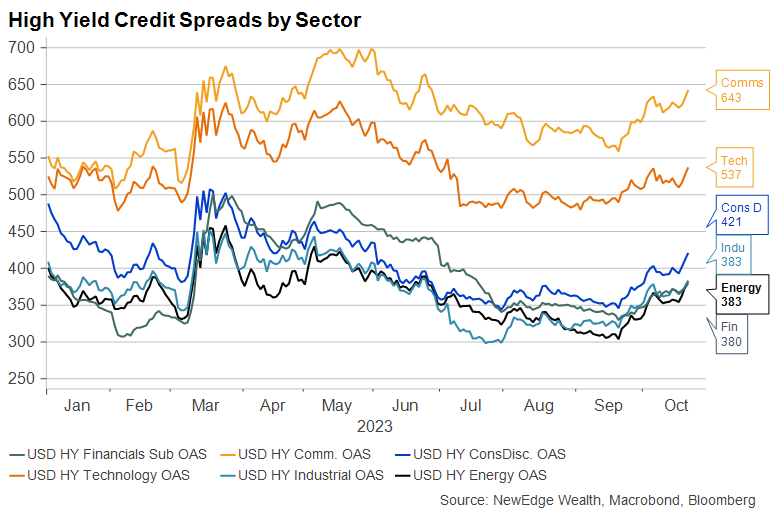
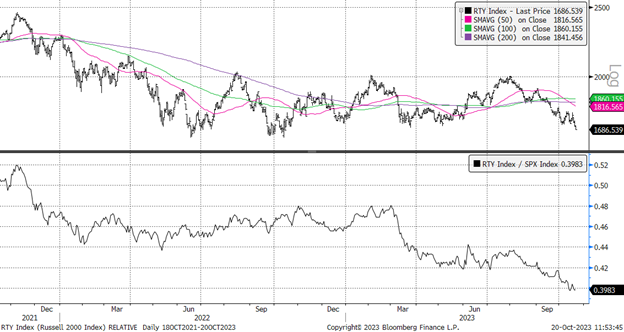
11. “What it is to Burn”: After being subdued in August and September, despite equity volatility, high yield spreads are starting to widen out, signaling the potential for less risk appetite and/or growing concerns about economic fundamentals. This could be a sign that investors are starting to appreciate that higher interest rates are beginning to have an impact on company fundamentals, as capital has grown more scarce and more expensive. The week also saw the high profile collapse of cash burning, venture-backed, darling transportation company, Convoy Inc., which illustrated the pressure that companies with floating rate debt face in this late-cycle environment. Related, the relative performance of the Russell 2000 Small Cap Index vs. the S&P 500 is shown below. Small cap companies tend to have higher debt levels and more floating rate debt, making this index an important example of the pressure of higher interest rates.
Russell 2000 Index Absolute (Top) and Relative to the S&P 500 (Bottom)
Top Points of the Week
By Austin Capasso and Ben Lope
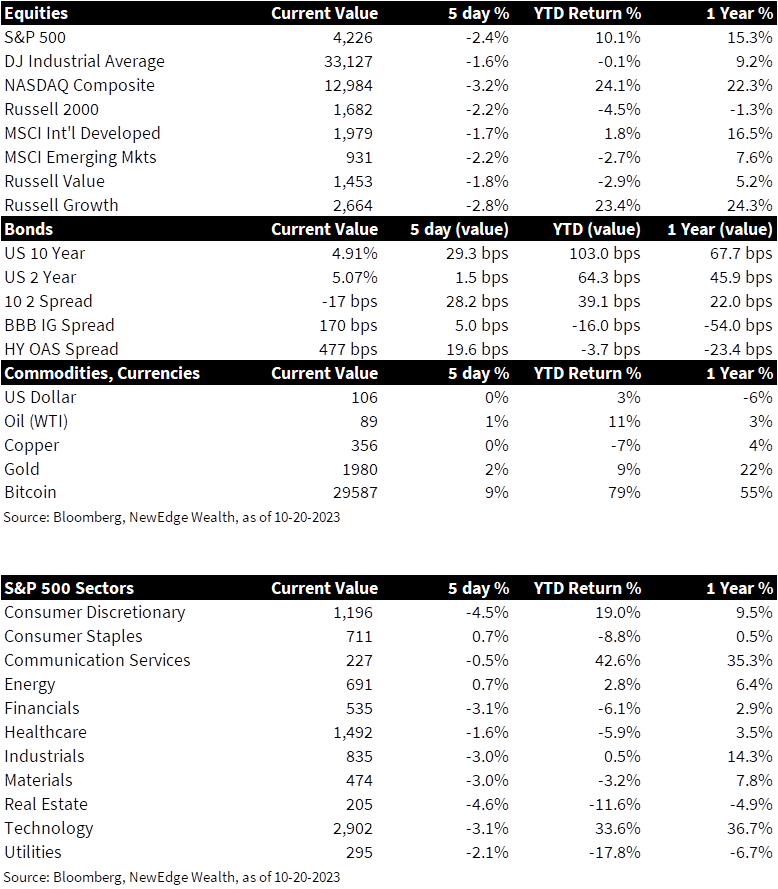
1. Global Equities Decline – Equity indices tracking US and international markets posted weekly declines. Within US markets, growth stocks and tech stocks were particularly challenged, as indicated by the 2.5%+ declines in the NASDAQ Composite and Russell 1000 Growth indices. Outside of the US, international developed equities faired only slightly better than emerging market equities, with indices from both markets down around 2% on the week.
2. Treasury Yields – The 2-10 year yield curve became significantly less inverted throughout the week as the yield on 2-year Treasury notes reversed a mid-week increase to end about flat, while yields the 10-year note increased by approximately 25bps. These movement resulted in the 2-10 year yield curve ending the week at its lowest level of inversion in over one year, about 16bps.
3. Oil Prices Increase Slightly – Despite rising tensions in the Middle East, oil prices remained mostly range bound throughout the week. Even without a large shock caused by the Israel-Hamas war, analysts expect oil prices to remain high through the end of the year, as the market remains tight after supply cuts from Saudi Arabia and Russia earlier this year, as well as the US’s stated intention of refilling the US Strategic Petroleum reserve via buying oil at $79/bbl or lower.
4. President Biden Visits Israel – President Biden landed in Israel on Wednesday to meet with Israeli Prime Minister Benjamin Netanyahu and other senior Israeli leaders to show support for the US’s closest Middle Eastern ally and further discuss how the US can assist the nation in their war with Hamas. Biden’s trip comes after two senior officials from his administration, Secretary of State Anthony Blinken and Defense Secretary Lloyd Austin, visited Israel last week. Biden and his administration have vocalized unwavering support for Israel and requested more than $105 billion aid from Congress to support the war effort on Friday for humanitarian assistance to Ukraine, Israel, Gaza “and other needs.”
5. “A Speaker Has Not Been Elected” – The US House of Representatives enters another weekend without a permanent Speaker of the House. After failing for the third time to receive enough votes on the House floor to assume the role, Ohio Congressman Jim Jordan lost an internal vote to continue as the Republican nominee for Speaker. Republicans, who are in the majority within the House, will likely wait until next week to restart the process of nominating a Speaker.
6. US Retail Sales Stronger Than Expected – Data released on Tuesday by the US Commerce Department showed that retail sales increased by 0.7% month-over-month, more than double economists’ expectations for a 0.3% increase. Treasury yields moved higher following the announcement, as the resilience of the US consumer has been a key contributor to the Fed’s hawkish policy stance. Despite the higher-than-expected reading, markets still expect the Fed to keep rates steady at the FOMC’s November 1 meeting.
7. US Housing Starts Increase as Mortgage Rate Hits Two-Decade High – Despite mortgage rates reaching the highest level in over two decades, US housing starts increased in September at a 7.0% monthly pace after falling by 12.5% in August. The monthly increase in homebuilding is probably reflective of the approval of permits that were filed earlier this year when mortgage rates were lower, as recent surveys of homebuilder sentiment showed a more pessimistic outlook than the headline housing starts data indicates.
8. US Initial Jobless Claims Hits Nine-Month Low – Data reported by the Labor Department showed 198,000 initial jobless claims for the week ended October 14, 13,000 lower than the previous week. This reading is the lowest since January, and when taken in conjunction with similarly rosy figures for retail sales, points to the continued resilience of the US consumer. Data points like these are being pointed to as indications that the Fed can and will keep interest rates “higher for longer.”
9. China Reports Better-Than-Expected Q3 GDP Figures – According to figures released on Wednesday by China’s National Bureau of Statistics, China’s economy grew by 4.9% in the third quarter of 2023 when compared to the same quarter last year. This level of growth exceeded economist expectations for Q3 GDP growth of 4.6%. Chinese officials are hopeful that a recent string of positive economic data releases is a sign that their economy is back on track after experiencing a sluggish rebound from restrictive covid-era policies.
10. Next Week: Earnings & Economic Announcements – Q3 earnings season continues next week and will see marquee names such as Microsoft (MSFT), Meta Platforms (META), and Amazon (AMZN) report. The economic front will remain relatively muted, as the Fed’s “quiet period” continues ahead of the two-day FOMC meeting scheduled to begin on Halloween. Notable economic data releases next week include Philadelphia Fed October nonmanufacturing figures on Tuesday, September New Home Sales on Wednesday, and October Consumer Sentiment on Friday.
Answer Key
1. “The Mixed Tape” Jack’s Mannequin
2. “Rapid Hope Loss” Dashboard Confessional
3. “The Ghost of You” My Chemical Romance
4. “… Sic Transit Gloria … Glory Fades” Brand New
5. “The Only Exception” Paramore
6. “The Future Freaks Me Out” Motion City Soundtrack
7. “You’re So Last Summer” Taking Back Sunday
8. “A Decade Under the Influence” Taking Back Sunday
9. “Roses for the Dead” Funeral For A Friend
10. “Curse of Curves” Cute is What We Aim For
11. “What it is to Burn” Finch
IMPORTANT DISCLOSURES
Abbreviations/Definitions: AAII’s Investor Sentiment Survey: shows the percentage of investors who are market bullish, bearish, or neutral on stocks; FOMC: Federal Open Market Committee; Quantitative Easing refers to the Fed buying assets to lower longer-term interest rates; Quantitative Tightening means the Fed is selling assets to put upward pressure on longer-term rates; Relative Strength Index (RSI): a technical indicator intended to chart the current and historical strength or weakness of a stock or market based on the closing prices of a recent trading period.
Index Information: All returns represent total return for stated period. S&P 500 is a total return index that reflects both changes in the prices of stocks in the S&P 500 Index as well as the reinvestment of the dividend income from its underlying stocks. Dow Jones Industrial Average (DJ Industrial Average) is a price-weighted average of 30 actively traded blue-chip stocks trading New York Stock Exchange and Nasdaq. The NASDAQ Composite Index measures all NASDAQ domestic and international based common type stocks listed on the Nasdaq Stock Market. Russell 2000 is an index that measures the performance of the small-cap segment of the U.S. equity universe. MSCI International Developed measures equity market performance of large, developed markets not including the U.S. MSCI Emerging Markets (MSCI Emerging Mkts) measures equity market performance of emerging markets. Russell 1000 Growth Index measures the performance of the large- cap growth segment of the US equity universe. It includes those Russell 1000 companies with relatively higher price-to-book ratios, higher I/B/E/S forecast medium term (2 year) growth and higher sales per share historical growth (5 years). The Russell 1000 Value Index measures the performance of the large cap value segment of the US equity universe. It includes those Russell 1000 companies with relatively lower price-to-book ratios, lower I/B/E/S forecast medium term (2 year) growth and lower sales per share historical growth (5 years). The BBB IG Spread is the Bloomberg Baa Corporate Index that measures the spread of BBB/Baa U.S. corporate bond yields over Treasuries. The HY OAS is the High Yield Option Adjusted Spread index measuring the spread of high yield bonds over Treasuries. VIX is the ticker symbol for the Chicago Board Options Exchange’s CBOE Volatility Index, a popular measure of the stock market’s expectation of volatility based on S&P 500 index options.
Sector Returns: Sectors are based on the GICS methodology. Returns are cumulative total return for stated period, including reinvestment of dividends.
The views and opinions included in these materials belong to their author and do not necessarily reflect the views and opinions of NewEdge Capital Group, LLC.
This information is general in nature and has been prepared solely for informational and educational purposes and does not constitute an offer or a recommendation to buy or sell any particular security or to adopt any specific investment strategy.
NewEdge and its affiliates do not render advice on legal, tax and/or tax accounting matters. You should consult your personal tax and/or legal advisor to learn about any potential tax or other implications that may result from acting on a particular recommendation.
The trademarks and service marks contained herein are the property of their respective owners. Unless otherwise specifically indicated, all information with respect to any third party not affiliated with NewEdge has been provided by, and is the sole responsibility of, such third party and has not been independently verified by NewEdge, its affiliates or any other independent third party. No representation is given with respect to its accuracy or completeness, and such information and opinions may change without notice.
Investing involves risk, including possible loss of principal. Past performance is no guarantee of future results.
Any forward-looking statements or forecasts are based on assumptions and actual results are expected to vary from any such statements or forecasts. No assurance can be given that investment objectives or target returns will be achieved. Future returns may be higher or lower than the estimates presented herein.
An investment cannot be made directly in an index. Indices are unmanaged and have no fees or expenses. You can obtain information about many indices online at a variety of sources including: https://www.sec.gov/answers/indices.htm.
All data is subject to change without notice.
© 2026 NewEdge Capital Group, LLC

