

Weekly Summary: February 20 – 24
Key Observations:
- This week’s economic data in general was reflective of a robust U.S. economy with greater than expected inflationary pressures in January. We have maintained that U.S. inflation would dissipate more quickly than consensus estimates until it reached a rate of inflation roughly around the 3.5% to 4.0% range before “stalling” at that level. But we never thought that this downtrend would be in a straight line. Like Federal Reserve (Fed) chair Powell, we thought that this “disinflationary” trend could be “bumpy.” We also have highlighted on previous commentaries that the “lagged” effects from tighter financial conditions and tighter monetary policies could be much shorter than many investors and analysts expect. To the extent that this is true, it would at least partly explain why the U.S. economy remains resilient. The “good” news in this scenario would be that a U.S. recession could be pushed out so that company earnings in the short to medium term could be better than expected. The “bad” news would be that the Fed might “overtighten” and in so doing, might actually increase the chance of a recession. If the Fed maintains its path of 25 basis points (bps) and if the rate of inflation can resume a relatively quick rate of disinflation, perhaps a U.S. recession could still be avoided if the Fed is truly “data dependent.” We have stressed that many seasonal distortions and “atypical” behaviors at the beginning of each year might account for the stronger than expected January economic data. We therefore remain reluctant to change our views until we analyze at least one more month of “fresh” economic data. We remain “data dependent.”
- We believe that this week’s trading in financial markets has highlighted how quickly the focus of financial markets can shift between concerns in regard to inflation and interest rates on the one hand and concerns over an economic slowdown on the other. However, this week’s concerns were focused on a slowing disinflation trend and a U.S. economy that could be “too strong” that could inhibit the disinflationary process. Even the relatively hawkish St. Louis Fed president James Bullard acknowledged that inflation could still dissipate in the midst of a strong labor market.
- Recent GDP growth rates have been inflated somewhat by increases in inventory investments. Some of the surveys that we analyzed this week have shown a determination of some businesses to shrink inventory levels now that delivery times have shortened due to easing of supply bottlenecks and to slower demand. We expect to see a slowing of U.S. GDP growth rates. A few surveys have shown that some companies are beginning to find it difficult to pass on higher input costs to their customers.
- Goldman Sachs (Goldman) on January 17, observed that “average hourly earnings growth slowed to 3.5% on a 1-month annualized basis and 4.1% on a 3-month annualized basis.” Goldman’s wage tracker estimates continued to slow through December but remained above the 3.5% rate of increase that many economists assume is consistent with a 2% rate of inflation. We remain hopeful that the slowing of wage increases will resume.
The Upshot: Our general investment approach remains the same as depicted in last week’s commentary. We maintain our preference for quality stocks with good balance sheets, relatively stable cash flows with stable margins. Volatility across sectors continues to be supportive of a diversified global portfolio for long term investors. We expect volatility to continue across asset classes.
As indicated in our commentaries of the past few weeks, we have been anticipating the rise in interest rates and USD. We have also advocated the trimming of equity positions. We maintain our strategy of buying equities only on downturns. We continue to stress that stock selectivity in this current financial market environment is of paramount importance. On Friday afternoon the two-to 10-year yield curve inversion increased to at least 85 bps. We interpret this as an indication that financial markets are pricing in the increased probability of a U.S. recession this year. We are hopeful that this might still be avoided. We will make a new assessment of this possibility after we have analyzed the next set of monthly economic data.
“Wind of Change”
It was one year ago today, February 24, that Russia invaded Ukraine. As we are all very well aware, the war persists with no obvious end in sight. This invasion was an extremely negative “wind of change.” We hope that a more positive change, like the ones depicted in Scorpions’ song “Wind of Change,” will occur soon. We can almost sense that “the future’s in the air, I can feel it everywhere; I’m blowing with the wind of change; Take me to the magic of the moment [when this war is over]; On a glory night; Where the children of tomorrow dream away … In the wind of change … and share their dreams.”
Shifting Focus of Financial Markets Continues
Financial markets seem to be subject to more frequent shifts of a wind of change. This year began with equity markets that were generally rising along with decreasing interest rates and a weakening U.S. dollar (USD). In last week’s commentary, we described the myriad of explanations for these moves. Included in these explanations was an increasing conviction among market participants that the U.S. economy was very resilient and that inflation had begun on a “disinflationary” trend. Many investors became sanguine that a U.S. recession could be avoided in 2023 and that the Fed would not “overtighten.” During his press conference after the Fed announced its decision on February 1, Fed chair Powell cited repeatedly this “disinflationary” trend. We were struck that in reviewing the minutes of that meeting this week, we could find no reference to a “disinflationary” trend. Many of these powerful trends in January began reversing in February as many investors began to question this positive narrative and began to replace it with a Fed that would “overtighten” into a possible slowing economy that might then cause a U.S. recession. We have referred to a possible shifting of the markets’ focus from economic growth concerns on the one hand and inflation, rising interest rates and the probability of the Fed overtightening on the other. We believe that the last two weeks have shown the “fluidity” of these views and how they can interplay sometimes in unpredictable ways.
Rapidity of Change in Economic Data
In our opinion, there are many crosscurrents affecting the real economy and financial markets. Economic data that reflected weakening retail sales and rather clear “disinflationary” trends towards the end of 2022 were suddenly replaced by much-stronger-than-expected retail sales in January with perhaps a more persistent inflationary trend at the beginning of this year. We thought that some of these crosscurrents were reflected in intraday reversals of interest rates and equities such as those displayed on Thursday. We expect volatility to continue in sometimes rather unpredictable ways. Additionally, we continue to maintain that “rapidity of change” is the hallmark of the economy and financial markets since the onset of the pandemic.
Better than Expected Flash U.S. February PMI
The week began with the release of the S&P Global Purchasing Managers’ Index (PMI) Flash preliminary figures for February. The U.S. Composite Output Index surged unexpectedly from January’s level of 46.8 – and versus an expectation of 47.5 – to cross above the 50-mark into expansionary territory with an eight-month-high reading of 50.2. The upturn in the headline number was driven mostly by the services sector that rose from January’s level of 46.8 and to 50.5, which is also an eight-month high. This increase in services output was most likely helped by unseasonably warm weather. Slower declines in manufacturing production and activity also helped achieve an expansionary outcome. Manufacturing output reached a four-month high of 48.4, which was up from a 46.9 reading in January. Manufacturing PMI also reached a four-month high of 47.8 versus a 46.9 level from the prior month. Although new orders continued to contract in February, the rate of decline was the slowest since last October. New export orders declined at the slowest rate since May 2022. Input costs rose at the second-softest pace since October 2020. This was an encouraging sign for a diminishing rate of inflation as raw material and commodity prices eased. Unfortunately, hikes in wages drove prices higher. Selling prices – output charges – rose at the fastest rate since last October as many firms could pass on higher costs to their customers. Although this was good news for margins, it was “bad” news for inflation. Reflecting the highest optimism since last May, rate of job creation accelerated to the fastest rate of increase since last September. But this rate of increase in employment levels was described as “modest.” Supplier delivery times were reduced by the greatest extent since May 2009. Weak demand and fewer logistics issues accounted for better delivery times. The chief business economist at S&P Global described February as “seeing a welcome steadying of business activity after seven months of decline.” But he also believed that factory activity remained in contraction and “focused” on inventory reduction. We expect that efforts to reduce inventories will lead to a slowdown in U.S. GDP growth rates in 2023 relative to Q4 2022. The S&P Global economist also observed that the “improved supply situation has taken the price pressures out of the manufacturing supply chain, but survey data underscore how the upward driving force on inflation has shifted now to wages amid a tight labor market.”
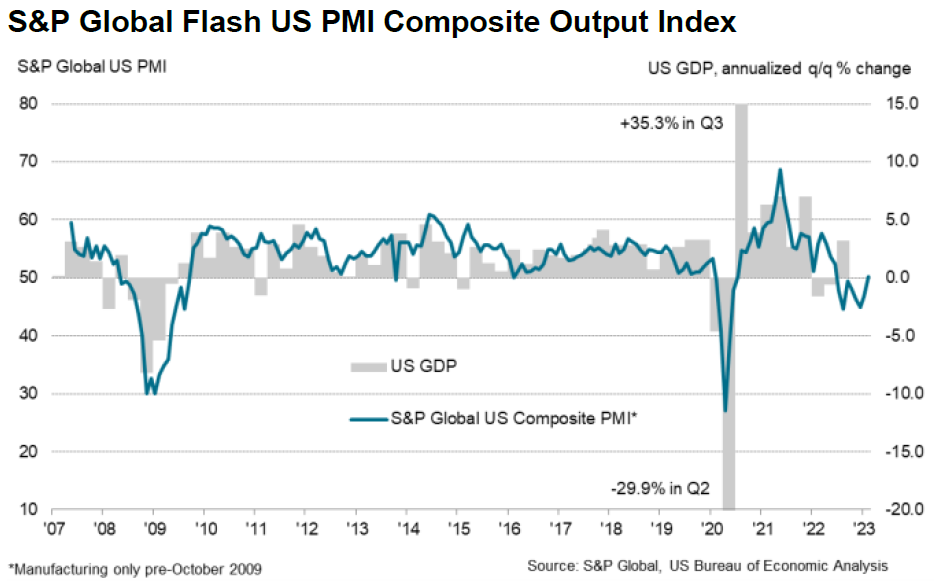
Source: S&P Global, S&P Global Flash US Composite PMI (2-21-2023)
Better-than-Expected Flash Eurozone February PMI
The Eurozone February PMIs showed more positive readings relative to the U.S. The composite output index reached a nine-month high of 52.2, up from 50.3 in January and versus an expected 50.6. Services activity reached an eight-month high of 53.0 versus a 50.8 level in January. Like in the U.S., services led the upturn. Unlike the U.S., the Eurozone manufacturing output index rebounded up from 48.9 to cross into expansionary territory with a nine-month high reading of 50.4. This was its first expansionary reading since last May. The manufacturing PMI, however, ticked down from 48.8 to a two-month low of 48.5. Average supplier delivery times shortened for the first time since January 2020 and by the greatest amount since May 2009. Similar to the U.S., “softer” input costs for manufacturing reflected a weaker demand as manufactures focused on inventory reduction. Overall new orders increased for the first time in nine months. Service firms experienced another “steep” rise in input costs and average prices charged – selling prices – continued to rise “sharply,” but at a more moderate pace than in January. The overall selling prices increased at the “softest” pace since October 2021. The rate of job growth was lower than the three-month high rate in January. Slower job growth continued to reflect labor supply shortages as well as uncertainties about the economic outlook. Optimism about the future one-year outlook rose to a one-year high due to fewer concerns in regard to deep recession probabilities and over energy supplies and prices. Signs of peaking inflation also contributed to this view. The chief business economist at S&P Global attributed the much-faster-than-expected gains in Eurozone economic activity to “resurgent service sector activity and a recovering manufacturing economy.”
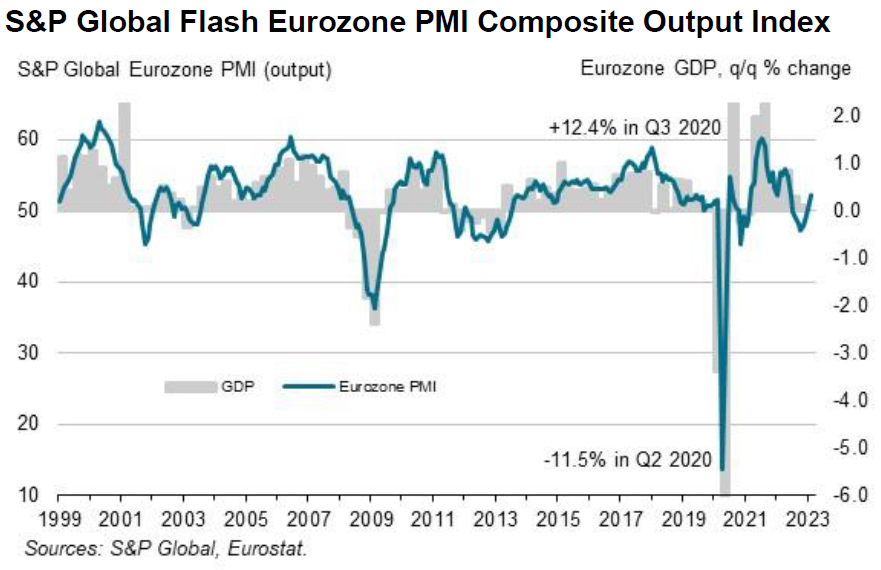
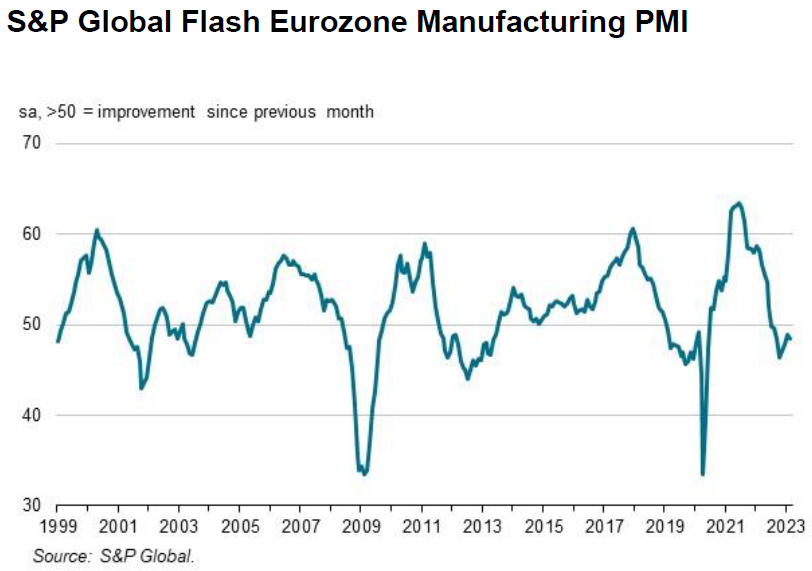
Source: S&P Global, S&P Global Flash Eurozone PMI (2-21-2023)
Minutes of the Federal Open Market Committee (FOMC) January 31 to February 1 Meeting
The FOMC staff indicated that “investor perceptions of an improved economic outlook in China and Europe contributed to increases in foreign risky asset prices and weighed on the exchange rate of the dollar.” The Flash Eurozone PMI readings described above seem to vindicate this view of Europe. We also surmise that this view has made it easier for many investors to adopt a more-sanguine view in regard to the U.S. economy. But the staff also highlighted that although overall credit quality remained “strong,” there was some deterioration for credit card and auto loan borrowers. In particular, delinquency rates on auto loans rose above pre-pandemic levels. The staff also did not expect the “boost” to GDP growth from inventory investment to persist. We agree, especially after analyzing U.S. Q4 revised estimates this week that showed a significant contribution to GDP growth from inventory investments and the determination of manufactures in both Europe and the U.S. to reduce inventories. The staff saw that the risks to economic growth in 2023 were tilted to the downside and viewed the possibility of a U.S. recession in 2023 as a plausible alternative to their baseline. Additionally, the staff also viewed inflation risks this year as “balanced,” but skewed to the upside beyond 2023. This was reflective of the possibility of “persistent” inflation. Participants – FOMC members – noted that there were “tentative signs that imbalances between demand and supply in the labor market were improving.” It was noted also that average hours worked was falling and that wage growth and employment costs were slowing. Furthermore, participants also observed that core goods prices were down ”notably” over the past few months, but that there was “less evidence of a slowdown in the rate of increase of prices for core services, ex-housing.” It was acknowledged that wages tend to lag changes in prices, and that low growth of labor productivity restrained growth of supplies. There was a high degree of uncertainty among participants associated with many components of their economic outlook.
“Almost all” participants agreed to raise the federal funds rate 25 basis points (bps). “A few” participants stated that they favored a 50-bps hike at this meeting. We now know that two of these participants – St. Louis Fed president James Bullard and Cleveland Fed’s president Loretta Mester – are nonvoting members this year. These members wanted to get to a “sufficiently” restrictive stance as soon as possible. We would not view such a posture as “data dependent,” which we understand is the Fed’s current posture. “A number of participants observed that financial conditions had eased in recent months, which some noted could necessitate a tighter monetary stance.” As we have highlighted in our prior commentaries, Powell did not seem as troubled by the easing of financial conditions.
In his February 1 press conference, Powell indicated that the minutes would reveal a discussion about which factors would be required for the Fed to “pause” its rate hikes. There was no discussion on this topic. However, we though that two statements in the minutes addressed this issue. “Participants observed that a restrictive policy stance would need to be maintained until incoming data provided confidence that inflation was on a sustained downward path to 2%.” The other key statement was that participants generally noted “upside risks to the inflation outlook remained a key factor shaping the policy outlook, and that maintaining a restrictive policy stance until inflation is clearly on a path toward 2% is appropriate from a risk management perspective.” The remaining key question is: What level of the federal funds rate is sufficiently restrictive from a “risk management perspective”? We suspect that this determination will depend on the incoming economic data.
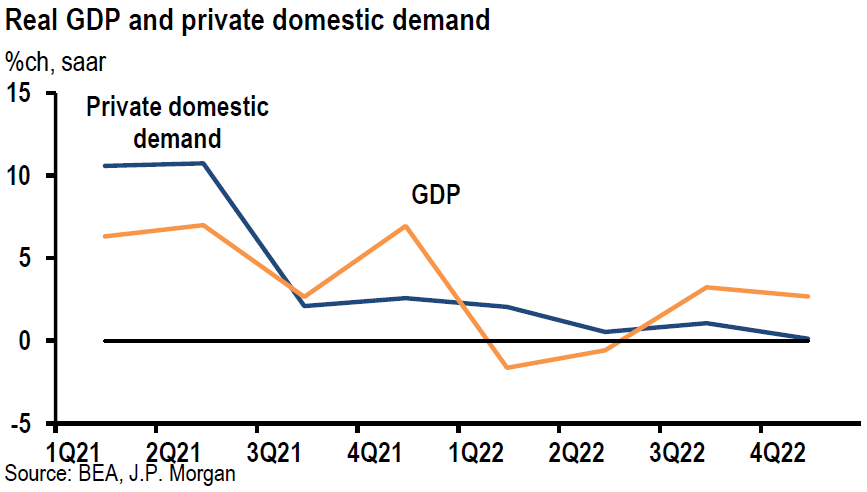
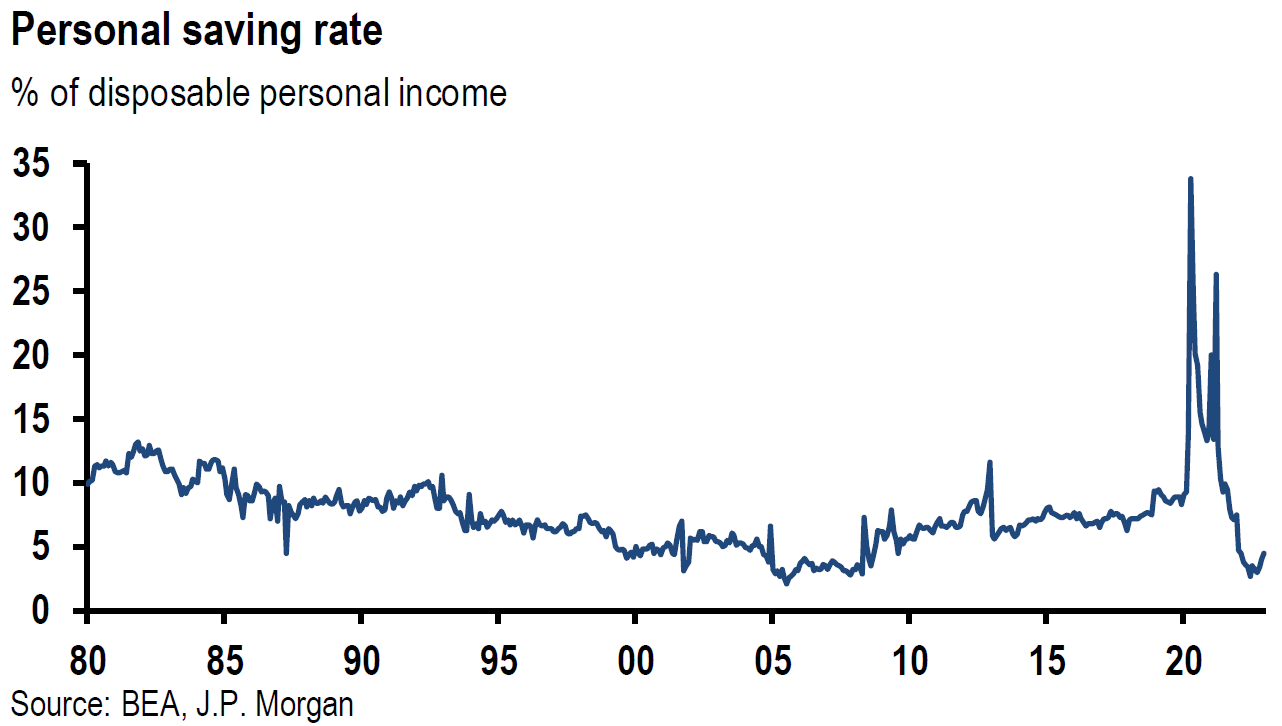
Real Q4 U.S. GDP Second Estimate Revised Lower
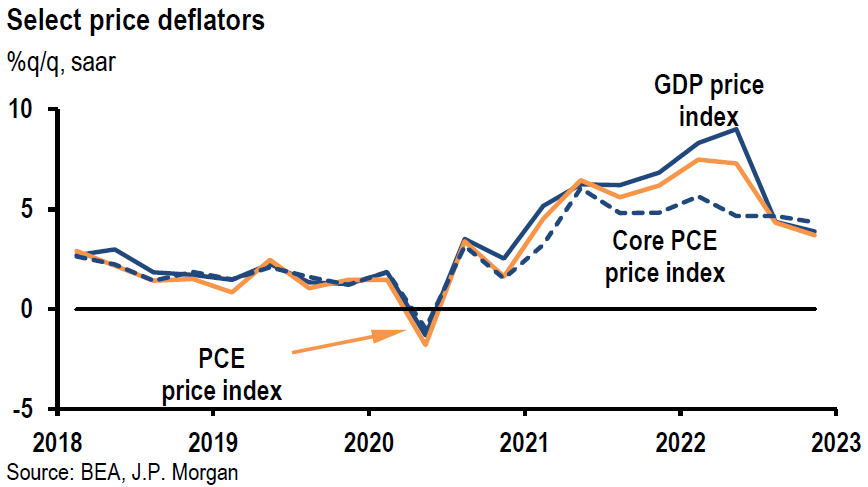
Real Q4 GDP was revised lower to 2.7%, seasonally adjusted and annualized (SAAR), from 2.9%. Personal consumption was revised lower by 0.7% to 1.4% and was the primary driver of the downward revision. Exports were also revised lower. Nominal income was revised higher to 7.3% SAAR from 5.8%. The combination of lowered consumption growth and stronger income meant that the savings rate was revised higher to 3.9% from 2.9%. One of the largest revisions higher was for nonresidential structures investment with its real growth revised to 8.5% SAAR from a 0.4% gain. Inflation as reflected by personal consumption expenditures (PCE), the Fed’s preferred measure of inflation, was revised higher. Headline Q4 PCE was revised to 3.7% SAAR from 3.2% and core PCE was 4.3% higher versus the “advance” estimate of 3.9%, when compared to Q3. When compared to Q4 of 2021, headline PCE was revised to an increase of 5.7% from 5.5% and core PCE rose by 4.8% from the advance estimate of 4.7%.
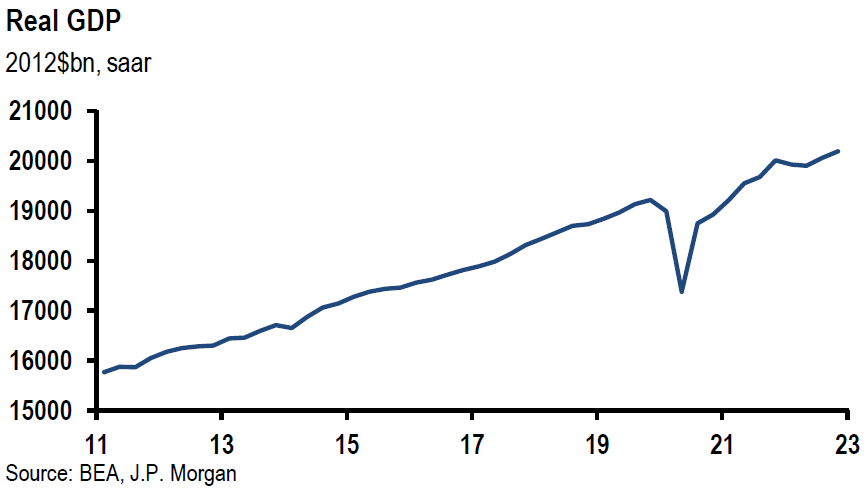
Source: JP Morgan, US: Real GDP revised down in 4Q, PCE inflation revised up (2-23-2023)
Weaker U.S. Housing
Existing home sales were lower for the twelfth consecutive month by a more than expected 0.7% month-over-month decline and lower by 36.9% on a year-over-year (y/y) basis. This was the longest string of monthly declines since 1999 and the level of sales in January were the weakest since 2010. The slowing sales trend began in February 2022. According to Freddie Mac, average rates for 30-year fixed rate mortgages ranged from 3.22% to 3.55% in January 2022 versus a range of 6.13% to 6.48% this January. The chief economist at the National Association of Realtors (NAR) thought that “home sales are bottoming out.” Inventory of unsold homes increased 2.1% from December’s level and were higher by 15.3% y/y. At the current pace of sales, inventories would be depleted after 2.9 months – same as in December but was up from a 1.6-month pace in January 2022. Existing home sales prices increased 1.3% y/y on average. Properties typically remained on the market for 33 days, up from 26 days in December. All cash buyers accounted for 29% of all transactions in January versus 28% in December and 27% in January 2022. Second home buyers make up many all-cash sales. First time buyers accounted for 31% of January and December sales, up from 27% in January 2022.
The latest survey by the Mortgage Bankers’ Association (MBA) released on Wednesday, showed that mortgage applications fell for the third week out of the last four when compared to the prior week’s level. Total mortgage applications last week fell 13.3% from the prior week (w/w). The prior week saw a -7.7% w/w decrease in total applications. Mortgage applications to purchase a home fell 18.1% w/w last week and the prior week saw a drop off of 5.5% w/w.
Sales of new single-family homes in January rose 7.2% m/m to a seasonally adjusted rate of 670k units versus an expected increase of 0.7% m/m, but were lower by 19.4% y/y. New home sales data is generally not considered a very reliable gauge of the U.S. housing market. December sales were revised up to 625k from 616k. However, net revisions were negative across recent months.
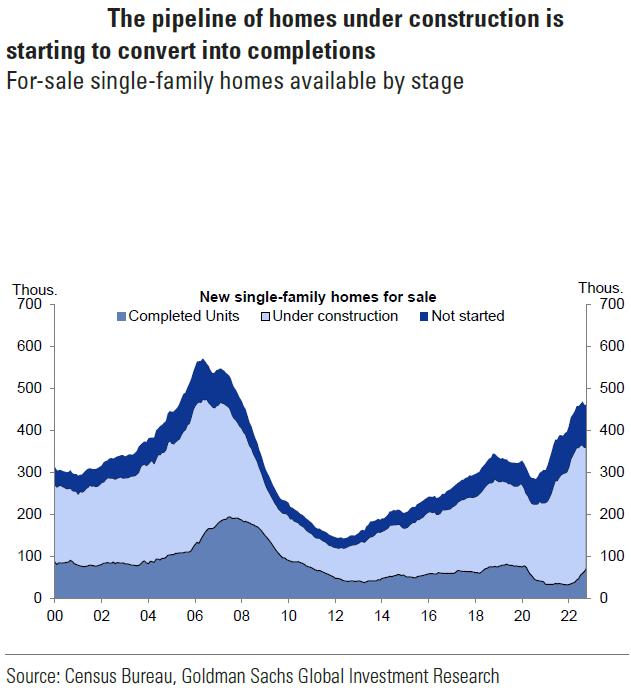
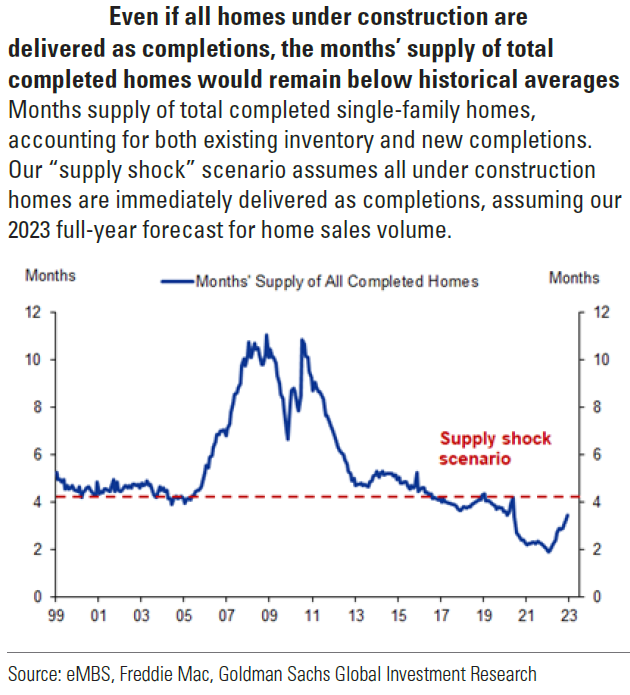
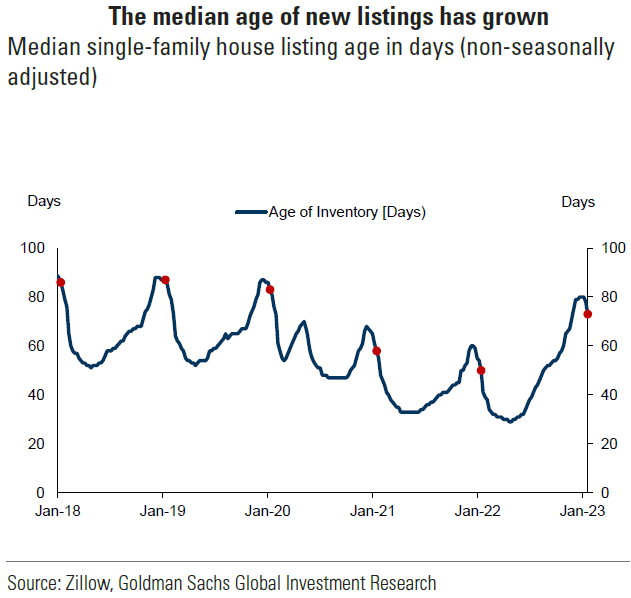
Source: Goldman Sachs, Taking stock of housing supply (Viswanathan) (2-23-2023)
U.S. January Personal Income, Spending and PCE Inflation Measures
The PCE headline price index increased 0.6% m/m, the most since last June, and following a 0.2% increase in December. The increase on a y/y basis rose 5.4% from a 5.3% y/y increase in December. Core PCE (ex food and energy) also was 0.6% higher m/m and was 4.7% higher y/y versus December’s y/y gain of 4.6%. According to Blomberg calculations, services excluding housing and energy services, was also 0.6% higher. Consumer spending, which accounts for more than two-thirds of U.S. economic activity, increased 1.8% m/m versus an expected 1.3% increase. This was the biggest monthly increase since March of 2021. The spending increase was widespread for goods spending but was led by motor vehicles and parts. The largest contributor to the service spending increase came from spending on food services. December’s comparable figure was revised higher to a negative -0.1% m/m from an initial estimate of down -0.2%. According to Reuters on February 24, “spending was likely driven by an 8.7% cost of living adjustment, the biggest increase since 1981, for more than 65 million Social Security beneficiaries, which boosted income. It was also probably flattered by difficulties ironing out seasonal fluctuations from the data at the start of the year.” Personal income rose by 0.6% m/m following an upwardly revised 0.3% monthly gain in December and was lower than the expected 1.0% gain. The gains in social security benefits were offset somewhat due to the expiration of the extended child tax credit as well as a decline in one-time refundable tax credits issued by states. According to Bloomberg on February 24, “wages and salaries, unadjusted for prices, increased 0.9%, more than double the prior month’s gain and the most since July.” The savings rate increased to 4.7% in January, up from an upwardly revised (by 1.1%) 4.5% in December, and was at the highest level in one year. In general, the PCE price increases and the spending increases, all exceeded expectations. These were all very strong numbers. We need to see at least one more month’s economic data before we will be able to determine whether the recent “disinflationary” trends have been “broken.” We never expected a smooth downward trajectory of inflation data but agreed with Powell that it would be a “bumpy” ride.
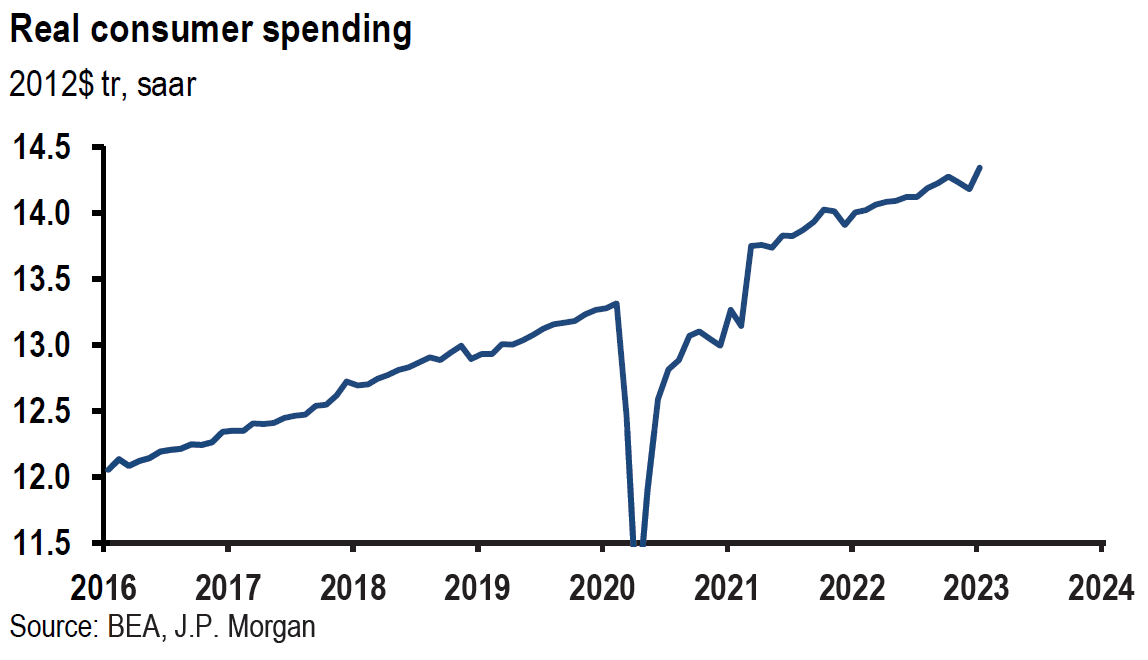
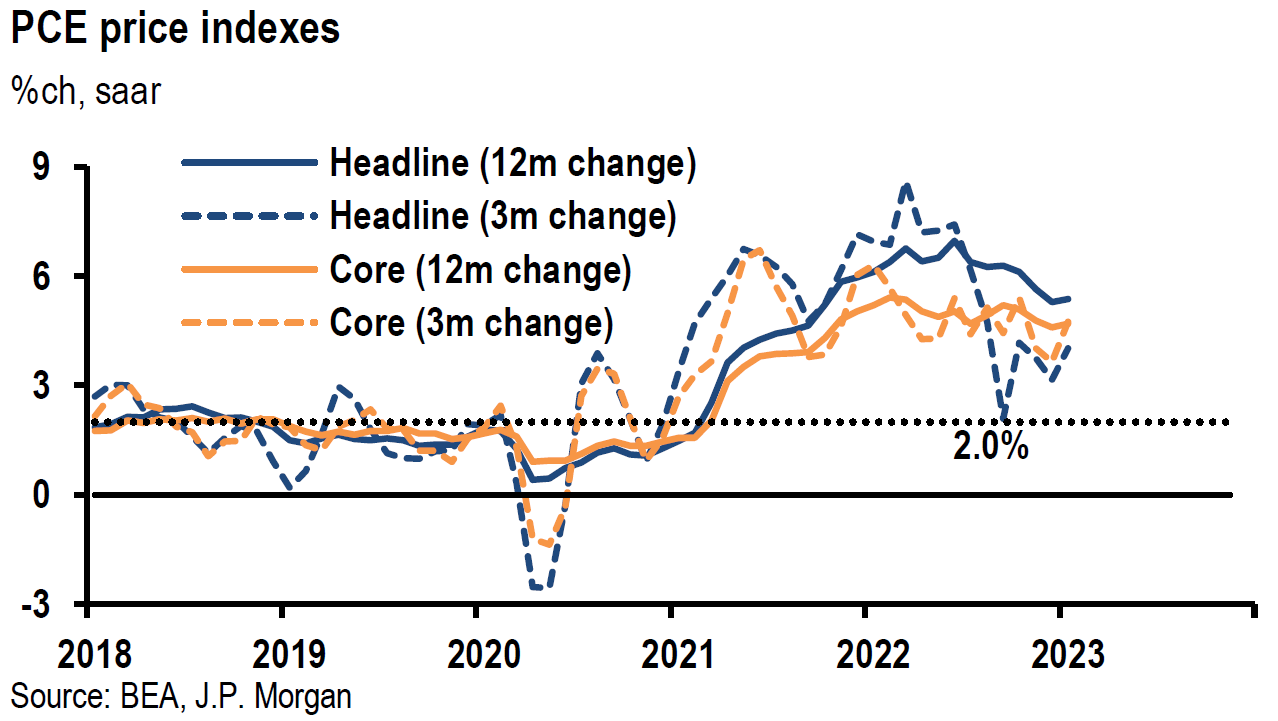
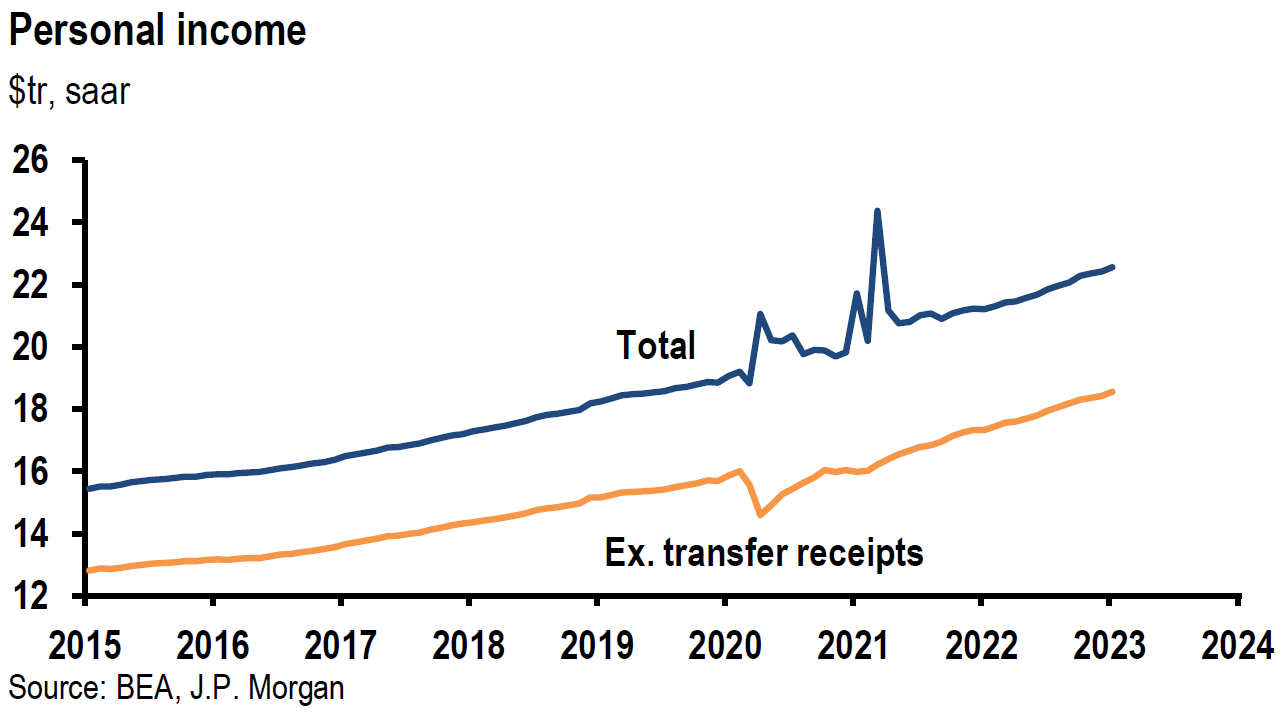
Source: JP Morgan, US: Consumer spending jumps in January (2-24-2023)
University of Michigan Consumer Sentiment – Final Results for February
Consumer sentiment was revised higher to 67 (highest since January 2022) for February from a preliminary reading of 66.4. Relative to the preliminary data, current economic conditions decreased 1.9 points to 70.7, while expectations increased by 2.4 points to 64.7. Inflation expectations for the year ahead were revised lower to 4.1% from 4.2%. The five-year inflation outlook remained at 2.9%.
Bottom Line
For the time being we are maintaining our basis investment approach as expressed in last week’s commentary. We continue to prefer high quality stocks that offer good balance sheets, as well as relatively stable cash flows and profit margins. We prefer a very diversified global portfolio for long term investors. We expect volatility to continue across asset classes.
We continue to stress that stock selectivity in this current financial environment is of paramount importance. We will reassess our investment posture after we have analyzed the next set of monthly economic data. We maintain our strategy of buying equities only on downturns. We will continue to scrutinize investments on a risk-reward basis.
Definitions:
Federal Funds Rate – The term federal funds rate refers to the target interest rate set by the Federal Open Market Committee. This target is the rate at which commercial banks borrow and lend their excess reserves to each other overnight.
Federal Open Market Committee (FOMC) – The Federal Open Market Committee (FOMC) is the branch of the Federal Reserve System that determines the direction of monetary policy specifically by directing open market operations. The committee is made up of 12 members: the seven members of the Board of Governors; the president of the Federal Reserve Bank of New York; and four of the remaining 11 Reserve Bank presidents on a rotating basis.
Fed Minutes – The Minutes are a detailed record of the Federal Open Market Committee (FOMC) meetings and are released three weeks after every meeting. The minutes offer more concise insights on the monetary policy stances of all members of the committee and how individual members see the value of the USD and other securities.
Inverted Yield Curve – An inverted yield curve describes the unusual drop of yields on longer-term debt below yields on short-term debt of the same credit quality. Sometimes referred to as a negative yield curve, the inverted curve has proven in the past to be a relatively reliable lead indicator of a recession.
Composite Purchasing Managers’ Index PMI – A composite Purchasing Managers’ Index (PMI) is the weighted average of manufacturing and service sector PMIs for a given geography or economy.
Manufacturing Purchasing Managers’ Index PMI – A manufacturing Purchasing Managers’ Index (PMI) is a survey-based economic indicator designed to provide a timely insight into changing business conditions in the goods-producing sector.
Services Purchasing Managers’ Index PMI – A services Purchasing Managers’ Index (PMI) is a survey designed to better understand changing business conditions in the wider economy. Coverage includes financial services, consumer services and all other business services.
Basis Points (bps) – A basis point is one hundredth of one percent, used chiefly in expressing differences of interest rates.
Real GDP – Real gross domestic product (GDP) is an inflation-adjusted measure that reflects the value of all goods and services produced by an economy in a given year. Real GDP is expressed in base-year prices. It is often referred to as constant-price GDP, inflation-corrected GDP, or constant dollar GDP. Put simply, real GDP measures the total economic output of a country and is adjusted for changes in price.
Flash Composite PMI – The flash Composite Purchasing Managers’ Index (PMI) provides an early estimate of current private sector business activity by combining information obtained from surveys of the manufacturing and service sectors of the economy.
Flash Services PMI – Flash services PMI is an early estimate of the Services Purchasing Managers’ Index (PMI) for a country, designed to provide an accurate advance indication of the final services PMI data.
Flash Manufacturing PMI – Flash Manufacturing PMI is an estimate of manufacturing for a country, based on about 85% to 90% of total Purchasing Managers’ Index (PMI) survey responses each month.
Headline PCE Inflation – A measure of the prices that people living in the United States, or those buying on their behalf, pay for goods and services. The PCE price index is known for capturing inflation (or deflation) across a wide range of consumer expenses and reflecting changes in consumer behavior.
Core PCE Inflation – A measure of the prices that people living in the United States, or those buying on their behalf, pay for goods and services that excludes food and energy prices. The core PCE gives a more accurate reading of inflation because food and energy are very volatile parts of the economy.
Existing home sales – Existing home sales transaction data measure and report sales and prices of existing single-family homes, condos, and co-ops for the United States, and is broken down by region: West, Midwest, South, and Northeast.
IMPORTANT DISCLOSURES
The views and opinions included in these materials belong to their author and do not necessarily reflect the views and opinions of NewEdge Capital Group, LLC.
This information is general in nature and has been prepared solely for informational and educational purposes and does not constitute an offer or a recommendation to buy or sell any particular security or to adopt any specific investment strategy.
NewEdge and its affiliates do not render advice on legal, tax and/or tax accounting matters. You should consult your personal tax and/or legal advisor to learn about any potential tax or other implications that may result from acting on a particular recommendation.
The trademarks and service marks contained herein are the property of their respective owners. Unless otherwise specifically indicated, all information with respect to any third party not affiliated with NewEdge has been provided by, and is the sole responsibility of, such third party and has not been independently verified by NewEdge, its affiliates or any other independent third party. No representation is given with respect to its accuracy or completeness, and such information and opinions may change without notice.
Investing involves risk, including possible loss of principal. Past performance is no guarantee of future results.
Any forward-looking statements or forecasts are based on assumptions and actual results are expected to vary from any such statements or forecasts. No assurance can be given that investment objectives or target returns will be achieved. Future returns may be higher or lower than the estimates presented herein.
An investment cannot be made directly in an index. Indices are unmanaged and have no fees or expenses. You can obtain information about many indices online at a variety of sources including: https://www.sec.gov/fast-answers/answersindiceshtm.html or http://www.nasdaq.com/reference/index-descriptions.aspx.
All data is subject to change without notice.
© 2024 NewEdge Capital Group, LLC


