


Well, I know what’s right, I got just one life
In a world that keeps on pushin’ me around
But I’ll stand my ground, And I won’t back down
“I Won’t Back Down” – Tom Petty
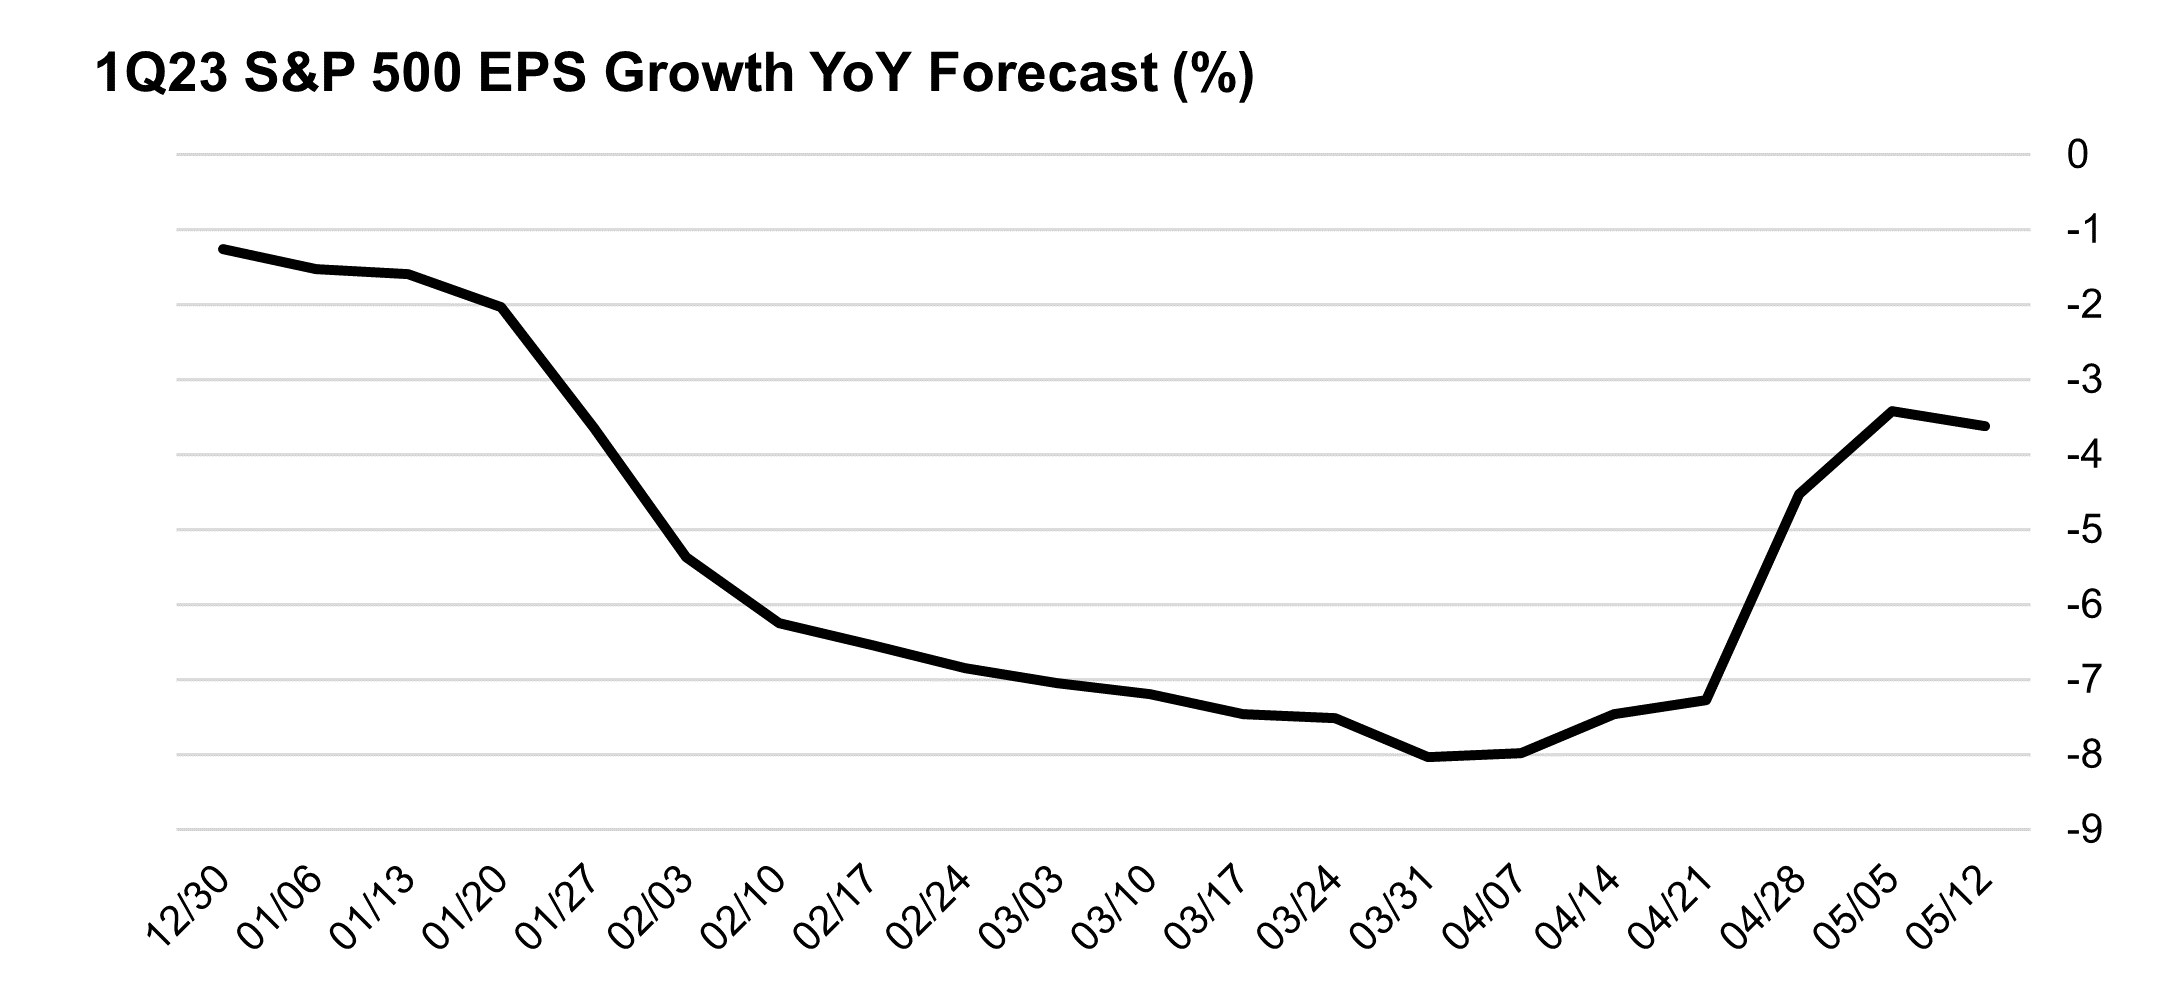
The results of the first quarter earnings season could be appropriately summarized by Tom Petty’s 1989 song “I Won’t Back Down” alluding to resilience in the face of adversity. Entering the first quarter earnings season, expectations had declined substantially on the back of waning consumer sentiment, economic activity, and margin pressures to start the year. At the start of 1Q23 earnings season, consensus estimates for year-over-year declines in corporate earnings averaged -8%, which would have represented the weakest quarter in terms of profitability since the height of the pandemic in 2020.
With 93% of the S&P500 having reported thus far, corporate earnings have proved to be resilient, with corporations broadly exceeding profit expectations through price increases and disciplined expense management. As of writing, first quarter earnings are on pace to decline just -3.6% year-over-year, with both the magnitude of earnings beats (+6.5%) and the percentage of companies beating estimates (78%) slightly above historical average levels. Over the past 10 years, the percentage of companies beating estimates has averaged 73% and the average earnings beat has been 6.4%.
Source: Bloomberg, NewEdge Wealth, as of 5/18/23
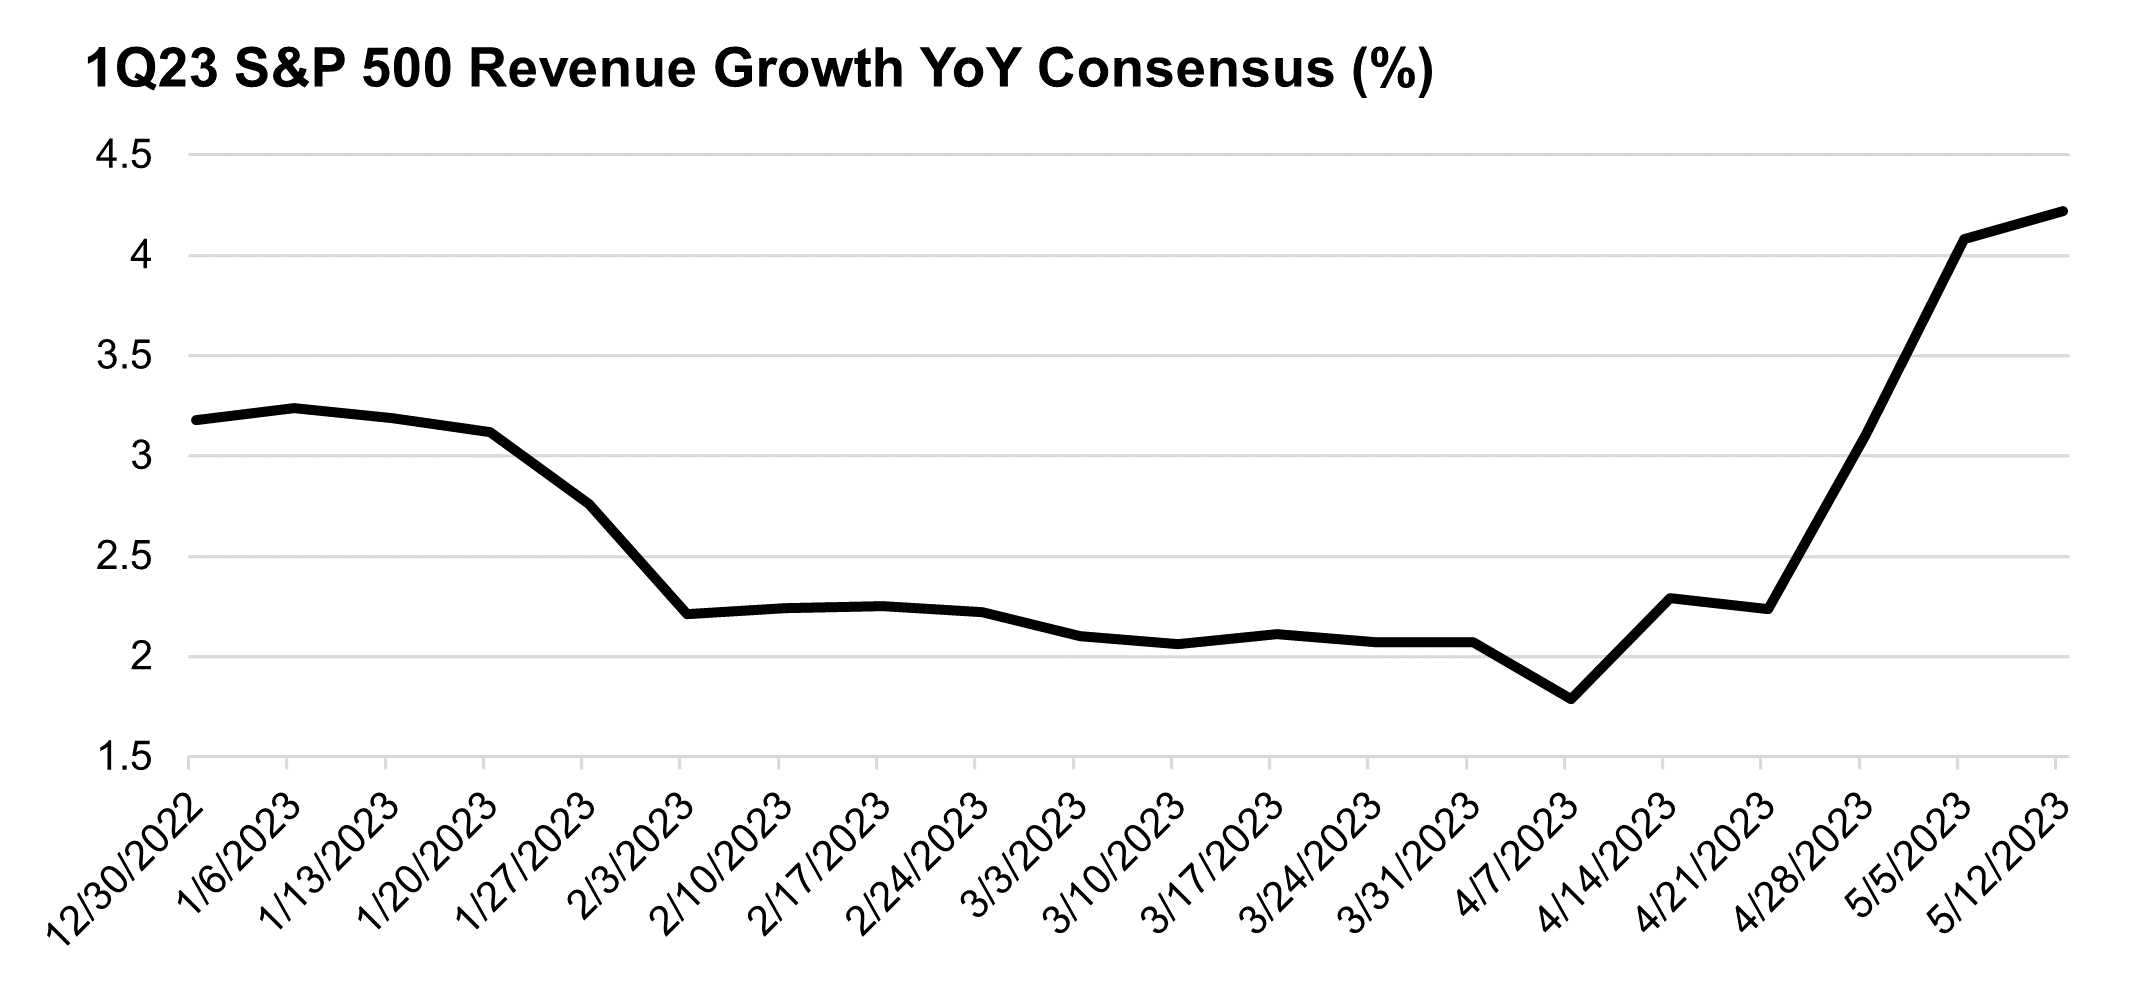
Top line growth has also exceeded expectations, with revenues rising 4.9% year over year, more than double what was expected at the end of March. Similar to earnings, both the number of companies beating estimates (75%) and the magnitude of beats are slightly above historical average levels.
Source: Bloomberg, NewEdge Wealth, 5/18/23
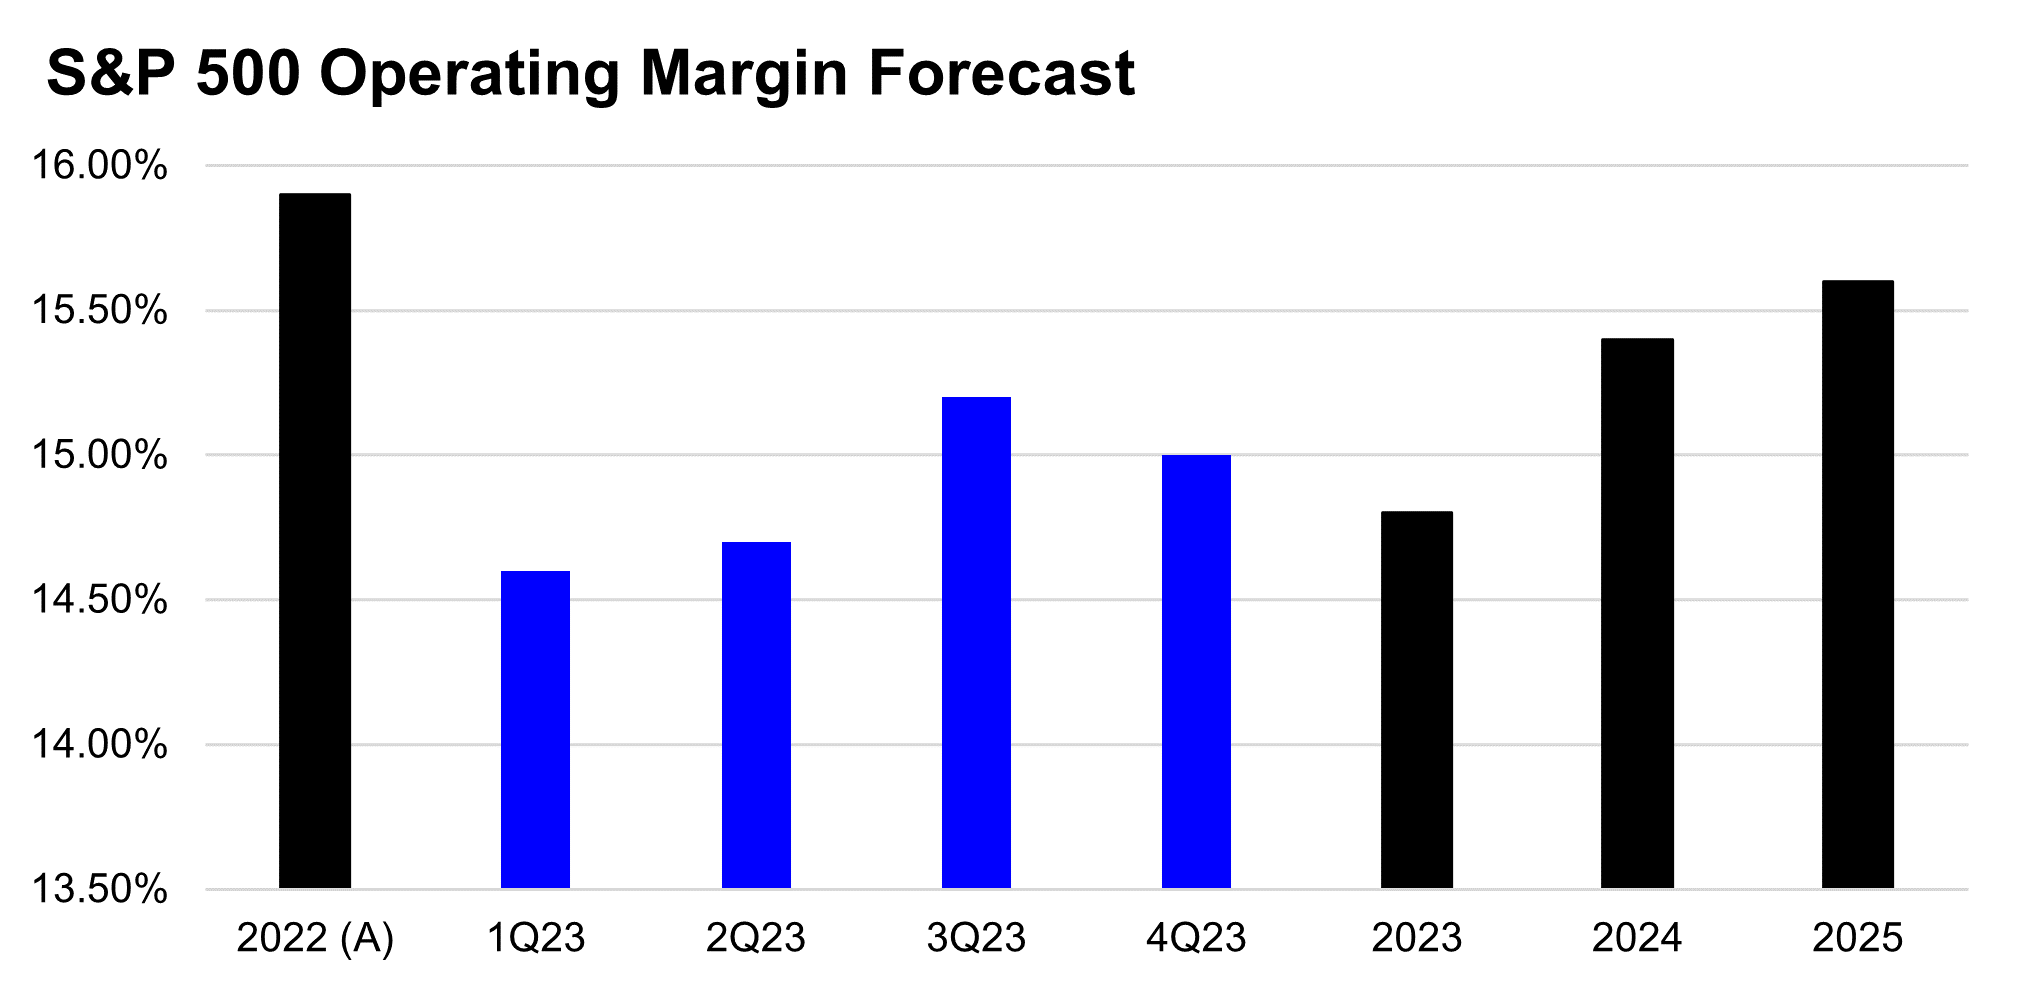
Margins also came in above expectations, as aggregate S&P500 companies have posted operating margins of 14.6% for the quarter, despite continued pressures from rising input and labor costs and softening demand. Overall operating margins declined by 20bps in the first quarter after declining by 90bps in the fourth quarter of 2022, likely a result of management teams prioritizing efficiency across capital allocation, expenses, and generally preparing for a recessionary environment that has thus far been slow to materialize. Continued strong pricing power helped to buoy margins as well, enabling companies to pass through rising costs to customers.
Source: Bloomberg, NewEdge Wealth, 5/18/23
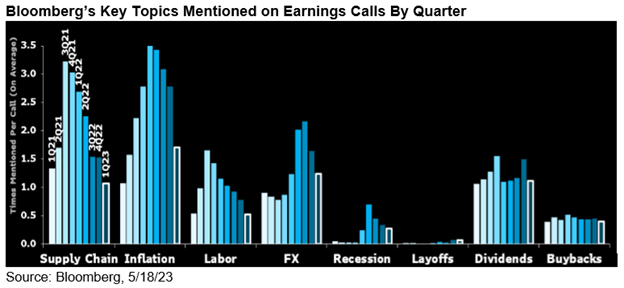
The resiliency of profit margins and a less concerning economic environment is evident in management commentary as well. Bloomberg’s measure of earnings call sentiment (in response to analyst questions) increased to the highest level since the fourth quarter of 2021, led by improved sentiment towards labor, inflation, and foreign exchange rates. At the same time the number of times management teams mentioned headwinds like inflation, labor, FX, and recession declined to multi-quarter lows.
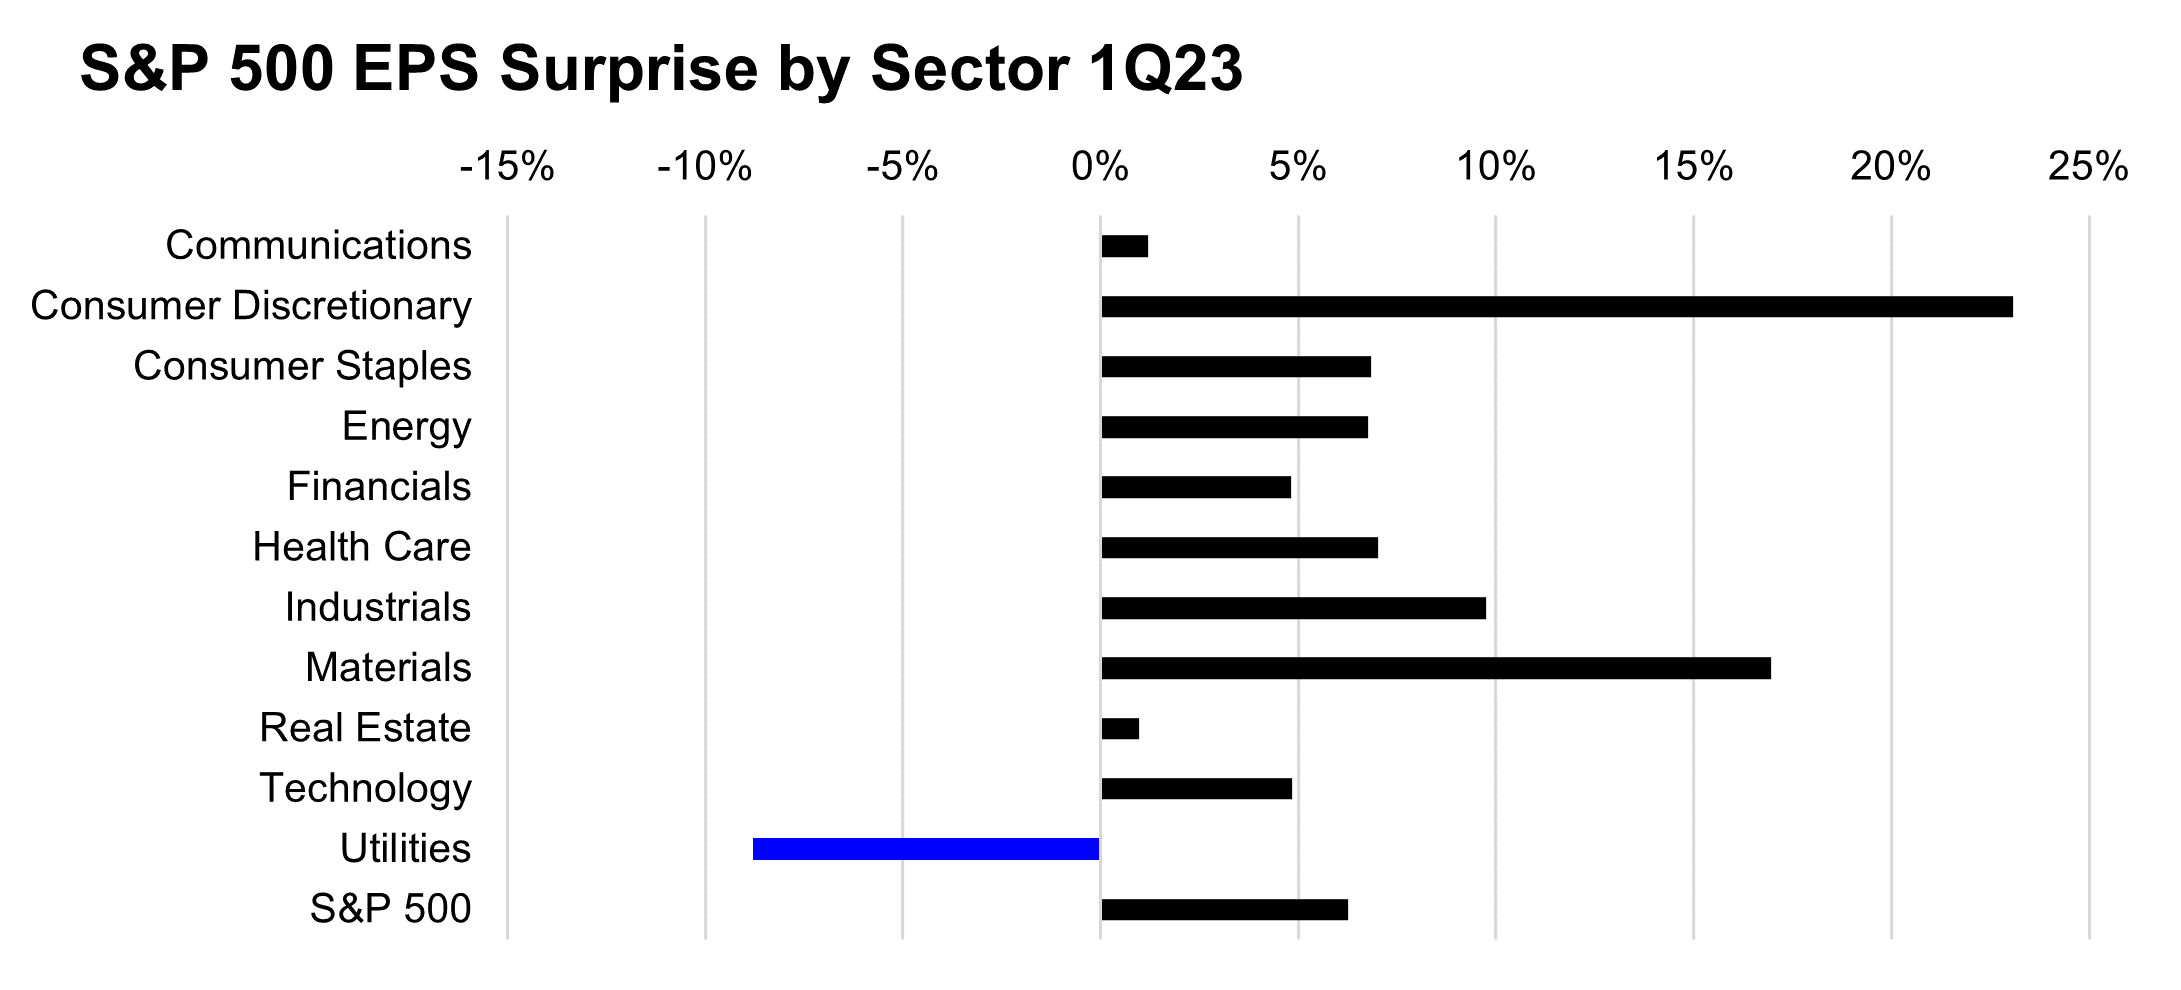
At the sector level, the Technology, Consumer Discretionary, and Healthcare sectors were the largest contributors to earnings beats in the first quarter. The Consumer Discretionary sector (heavily influenced by Amazon at 25% of the sector), posted the most substantial surprise, beating estimates by over 23%, while the Healthcare sector beat estimates by 6.6%, and the Technology sector beat estimates by 5.2%. Combined, these sectors account for 50% of the S&P500 market capitalization, although they were not alone in their beats, with 10 of the 11 S&P500 sectors exceeding analyst estimates. The Utilities sector was the lone underperformer for the quarter.
Source: Bloomberg, NewEdge Wealth, 5/18/23
As we noted prior to the first quarter earnings season, elevated valuations, fading profits, and economic headwinds were likely to place corporate earnings under heightened scrutiny, and this was evident in the price reaction in the four days surrounding earnings announcements. Companies that missed expectations declined by an average of -4.1% over this period, nearly double the 5-year average decline of -2.2% on earnings misses. Surprisingly, companies that exceeded expectations were not as generously rewarded, rising 0.3% on average, vs the 5-year average increase of 1.0% on earnings beats. This likely reflects continued skepticism on the part of investors towards the durability of forward earnings results.
While the general takeaway from first quarter earnings is one of surprising resilience, investor focus will now turn towards the second quarter and back half of 2023, and early estimates suggest we are not out of the woods yet. For the second quarter, consensus estimates call for a -6.9% decline in earnings per share, which if it holds would be the third consecutive quarterly decline in EPS growth for the S&P500. The largest detractors to EPS growth in the second quarter are expected to come from the energy, materials, and healthcare sectors, all of which are expected to post substantial year-over-year declines in EPS primarily due to margin compression. Fortunately, the second quarter may prove to be the trough in this earnings cycle as EPS growth is expected to decline by -0.2% in the third quarter, before rising 6.8% in the fourth quarter.
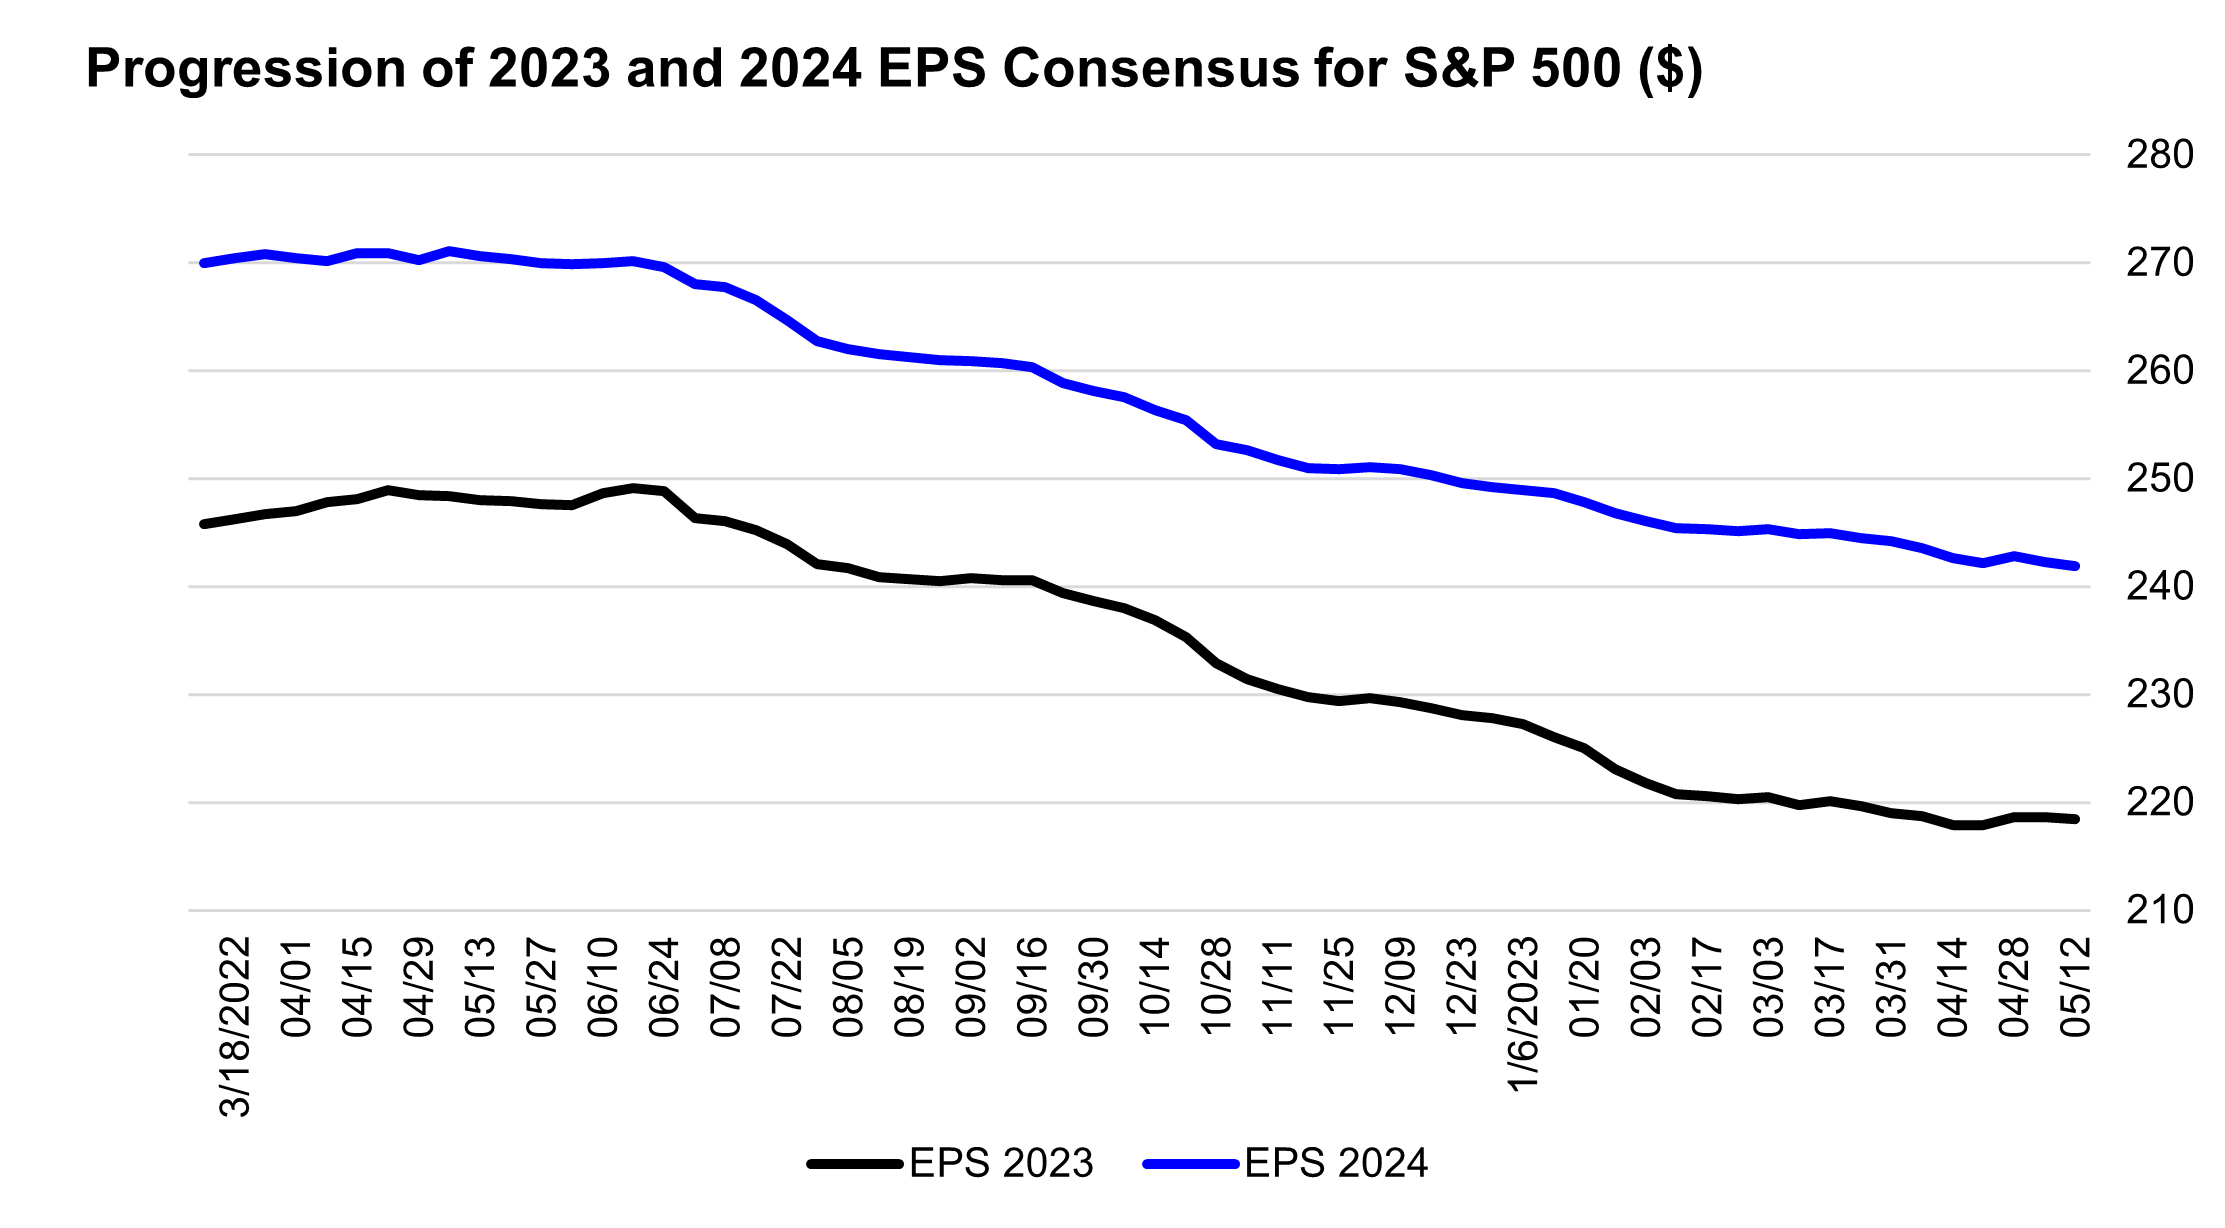
For calendar year 2023, consensus estimates are currently at $221 per share in earnings on the S&P500, which would represent a year-over-year decline of -0.9%, although achieving this would require a substantial recovery in both margins and EPS growth in the fourth quarter. As usual analyst expectations may be too optimistic on this front and may ultimately be revised lower, mostly if a weaker period of economic growth is experienced. Upside to this estimate would be driven by continued strength in economic growth, while persistently elevated inflation could be good for earnings by boosting pricing power and revenue growth.
We see a similar story for 2024 where current expectations call for $245 in earnings per share on the S&P500, representing 10.9% year-over-year growth and reflecting expanding operating margins in every sector (ex-Utilities). Margins are forecasted to return to pandemic-era levels, which revenues were growing double digits thanks to elevated inflation. We think this margin expansion, ex some kind of productivity boom, is the key watch item for downside surprise in 2024.
Source: Bloomberg, NewEdge Wealth, as of 5/18/23
Overall, U.S. corporate profits sang along to Gainesville’s Greatest this quarter, not backing down from the headwinds of economic uncertainty and delivering resilient results. Looking forward, we expect some of the recent earnings headwinds to persist (falling inflation slowing revenues and pressuring margins, economic uncertainty, and the risk of recession, and more), while we are encouraged by the ability of U.S. corporations to navigate a tough operating environment. Just as there are few signs of an imminent recession in U.S. economic data, there are few signs of imminent recession in corporate earnings, both current and forecasted. If recession signals begin to materialize, downside adjustments to earnings forecasts will be needed, while a lack of recession would enable companies to meet currently forecasted earnings targets.
Top Points of the Week
By Ben Lope and Cameron Dawson
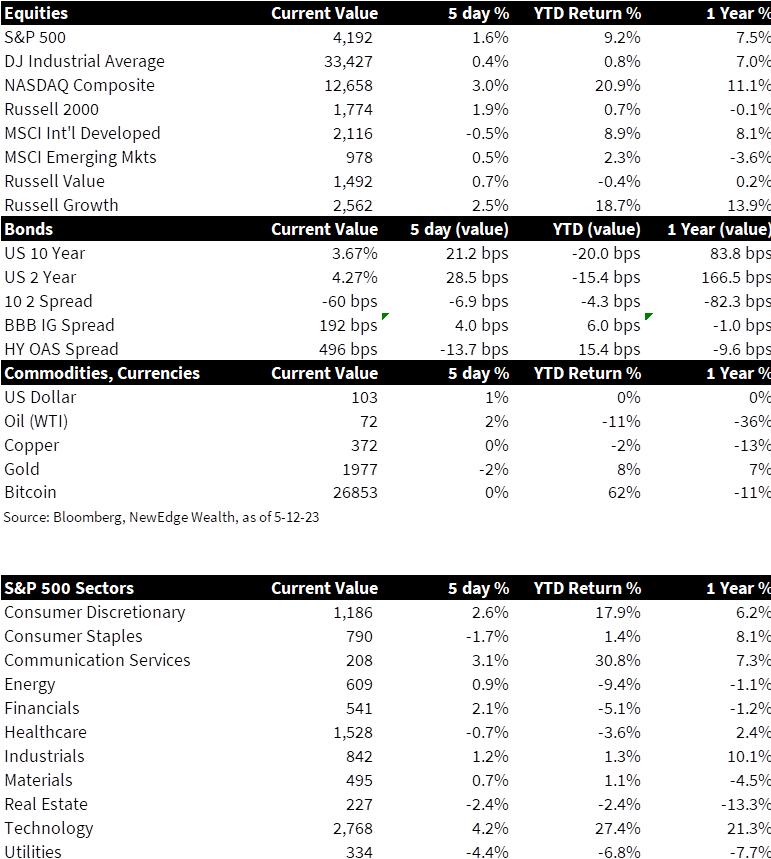
Source: Bloomberg, NewEdge Wealth, as of 5/19/23
- Equities Rally: U.S. equities rallied in the second half of the week, led by Growth (Russell 1000), Technology Sector (S&P 500), and the NASDAQ Composite. The rally picked up steam when a debt ceiling resolution seemed to be in sight but faltered on Friday when progress stalled. Optimism around Artificial Intelligence also spurred large weighted tech names higher on the week (NVDA +10%, MSFT +3%, GOOG +4%). The biggest action was overseas, with a sharp move higher in Japanese equities, which brought the TOPIX index near a 30-year high. The German DAX also neared an all-time high for the week. Chinese stocks were the notable laggards (CSI Shenzen 300 and Golden Dragon both down for the week).
- Yields Rise on the Week: Thanks to stronger economic data, optimism about a debt ceiling resolution, and hawkish Fed speak, U.S. Treasury yields moved higher over the course of the week. The rise in yields was halted somewhat on Friday when debt ceiling talks stalled, and Powell didn’t directly endorse the case for a June rate hike. The 10Y-2Y spread fell slightly on the week, but much like the U.S. equity market has been fairly range bound in the aftermath of the regional banking struggles.
- Oil/USD/Gold: Gold failed again to break into a new all-time high, ending the week lower as the rise in yields and the USD made gold relatively less attractive. Oil rose slightly over the week but continued to be whipsawed by concerns about weak global demand, particularly out of China. The USD rose on the week thanks to stronger U.S. data. The Chinese Yuan/Renminbi was a particularly soft pair versus the USD, driven by concerns about lackluster growth in China.
- Retail Sales Show U.S. Consumer Resilience: Headline retail sales were below expectations (+0.4% MoM vs. +0.8% consensus), however under the surface trends were stronger (though prior months were revised lower). Retail sales ex auto and gas were much better than expected (+0.6% vs. +0.2% consensus). Sales were softer in big ticket items like furniture and electronics, while sales were stronger in online retailing, personal care, and bars/restaurants.
- Housing Data Recovers: Housing data came in better than expected, with Housing Starts +2.2% MoM vs. -1.4% consensus. Homebuilder sentiment also improved, with the NAHB Housing Market Index recovering to 50 vs. 45 the prior month (a reading above 50 indicates more builders view conditions as good than poor). This better data coincides with strong stock price performance from homebuilders who have been benefitting from home buyers turning to new homes, as existing home sales (-3.4% MoM) and listings remain subdued with many homeowners having locked in fixed long-term mortgages when rates were much lower.
- Labor Data Resilient (Again): Initial Jobless Claims came in below expectations and lower than the prior week (242k vs. 251k consensus and 264k prior). Continuing Claims were also lower than expectations and prior (1.799m vs. 1.82m cons and 1.81m prior). The uptick last week was attributed to suspected fraud in Massachusetts unemployment filings.
- Q12023 Earnings Update: More than 95% of S&P 500 constituents have now reported first quarter earnings and the results have been better than expected. Overall earnings are on pace to decline 2.2% on the quarter, which would mark the second straight quarter of declining earnings but is well above March 31st consensus estimates for a 6.7% decline in broad earnings. First quarter revenue growth of 4.9% is also exceeding expectations, with 78% of S&P 500 companies reporting estimates that exceeded consensus expectations by an average of 2.5%. Encouragingly, consensus expectations still call for positive full year earnings growth of 1.0%, with a projected 6.4% decline in Q2 earnings to be offset by growth of 0.7% and 8.1% in Q3 and Q4, respectively.
- Debt Ceiling Negotiations Stall Again: Despite encouraging news on negotiations between Speaker McCarthy and President Biden earlier this week that brought Treasury yields lower and induced a relatively risk-on tone in markets, debt ceiling negotiations hit another snag on Friday. Lead negotiators for House Republicans characterized Friday’s talks as “not productive” and lacking in “movement,” while representatives from the White House offered similar sentiments, citing “real differences” in the proposed resolutions of each side. This week’s lack of progress inches us closer to Treasury Secretary Yellen’s estimation of a June 1st “x-date,” upon which the Treasury may exhaust their ability to continue funding the government through extraordinary measures, raising the risk of a government shutdown and even a default (though this remains a low probability). Prominent members of the Democratic and Republican parties have acknowledged the disastrous consequences of a default and the need for a resolution, but the lack of progress ahead of this looming date has yet again reversed an intraday rally in risk assets.
- Fed’s June Pause Called into Question: On Thursday, Dallas Fed President Lorie Logan stated that “the data in coming weeks could yet show that it is appropriate to skip a meeting. As of today, though, we aren’t there yet.” Stronger than expected economic data may put the bond market offsides yet again, as the probability of a 25bps hike during the FOMC’s June meeting has risen from near zero following the May meeting to over 30% this week, as measured by Fed funds futures. Regardless of whether the Fed decides to hike rates or pause, they are going to update their full year 2023 economic forecasts during the June meeting, which could put further pressure on the bond market to adjust their estimates for future cuts in the face of surprisingly resilient economic data.
- Economic Data Next Week: Next week all eyes will be on inflation data, with the Fed’s preferred gauge being updated for April. The Headline Personal Consumption Expenditures Deflation (PCE) is expected to accelerate to +0.3% MoM vs. March’s +0.1%. Headline YoY is expected at +4.3% and Core (ex: food and energy) is expected at +4.6%. 1Q23 GDP gets another revision, along with a revision to University of Michigan Consumer Sentiment data, which includes inflation expectations.
IMPORTANT DISCLOSURES
Source: Bloomberg and FactSet
Abbreviations: Continuing Claims: tracks the number of U.S. residents filing for ongoing unemployment benefits in a given week; EPS: Earnings per Share; Fed Fund futures: derivatives that measure expectations of Fed policy; FOMC: Federal Open Market Committee; Housing starts: an economic indicator that reflects the number of privately owned new houses (technically housing units) on which construction has been started in a given period; Initial Jobless Claims: measures the number of individuals who filed for unemployment insurance for the first time during the past week; Logan: Lorie Logan, President of the Federal Reserve Bank of Dallas; NAHB Housing Market Index: National Association of Home Builders (NAHB) Housing Market Index (HMI) rates the relative level of current and future single-family home sales; Powell: Jerome Powell, Chair of the Board of Governors of the Federal Reserve System; TOPIX: also known as the Tokyo Stock Price Index, is a capitalization-weighted index of all companies listed on the First Section of the Tokyo Stock Exchange; University of Michigan Consumer Sentiment Index: a survey of personal consumer confidence in economic activity, which is used to estimate future spending and saving.
Index Information: All returns represent total return for stated period. S&P 500 is a total return index that reflects both changes in the prices of stocks in the S&P 500 Index as well as the reinvestment of the dividend income from its underlying stocks. Dow Jones Industrial Average (DJ Industrial Average) is a price-weighted average of 30 actively traded blue-chip stocks trading New York Stock Exchange and Nasdaq. The NASDAQ Composite Index measures all NASDAQ domestic and international based common type stocks listed on the Nasdaq Stock Market. Russell 2000 is an index that measures the performance of the small-cap segment of the U.S. equity universe. MSCI International Developed measures equity market performance of large, developed markets not including the U.S. MSCI Emerging Markets (MSCI Emerging Mkts) measures equity market performance of emerging markets. Russell 1000 Growth Index measures the performance of the large- cap growth segment of the US equity universe. It includes those Russell 1000 companies with relatively higher price-to-book ratios, higher I/B/E/S forecast medium term (2 year) growth and higher sales per share historical growth (5 years). The Russell 1000 Value Index measures the performance of the large cap value segment of the US equity universe. It includes those Russell 1000 companies with relatively lower price-to-book ratios, lower I/B/E/S forecast medium term (2 year) growth and lower sales per share historical growth (5 years). The BBB IG Spread is the Bloomberg Baa Corporate Index that measures the spread of BBB/Baa U.S. corporate bond yields over Treasuries. The HY OAS is the High Yield Option Adjusted Spread index measuring the spread of high yield bonds over Treasuries.
Sector Returns: Sectors are based on the GICS methodology. Returns are cumulative total return for stated period, including reinvestment of dividends.
The views and opinions included in these materials belong to their author and do not necessarily reflect the views and opinions of NewEdge Capital Group, LLC.
This information is general in nature and has been prepared solely for informational and educational purposes and does not constitute an offer or a recommendation to buy or sell any particular security or to adopt any specific investment strategy.
NewEdge and its affiliates do not render advice on legal, tax and/or tax accounting matters. You should consult your personal tax and/or legal advisor to learn about any potential tax or other implications that may result from acting on a particular recommendation.
The trademarks and service marks contained herein are the property of their respective owners. Unless otherwise specifically indicated, all information with respect to any third party not affiliated with NewEdge has been provided by, and is the sole responsibility of, such third party and has not been independently verified by NewEdge, its affiliates or any other independent third party. No representation is given with respect to its accuracy or completeness, and such information and opinions may change without notice.
Investing involves risk, including possible loss of principal. Past performance is no guarantee of future results.
Any forward-looking statements or forecasts are based on assumptions and actual results are expected to vary from any such statements or forecasts. No assurance can be given that investment objectives or target returns will be achieved. Future returns may be higher or lower than the estimates presented herein.
An investment cannot be made directly in an index. Indices are unmanaged and have no fees or expenses. You can obtain information about many indices online at a variety of sources including: https://www.sec.gov/answers/indices.htm.
All data is subject to change without notice.
© 2026 NewEdge Capital Group, LLC

