


In the Rolling Stones’ 1969 classic “You Can’t Always Get What You Want”, Mick Jagger, with his iconic raspiness, describes a truth with which many investors are all too familiar: one rarely gets exactly what they ask for, but if you’re patient and persistent, you usually end up with something that works.
Today’s higher rate environment is no different. Over the last few years, investors have constantly pined for lower interest rates to ease the pressure of rising funding costs, but these hopes have been continuously dashed.
The Fed raised rates in September, its first meaningful move under Chair Warsh (which we covered here), and the 10-year treasury yield has spent most of the Fall near 5%. Higher for longer looks less like a market call and more like a description of current events. So instead of wishing for lower rates, we think investors should accept the higher rate environment and look for ways to take advantage of it.
Private equity is a good place to see how this new market paradigm is affecting individual asset classes. The private equity asset class, as we know it today, began its era of rapid growth and attractive returns at the beginning of a 40-year slide in borrowing costs. But as we have written about at length, this 40-year slide in interest rates is over and now the private equity industry is confronted with and (slowly) adjusting to a world of rising interest rates. Increasingly, private equity investor capital is coming back at a slower pace, and most of the capital that’s been raised in recent years is concentrated at the top of the market with the largest firms.
These dynamics, along with persistently high valuations, have resulted in a period of disappointing returns for the broad asset class in recent years. We acknowledge the struggles of the asset class in aggregate but also want to highlight where these disruptions and challenges have created opportunity for selective investors. So instead of “venting our frustration” like the demonstrators in “You Can’t Always Get What You Want”, we see this higher cost of capital environment as an opportunity to focus on private equity.
“I Went Down to the Demonstration to Get My Fair Share of Abuse”: Where the Market is Today
The last five years have been a difficult stretch for the average private equity firm. Distributions back to investors have been below 15% of portfolio value for four consecutive years, levels not seen since 2008 – 2009, and the length of time portfolio companies are being held is getting stretched.(1)
The chart below compares the average private equity fund with the S&P 500 by vintage year (the year a fund started investing). Since 2018, the private equity annual return has trailed the S&P 500.
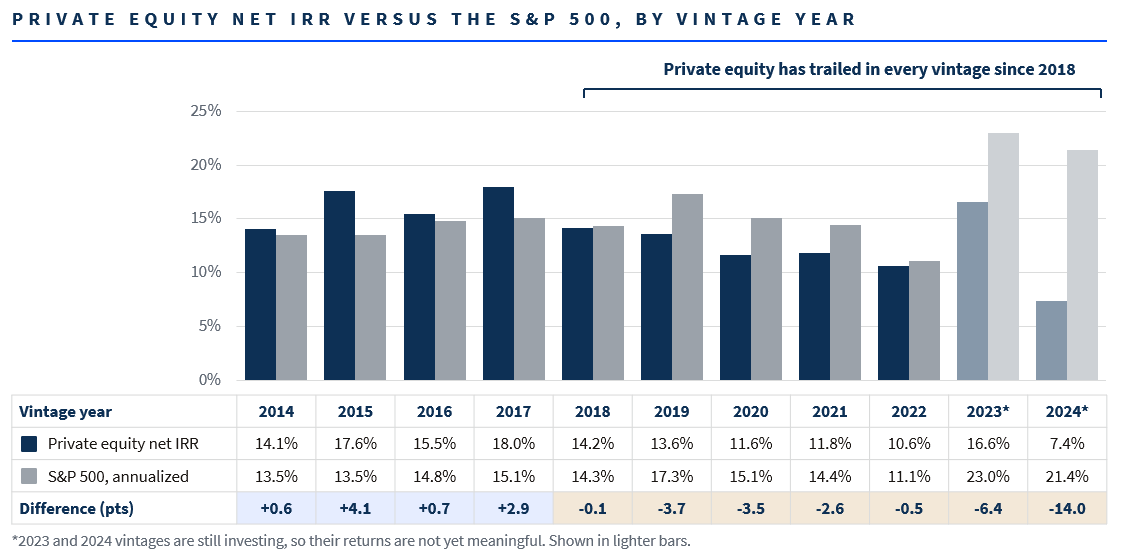
Source: PitchBook Benchmarks (private equity net IRR by vintage year) and Factset. The S&P 500 is unmanaged and cannot be invested in directly. Private equity net IRR and annualized S&P 500 return are different measures and are not directly comparable.
Higher rates are a part of the lagging return story; the other part is that the asset class, in aggregate, has a size problem. Private equity has grown to over $9 trillion in assets, approximately 16x the ~$600 billion it managed in 2000, while U.S. nominal GDP roughly tripled over the same period. (2)(3)
Funds of $10 billion or more now account for about 40% of total fundraising, up from just 5% in 2011.(4) Between 2010 and 2020, the twenty largest funds accounted for an average of 54% of total fundraising.(5) Given the top heavy nature of the private equity industry, the chart above really tells us more about how the largest funds have performed.
These fundraising dynamics have created a supply and demand imbalance. Record amounts of capital raised needs to be deployed within a five-year investment period. That capital is chasing a relatively small set of deals that are currently at record valuations, all while using debt that is increasingly expensive. So, the two return drivers that produced the majority of buyout returns historically, multiple expansion (selling a company at a higher price relative to its earnings than you paid) and cheap leverage, are no longer viable options to drive acceptable returns on their own.(1)(6)
The chart below breaks down return attribution for the median buyout company between 2008 and 2021. Looking at the right side of the chart, multiple expansion and leverage, which are effectively financial engineering return levers, have historically accounted for over 50% of total returns.
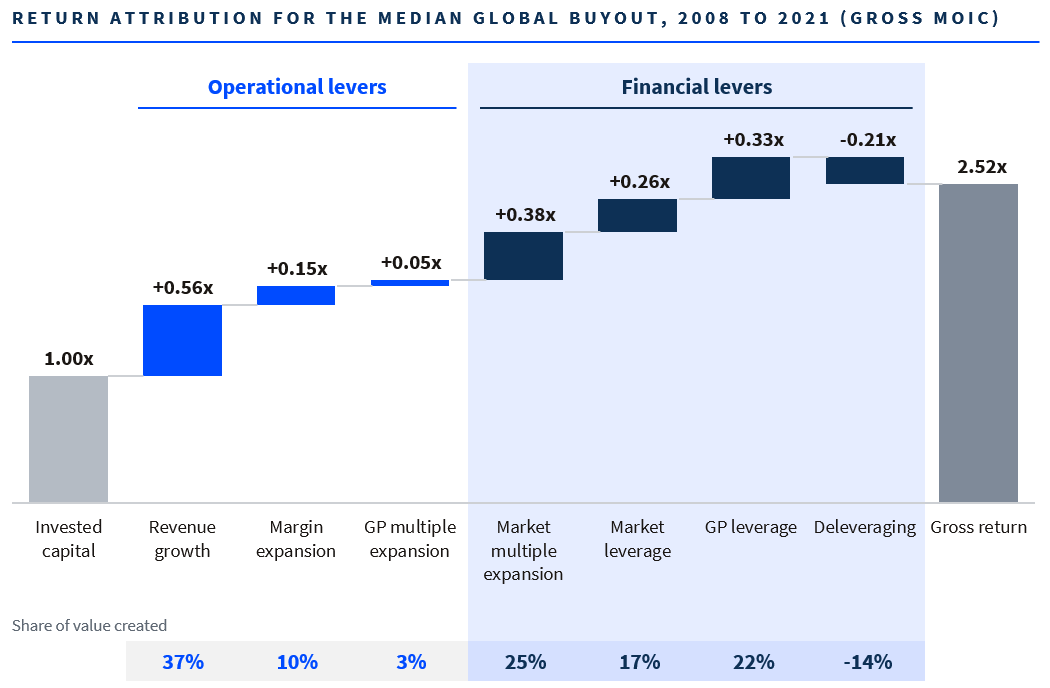
Source: Binfare, Brown, Ghent, Hu, Lundblad, Maxwell, Munday and Yi, Performance Analysis and Attribution with Alternative Investments. Presented by Future Standard. Return attribution for the median global buyout, 2008 to 2021, gross multiple on invested capital of 2.52x. Each step is that lever’s share of value created applied to the 1.52x gain. Operational and financial groupings follow the source exhibit.
“I Knew She Would Meet Her Connection”: The Average Is Not Representative
The average tells us little about what’s happening with individual funds underneath the surface. On a go forward basis, we expect returns within the asset class to be split. On one end, fierce competition among a growing group of largely commoditized funds pushes market average returns lower. On the other end, skilled managers have room to generate returns well above their benchmark. In our view, the size of the companies that the fund is purchasing is one of the best predictors of which end a fund will sit on. Size inherently informs us of the likely entry multiple being paid, the leverage needed to drive returns and the depth of the buyer pool at exit.
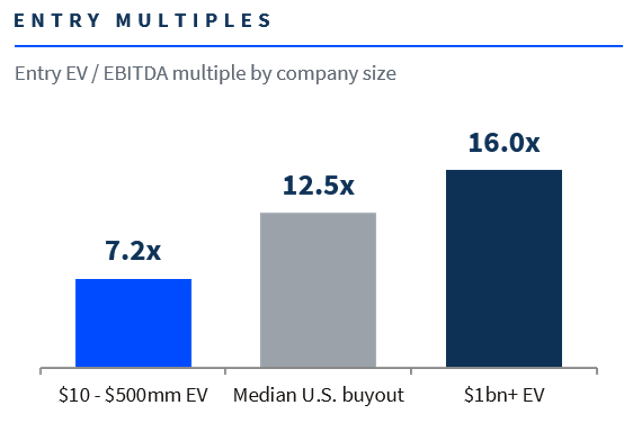
Pricing for the largest deals, in our view, is an impediment to forward returns in the large cap portion of the market. The median U.S. buyout multiple sits at 12.5x operating profit, tying the 2021 record.(7) Companies worth over $1 billion trade at 16.0x versus the 2017 – 2019 average of 11.1x.(7)(8)
At the same time, rising rates have increased the cost of leverage. The average loan yield for private-equity owned companies sits at 8.2% versus 4.2% in 2021.(9) We believe it will be difficult for managers consistently paying 12.0x – 15.0x operating profit with 8% debt to reliably triple their investment over a seven-to-ten-year hold period, and we don’t expect lower rates to bail them out.
The chart below shows the difference in multiple expansion between deals exited in 2015 versus 2025. In 2015 the average private equity company that sold saw 2.5 turns of multiple expansion (bought at 10.0x operating profit before exiting in 2015 at 12.5x operating profit). In 2025, the average deal saw just 1.0 turn.(1)
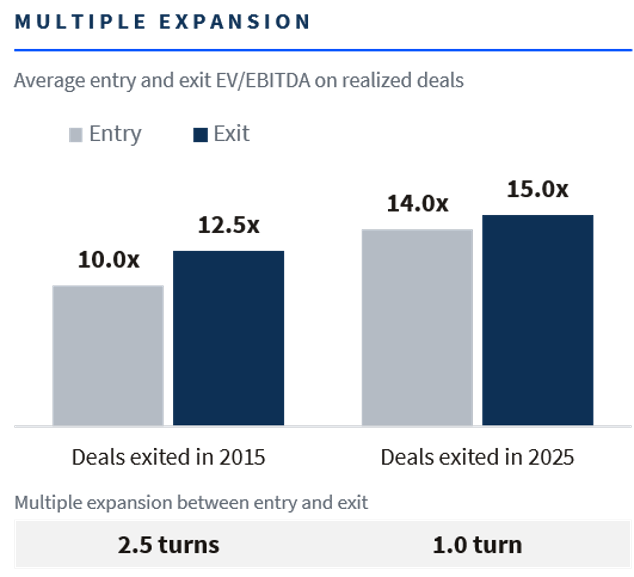
Source: Bain & Company, Global Private Equity Report 2026: average entry and exit multiples on realized buyout deals.
We also don’t believe the IPO market will rescue the exit environment within the large cap space. Across private equity, IPOs were 31% of Q2 exit value but only 5% of exit count.(7) The IPO window has been open, but only for the very largest companies, a far cry from the IPO boom that many were hoping for at the start of this year.
These dynamics are already showing in performance. The twenty largest funds in each vintage from 2010 to 2024 returned an average 13.9% net IRR which matches the 13.9% annualized return for the S&P over the same period.(10) Our commentary isn’t a knock on the fund managers themselves; we simply acknowledge that it’s difficult to outperform when the same group of funds is consistently bidding on the same deals with the same expensive debt. In our view, returns at the large end of the market look increasingly like “beta”, or market, returns as opposed to the “alpha” outperformance that historically justified higher fees and ten-year lockups.
“If You Try Sometimes”: But Disruption Creates Opportunity
So why are we spending our time on private equity? We believe the challenged dynamics at the top of the market create opportunities for investors who know where to look.
From 2010 to 2022, money raised by large funds grew ~11x while their investable universe grew about ~4x, resulting in highly competitive auction processes and, ultimately, funds likely overpaying for companies. Over the same period, small and mid-sized funds experienced the opposite. Money raised increased ~3x but the investable universe for those funds grew ~4x. Despite the massive growth of the private equity industry at large, the opportunity set for small and mid-sized funds is larger today on a relative basis than it was in 2010.
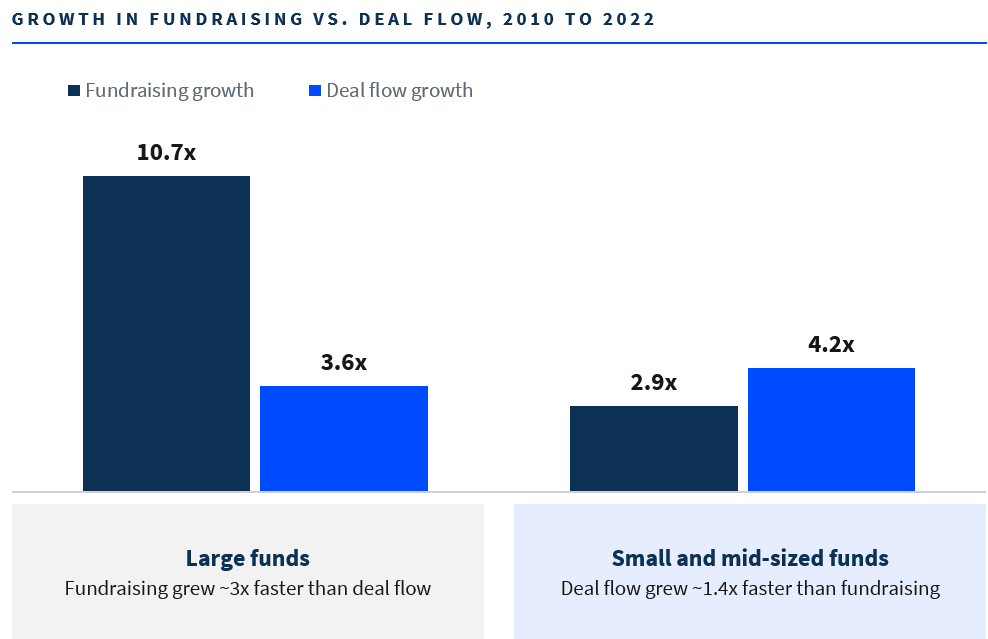
Source: Schroders, Private Equity 2025 Outlook, citing Preqin data for 2010 to 2022: growth multiple in fundraising and in deal flow over the period, by fund size.
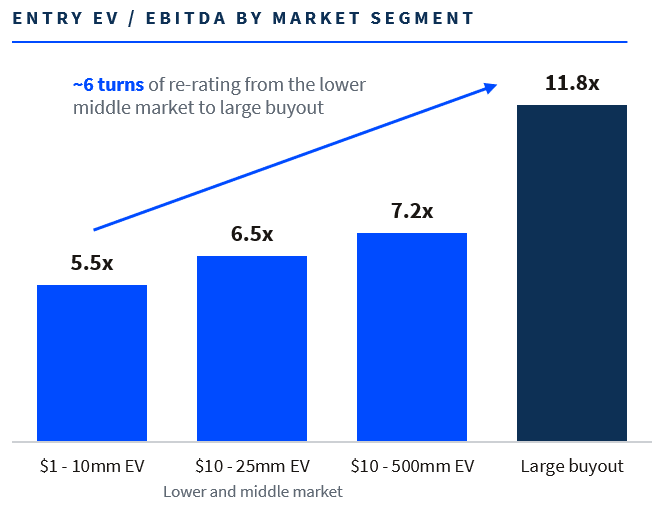
Companies at the smaller end, between $10 and $500 million in value, are less expensive too, typically around 7.2x operating profit.(11) Smaller funds also generally use less debt ~3.6x as a multiple of operating profit versus 5.3x for larger deals.(11)(12) This means that smaller funds tend to be less reliant on low debt costs to drive returns.
Source: PitchBook Q2 2026 US PE Breakdown, CIBC US Middle Market Monitor Q1 2026
Because these smaller funds haven’t been able to use as much debt historically, these managers are skilled at creating value from operational improvements. The returns at this end of the market come primarily from growing companies as opposed to their larger peers which have historically relied on financial engineering.
When it’s time to sell these portfolio companies, smaller funds also benefit from a broader buyer universe. In Q2 2025, 75.9% of private equity deals were add-ons (smaller companies bought and bolted onto a larger platform).(8) Large funds that need to deploy capital create a standing bid for the companies that smaller funds are investing in.
Source: GF Data (H1 2025, by deal-size tier), PitchBook, Bain & Company and CIBC
This standing bid from larger funds is important in the broader market context because distributions back to investors have been disappointing and this dynamic could get worse before it gets better. Roughly 40% of private equity owned companies have been held for five years or more, versus 29% in 2019.(1)
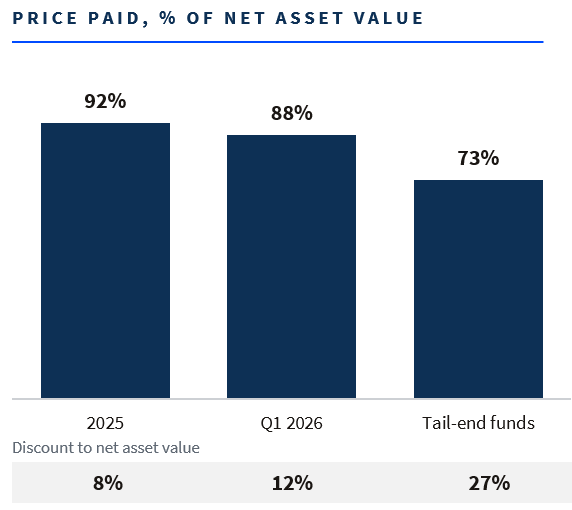
Investors who need cash today are increasingly willing to sell their fund interests at a discount. The purchase of those fund interests from an existing holder is called a secondary transaction. As the chart below shows, buyout interests traded at 92% of reported value in 2025 and 88% in Q1 2026.(13)(14) As distributions continue to lag, we expect the discount to grow.
Source: Jefferies Private Capital Advisory, Global Secondary Market Review (January 2026). Evercore Private Capital Advisory (FY2025 and H1 2026 Secondary Market Reviews)
Secondaries offer investors known companies and fund interests, so there is no “blind pool risk”. This visibility is bought at a discount to net asset value, while these companies are generally further along in their hold period, so capital has potential to come back to the secondary investor sooner.
“You Get What You Need”: Conclusion, Get Used to It
Private equity’s size problem isn’t going away, and higher rates make it harder for larger funds to continue to rely on the financial engineering that drove much of their historical returns. In our view, investors at the top of the market may see returns closer to the market average and experience longer waits to get their capital back.
But that same environment has created opportunity down market. Companies that can be bought small and cheap, grown through their hold period, and sold up-market benefit directly from the record amounts of capital raised by their larger peers. Higher rates have made it harder for those larger funds to generate returns through financial engineering, which only makes well-run, growing companies more valuable to them. Secondaries offer a direct way to play a slower exit environment, as investors who need liquidity are willing to sell good assets that are both further along in their hold period and at a discount. As a firm, we have historically entered periods of disruption rather than waiting them out. We didn’t get the lower rates we wanted, but what we got may be more useful.
SOURCES
(1) Bain & Company, Global Private Equity Report 2026 (February 2026): distributions below 15% of NAV for four consecutive years; hold periods around seven years; 40% of portfolio companies held five years or more versus 29% in 2019; 10.0x/12.5x (2015) vs 14.0x/15.0x (2025) entry/exit multiples on realized deals; $1.3 trillion of buyout dry powder.
(2) Brown Brothers Harriman, Investing in Private Markets, Suzanne Brenner and Justin Reed (May 2025), citing Preqin: global private equity AUM of $607 billion in December 2000 and $9.7 trillion as of September 2024, a ~16x increase.
(3) U.S. Bureau of Economic Analysis, National Income and Product Accounts, Table 1.1.5: U.S. nominal GDP of ~$10.3 trillion in 2000 and ~$29.2 trillion in 2024.
(4) European Business Magazine, How the Big Three PE Firms Now Control More Than Most Countries, Nick Staunton (January 2026), citing PitchBook and the PEI 300: funds of $10 billion or more nearly 40% of private equity fundraising vs 5% in 2011; ten largest funds 45.7% of capital raised in 2025 vs 34.5% in 2024.
(5) PitchBook and Preqin data compiled 10/23/2026. PE Statistics (June 2026): top-20 funds in each vintage year 2010-2020 averaged 54% of total private equity fundraising, 14% weighted average net IRR and 1.3x weighted average net MOIC.
(6) McKinsey & Company, Global Private Markets Report 2026 (February 2026): ~40% of dry powder more than two years old; leverage and multiple expansion 59% of returns on 2010-2022 deals (roughly two-thirds in the 2024 edition).
(7) PitchBook, Q2 2026 US PE Breakdown (July 2026) and Q1 2026 Global Private Market Fundraising Report (May 2026): median US buyout EV/EBITDA 12.5x in 2025, 16.0x for $1b+ companies; PE-backed IPOs 31% of Q2 2026 exit value and 5% of count; top ten funds more than half of Q1 2026 fundraising vs 26.8% ten-year average.
(8) PitchBook, Q2 2025 US PE Breakdown (July 2025): add-ons 75.9% of buyout deal count, 340 bps above the five-year average; 2017-2019 entry multiples of 10.8-11.4x.
(9) Fidelity Institutional, Q2 2026 Leveraged Loan Market Review (LCD/Bloomberg data as of June 30, 2026): loan yield to maturity 8.21% vs 4.20% in 2021.
(10) PitchBook Benchmarks and FactSet: twenty largest funds in each vintage, 2010-2024, averaged 13.9% net IRR vs 13.9% annualized for the S&P 500 over the same period.
(11) CIBC US Middle Market Monitor Q1 2026: 7.2x average EBITDA multiple and 3.6x total debt to EBITDA for $10-500mm enterprise value LBOs in 2025. GF Data, H1 2025: deals under $25mm of enterprise value at 5.5-6.7x.
(12) PitchBook | LCD, US LBO leverage statistics 2025: 5.3x total debt to EBITDA for large US buyouts
(13) Jefferies Private Capital Advisory, Global Secondary Market Review (January 2026): $240b of 2025 volume; buyout LP interests priced at 92% of NAV in 2025 and 88% in 1Q26; tail-end funds at 73%.
(14) Evercore Private Capital Advisory, FY2025 Secondary Market Review (February 2026) and H1 2026 Review (July 2026): tail-end pricing ~70% of NAV; volume ~22% CAGR since 2016.
IMPORTANT DISCLOSURES
The views and opinions included in these materials belong to their author and do not necessarily reflect the views and opinions of NewEdge Capital Group, LLC.
This information is general in nature and has been prepared solely for informational and educational purposes and does not constitute an offer or a recommendation to buy or sell any particular security or to adopt any specific investment strategy.
NewEdge and its affiliates do not render advice on legal, tax and/or tax accounting matters. You should consult your personal tax and/or legal advisor to learn about any potential tax or other implications that may result from acting on a particular recommendation.
The trademarks and service marks contained herein are the property of their respective owners. Unless otherwise specifically indicated, all information with respect to any third party not affiliated with NewEdge has been provided by, and is the sole responsibility of, such third party and has not been independently verified by NewEdge, its affiliates or any other independent third party. No representation is given with respect to its accuracy or completeness, and such information and opinions may change without notice.
Investing involves risk, including possible loss of principal. Past performance is no guarantee of future results.
Any forward-looking statements or forecasts are based on assumptions and actual results are expected to vary from any such statements or forecasts. No assurance can be given that investment objectives or target returns will be achieved. Future returns may be higher or lower than the estimates presented herein.
An investment cannot be made directly in an index. Indices are unmanaged and have no fees or expenses. You can obtain information about many indices online at a variety of sources including: https://www.sec.gov/answers/indices.htm.
All data is subject to change without notice.
© 2026 NewEdge Capital Group, LLC

