Weekly Summary – April 10 – 14
Key Observations:
- We viewed this week’s data as confirming most of last week’s data of an increased chance of a U.S. recession. But the overriding theme after reviewing the economic data of the last two weeks seems to be one of uncertainty. We surmise that uncertainty has risen subsequent to the banking crisis that we have discussed in our prior commentaries. There appears to be a growing divergence of opinions of Federal Reserve (Fed) officials. We thought that most of this week’s data showed slowing economic trends and slowing inflation rates. We were surprised to see that consumers’ year ahead inflation expectations rose dramatically in two recent surveys, while longer term expectations remained well anchored. We suggest that the volatility of the U.S. bond market has also shown a similar lack of conviction.
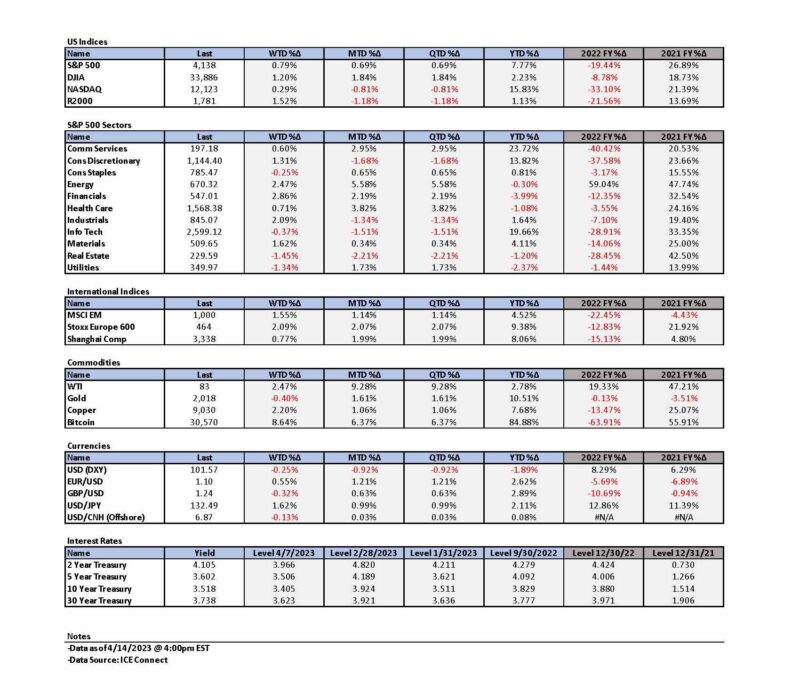
- U.S. Treasury yields continued to rise through most of Friday and the two-to 10-year Treasury yield curve became more inverted at least through early afternoon. CME Group’s FedWatch Tool showed that the probability of a 25 basis points (bps) hike at the Fed’s next early May meeting increased to as high as 81.6% on Friday from 67% on Wednesday. We assume that “overly” long positioning in Treasuries may have contributed to the rise in yields on Friday. “Excessively” short positioning in USD may also have contributed to the upward reversal of the USD from one-year lows early on Friday. Uncertainties and lack of conviction appear to be playing a prominent role in “surprising” market movements.
- In financial markets characterized by lack of conviction, we deem it even more important to rely on a risk-reward analysis. As we have stated often, in a slowing economy, high quality growth and tech stocks should continue to command premium valuations. But our view remains “that after substantial gains this year some of these holdings could be trimmed because … the risk-reward no longer justifies maintaining ‘full’ positions.” This view has been vindicated mostly in the last couple of weeks. On April 13, Goldman Sachs observed that “the disconnect between NDX [Nasdaq-100] and bond yields has grown to statistically significant levels.”
- A few major U.S. banks announced their earnings on Friday. Only two held on to most of their initial gains throughout most of the day. Guidance and reserves for potential losses could become more problematic. We continue to remain concerned that there could be more disruptions stemming from issues relating to smaller regional banks. Hopefully we will develop a clearer picture of credit availability as regional banks announce their earnings, reserve allowances and their proclivity to lend.
The Upshot: Our general investment approach remains the same as depicted in last week’s commentary. We maintain our preference for quality stocks with good balance sheets, relatively stable cash flows with stable margins. Volatility across sectors continues to be supportive of a diversified global portfolio for long term investors. We continue to stress that stock selectivity in the current environment is of paramount importance. We forecast continued financial market volatility.
At present, we see few opportunities to invest at “compelling” entry points. It has been our experience that at such times it is best to be patient and await more compelling entry points for further investment. We have not been disappointed that such opportunities inevitably arrive.
You Never Can Tell – Fed Minutes Confirmed Banking Crisis Increased Uncertainty
Most of the economic data we analyzed this week appeared to confirm the many weakening economic trends highlighted in last week’s letter. The much-stronger-than-expected March trade data from China released this week seemed almost to contradict the weaker-than-expected Chinese manufacturing data for March that we discussed last week. The exceptionally strong export data did not seem consistent with the manufacturing data. The “rapidity of change,” which we have viewed as a hallmark of economic data since the onset of the pandemic, continues to show surprising results. Chuck Berry’s song “You Never Can Tell” about a young couple getting married reinforces our observations that there is no way of knowing, or being certain, what the economic impacts of the Fed’s aggressive monetary tightening policies will be in terms of timing, magnitude and specifics. For those wanting to see a more visual depiction of this song, we recommend the dance scene in “Pulp Fiction” as performed by Uma Thurman and John Travolta. The Fed officials’ divergence of opinions started to become more evident this week. We surmise that the bulk of any divergences of opinions relates to any possible lingering effects from the recent banking turmoil discussed in our recent commentaries. The Fed’s last meeting occurred March 21-22, shortly after the banking crisis became the focus of financial markets and regulators. The minutes of this meeting were released on Wednesday. “Given their assessment of the potential effects of the recent banking-sector developments, the [Fed] staff’s projections at the time of the March meeting included a mild recession starting later this year, with a recovery over the subsequent two years.” Furthermore, the staff projected that “total inflation was projected to step down markedly this year and then to track core inflation over the following two years.” Core inflation was forecast to “slow sharply” next year due to ”less projected tightness in product and labor markets.” Additionally, the staff admitted that the uncertainty around its “baseline” forecast was “much greater” when compared to its previous forecast. U.S. stocks generally traded down after this announcement as many investors apparently mistakenly assumed that this was the Fed’s “base” case. We wish to remind the reader that the staff’s views can remain divergent from the Federal Open Market Committee (FOMC) participants’ views. In fact, in the press conference immediately following this FOMC meeting, Fed chair Powell stated his belief that “there is a pathway to” a soft landing and that the FOMC was “certainly trying to find it.”
FOMC Participants – Possible Divergence of Opinions
All participants – twelve voting and seven rotating nonvoting – commented “that recent developments in the banking sector were likely to result in tighter credit conditions for households and businesses and to weigh on economic activity, hiring and inflation.” Participants agreed that the extent of these effects was uncertain. The banking crisis has exacerbated the uncertainty around the Fed’s tightening monetary policies as the anticipated further tightening of credit likely could have more “uneven” and perhaps surprising effects across the U.S. economy. Under these new circumstances, we were not surprised to see a divergence of opinions expressed by various Fed officials. In other words, they seemed to agree that “you never can tell.”
Likely Declines in Loans and Credit Availability
Many analysts now assume that the banking crisis has been “contained.” On April 12, Goldman Sachs (Goldman) stated that the “risk of an outright banking crisis has declined sharply, … [that] Fed lending to banks has come off the highs, and deposit flight has subsided.” But there was evidence that bank lending might have been affected already. On April 10, J.P. Morgan (JPM) highlighted that bank lending fell more than $100 billion over the last two weeks of March, which was the largest such fall on record. In the March National Federation of Independent Business (NFIB) small business optimism index released on Tuesday, there was a small but meaningful increase in small businesses reporting that credit “was harder to get” than in previous attempts.” The NFIB index continued to deteriorate in March as “hiring plans fell to the lowest level since May 2020.”
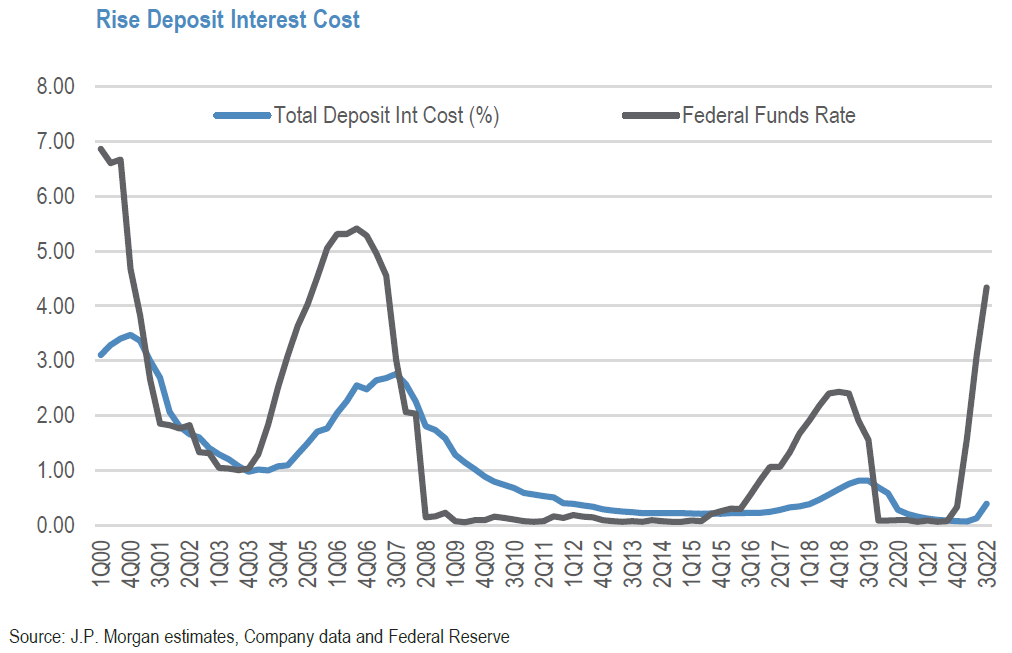
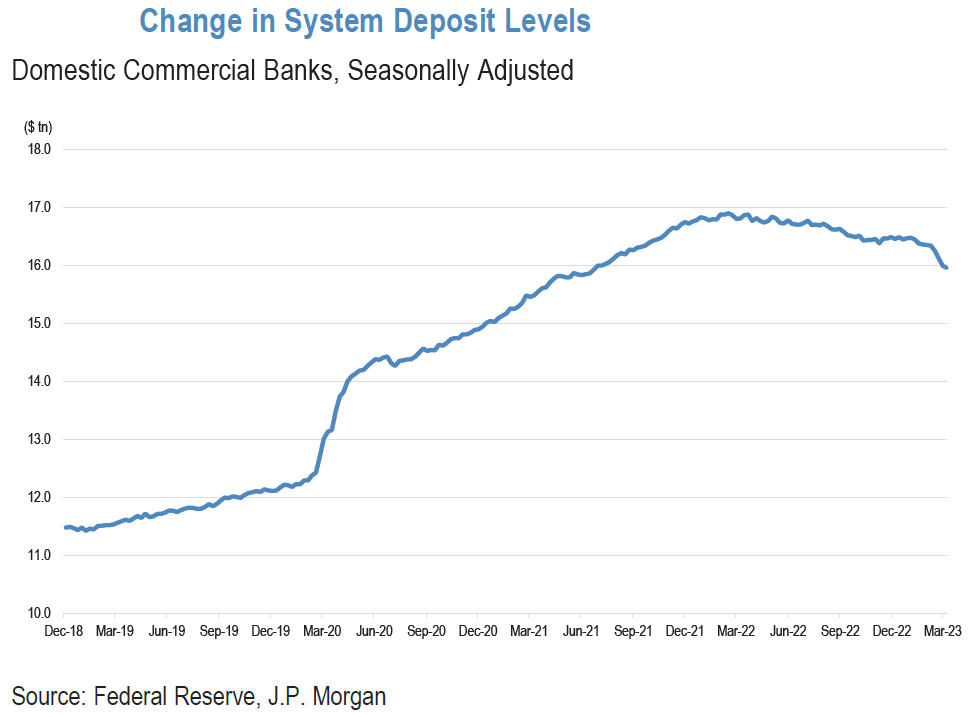
Source: JP Morgan, U.S Banks (4-12-2023)
New York Fed Survey – Perceptions of Declining Credit Availability and Increased Year Ahead Inflation Expectations
On Monday, the New York Fed released its March survey of consumer expectations. Perceptions that credit access is harder to obtain now versus one year ago continued to rise to a series high. Households also foresaw shrinking credit availability one year from now as well. We have observed these trends before. However, we suspect that the banking crisis has increased the difficulty of obtaining credit now and in the future. This survey shows consumers’ awareness of these trends and we expect that these perceptions could cause consumers to spend less in the future. Given our perception that inflation trends were moderating in general, we were quite surprised to see the median inflation expectations of respondents to this survey increasing over the next year from 4.2% expected in February’s survey to the revised 4.7% new estimate. Median three-year and five-year inflation expectations were more stable as the median three-year inflation expectation increased 0.1% to 2.8% and decreased 0.1% to 2.5% for a five-year time horizon. Uncertainty regarding future inflation outcomes increased only for the one-year time horizon.
Slowing Wage Growth Trends
In the March FOMC minutes, the staff also commented on slowing – but still elevated – nominal wage growth. The three-month change in average hourly earnings for all employees was at an annual rate of 3.6% versus the 12-month pace of 4.6%. Last Friday’s nonfarm payrolls revealed that the rate of average hourly wages dropped to an increase of 4.2% compared to twelve months earlier. On April 12, Goldman stated that average hourly earnings growth increased to 3.3% on a one-month annualized basis in March, versus 2.6% in February. However, the three-month average annualized rate fell from 3.6% in February to 3.2% in March. Goldman’s Q1 “wage tracker” is 4.3% quarter-over-quarter (q/q) versus 4.7% in Q4 2022. Goldman estimates that a 3.5% wage growth rate would be consistent with a 2% rate of inflation.
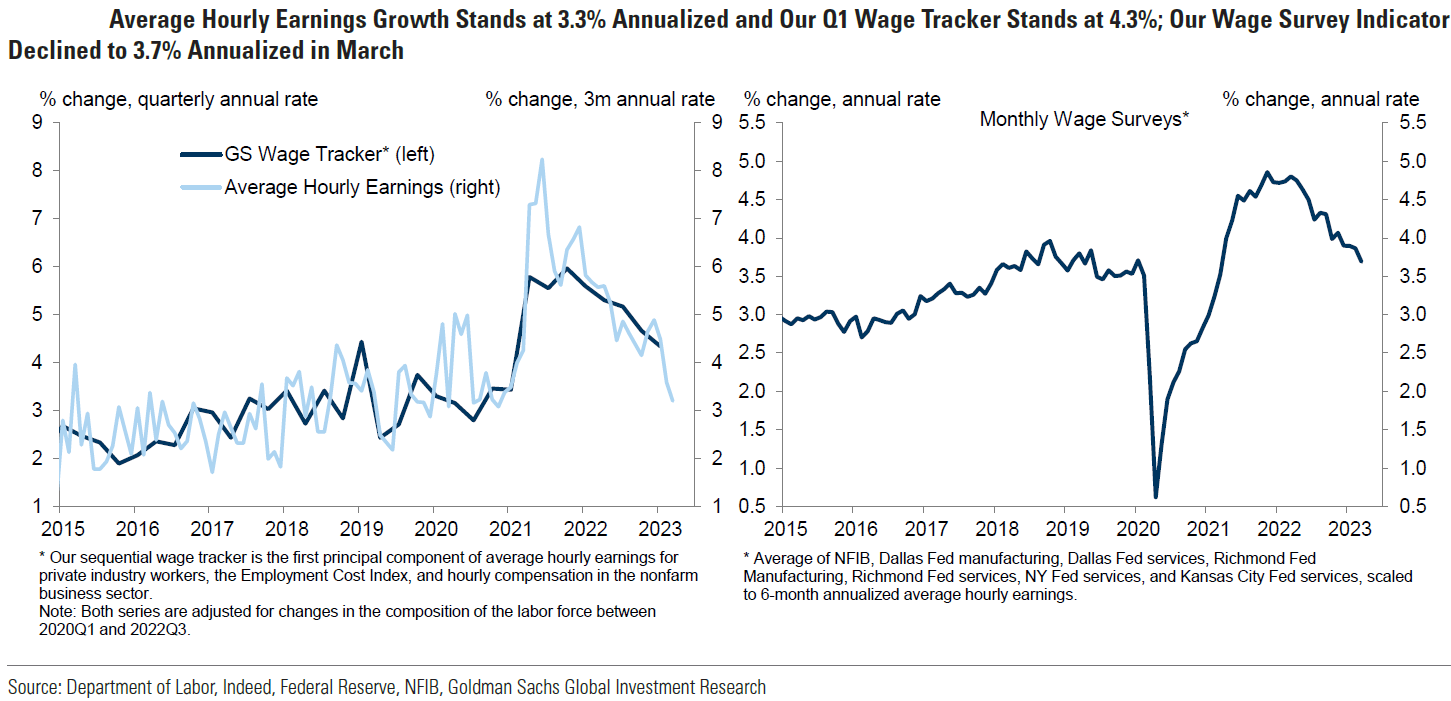
Source: Goldman Sachs, US Daily: April Recession Watch Tracker: Labor Market Rebalancing Continues and Shelter Inflation Slows (Abecasis) (4-12-2023)
March CPI Mostly Lower
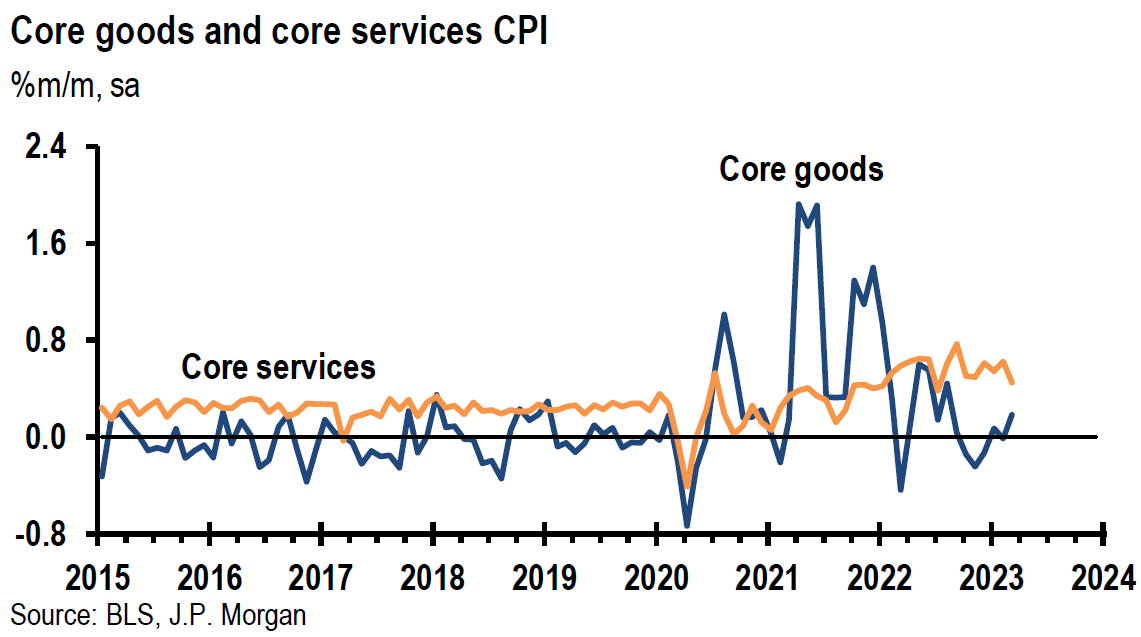
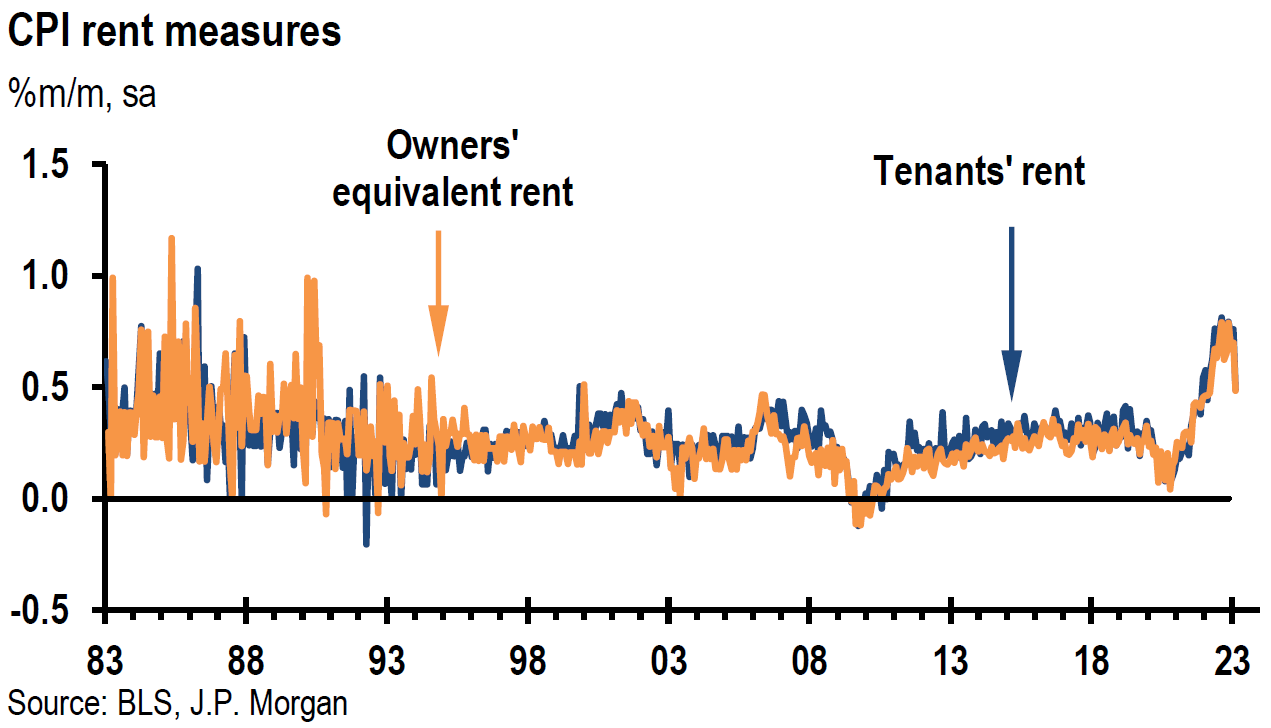
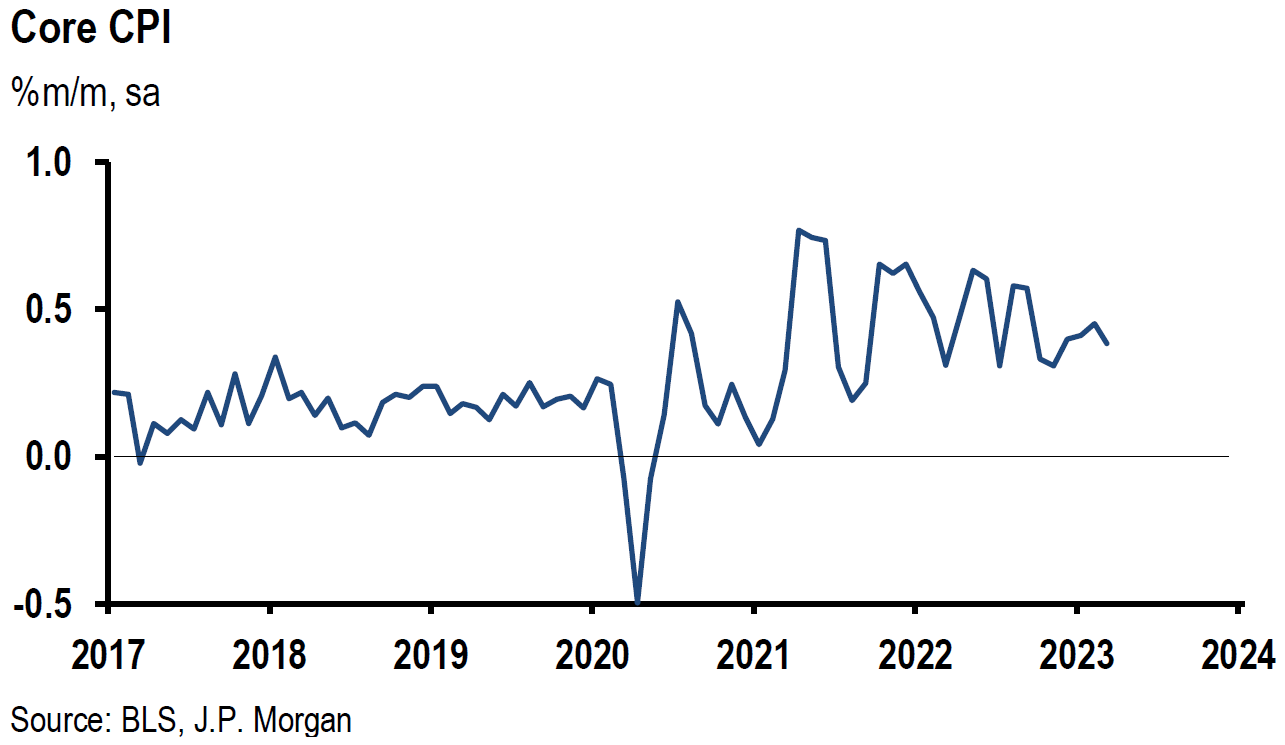
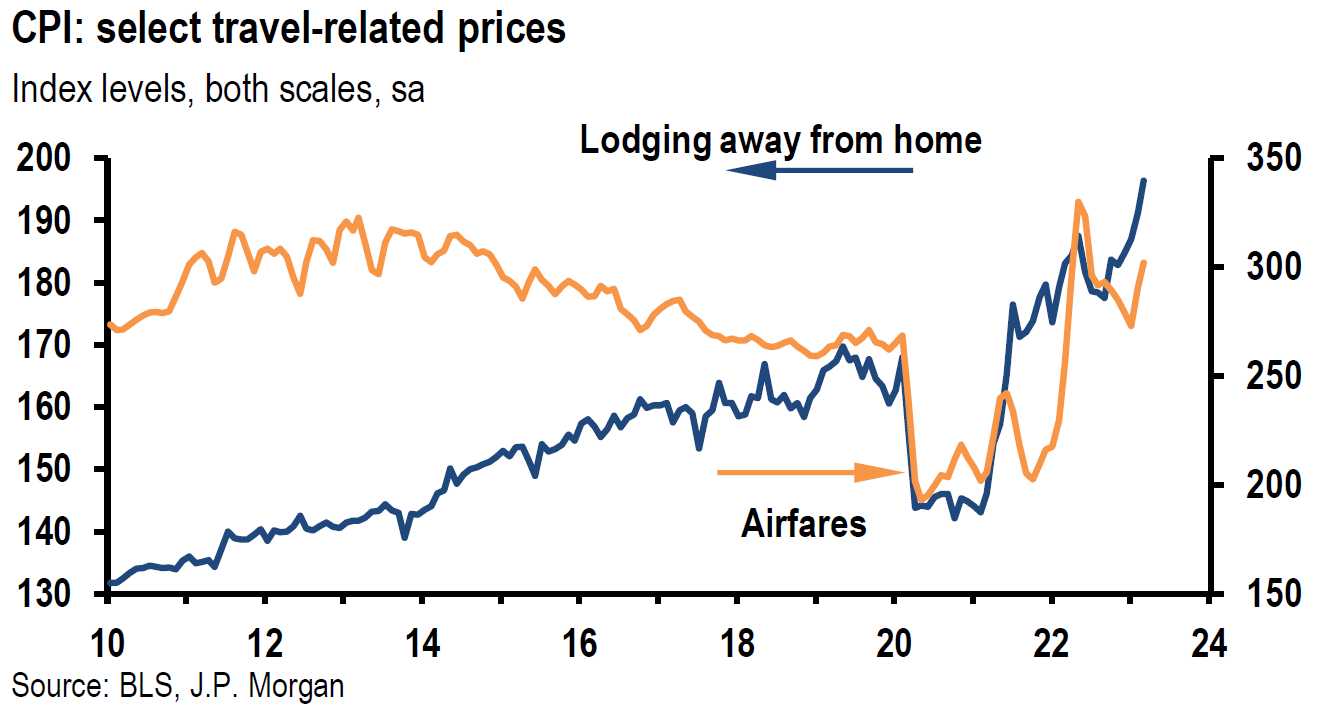
The March Consumer Price Index (CPI) released on Wednesday was lower than expected generally. CPI increased 0.1% month-over-month (m/m) versus 0.4% in February and below an expected 0.2% increase. Headline CPI rose 5.0% year-over-year (y/y) compared to 6.0% in February and a median forecast of 5.1%. This year-over-year increase was the smallest annual increase since the period ending May 2021. Core CPI – excluding food and energy – rose 5.6% y/y as expected and compared to February’s 5.5% gain. On a month-over-month basis, core CPI rose 0.4% as expected and similar to February’s advance. The index for shelter was the largest contributor by far to the increase in headline CPI. Energy was 3.5% lower m/m and food was flat, with the food at home index 0.3% lower m/m. Energy fell 6.4% y/y and food was 8.5% higher. Core services rose 0.4% m/m, which was the lowest increase since the middle of 2022. We have been anticipating a relatively sharp contraction in the shelter component of core CPI. This finally occurred in March. Rent rose 0.49% m/m versus 0.76% in February, and Owners’ Equivalent Rent (OER) was 0.48% higher versus February’s 0.70% increase. The March rent and OER monthly readings were the lowest since early 2022. Powell’s “super-core” – excluding tenants’ rent and OER – was 0.4% higher, which is roughly in line with the trend for the past six months. According to JPM on Wednesday, this “metric” was 4.8% higher annualized in Q1, the lowest since late 2021, but about 2% higher than its pre-pandemic trend. “Within the super-core, medical care services were down 0.5%, close to the recent trend. Airfares jumped 4.0% and lodging away from home was up 2.7%. Another strong component was education, which increased 0.5%, led by higher prices for day care and preschool,” JPM reported.
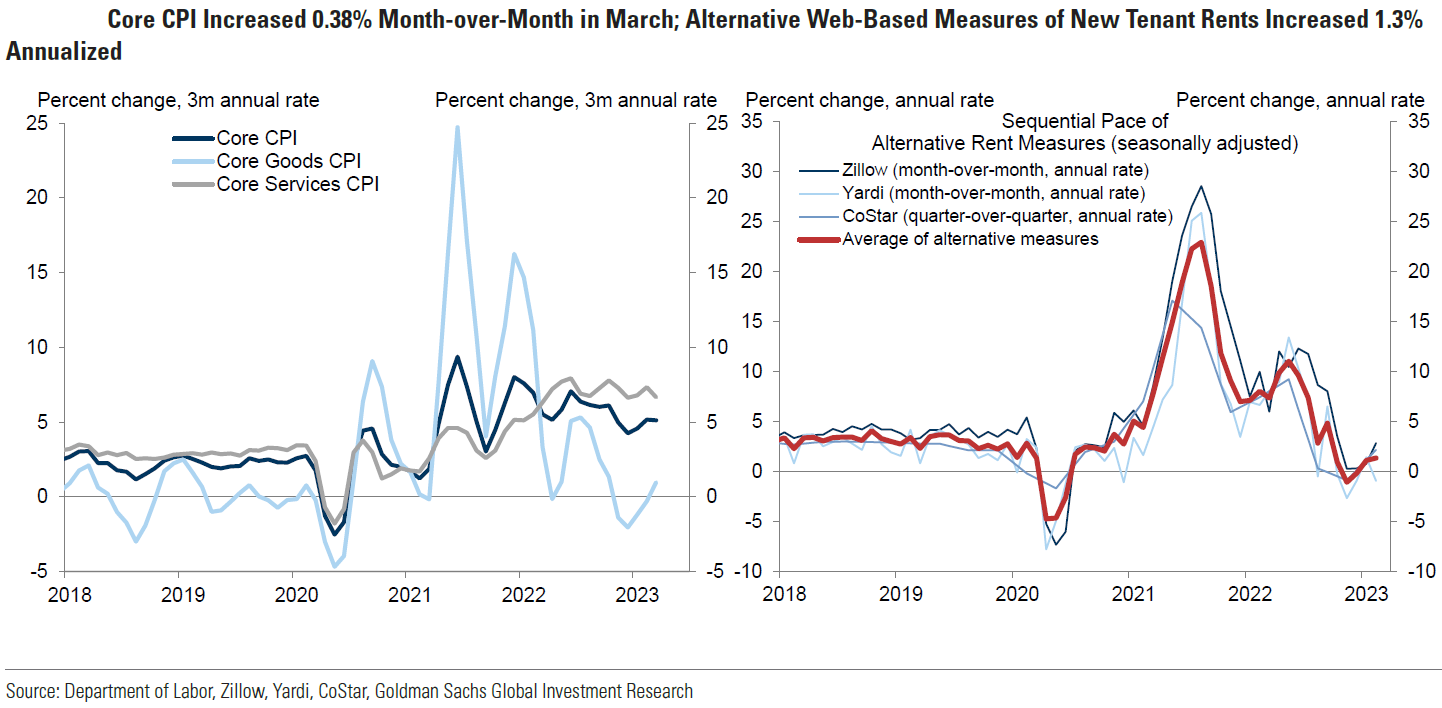
Source: Goldman Sachs, US Daily: April Recession Watch Tracker: Labor Market Rebalancing Continues and Shelter Inflation Slows (Abecasis) (4-12-2023)
Source: JP Morgan, Softer headline CPI not yet cause for a pause (4-12-2023)
Lower March PPI
The Producer Price Index (PPI) fell 0.5% m/m compared to an expected “flat” reading that was also February’s revised level. This was the biggest monthly decline since April 2020. A 6.4% decline in energy prices was responsible mostly for this monthly drop. Services prices declined 0.3% m/m – the largest monthly decrease since April 2020. This was due mainly to a 7.3% decrease in margins for machinery and vehicle wholesaling. PPI was 2.7% higher y/y versus an expected increase of 3.0% and versus an upwardly-revised February reading of 4.9%. This was the smallest increase since January 2021. PPI excluding food and energy fell 0.1% m/m, and was 3.4% higher y/y as expected. This compared to a median forecast of a 0.2% m/m increase that was the same as the revised February reading. The PPI less food, energy and trade services increased 0.1%, the lowest since the start of the pandemic. This compared to a median forecast of a 0.3% increase m/m and a 0.2% higher reading in February. The year-over-year increase for this category was 3.6%.
Initial Jobless Claims Increase, Continuing Claims Decrease
Initial jobless claims rose 11,000 to 239,000 for the week that ended April 8 versus an expected 232,000. This was the highest level since January 2022, and the first increase in three weeks. The four-week moving average rose 2,250 to 240,000, which is the most since November 2021. A level of 270,000 initial jobless claims is often considered as a level indicating a deteriorating labor market that also might be suggesting a recession. For the week that ended April 1, continuing claims fell 13,000 to 1.810 million versus an expected 1.814 million. The four-week moving average rose from 1.804 million the prior week to 1.8135 million. This was the highest level since November 13, 2021.
China’s March Exports Far Exceed Expectations
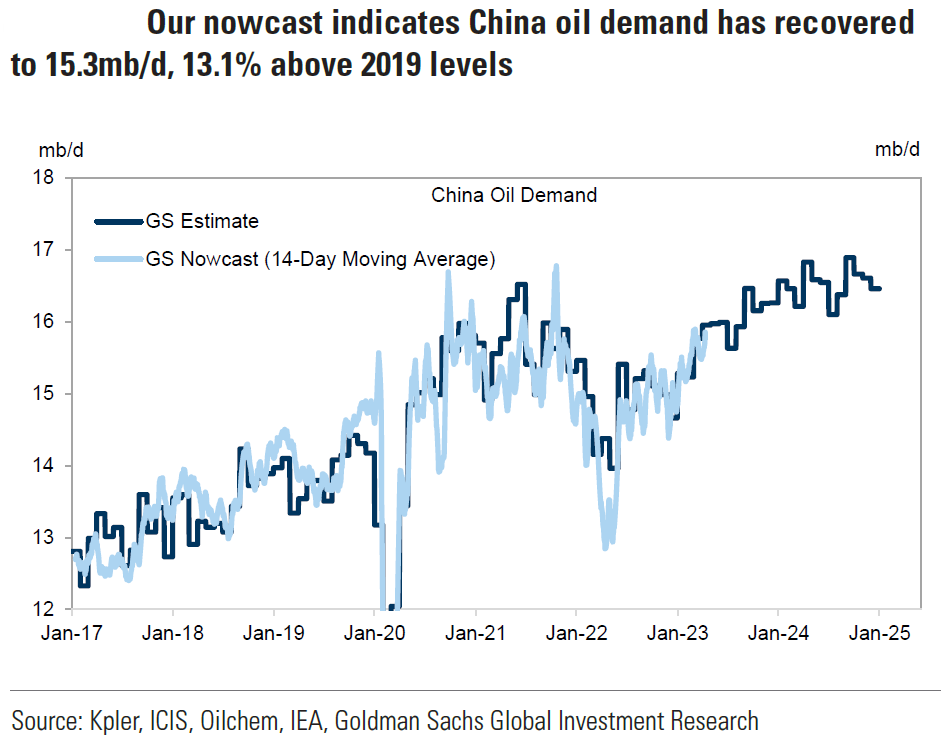
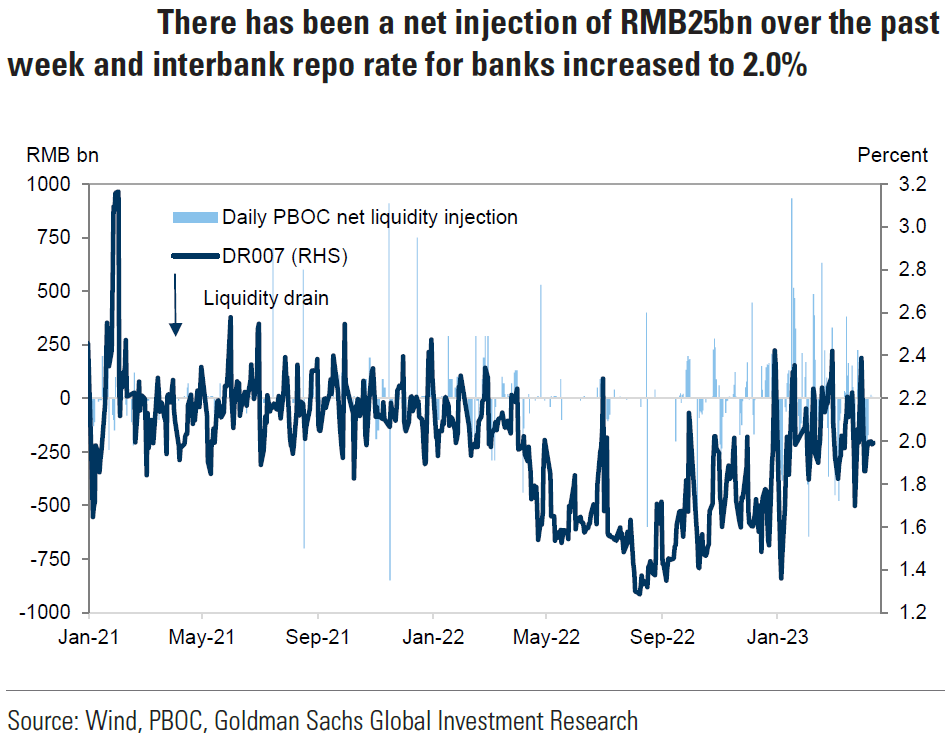
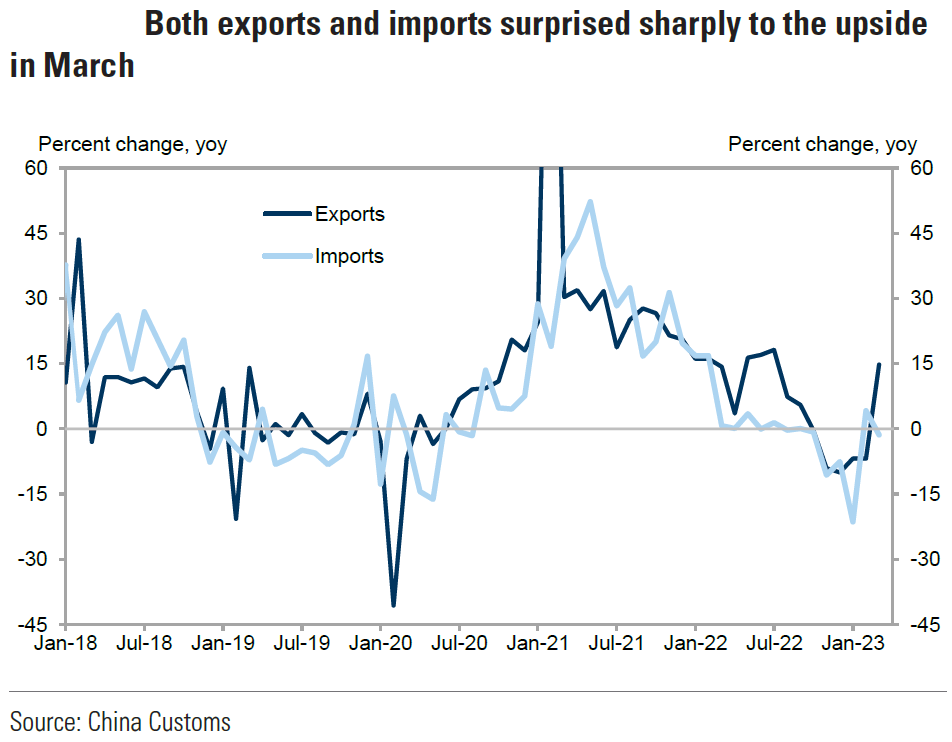
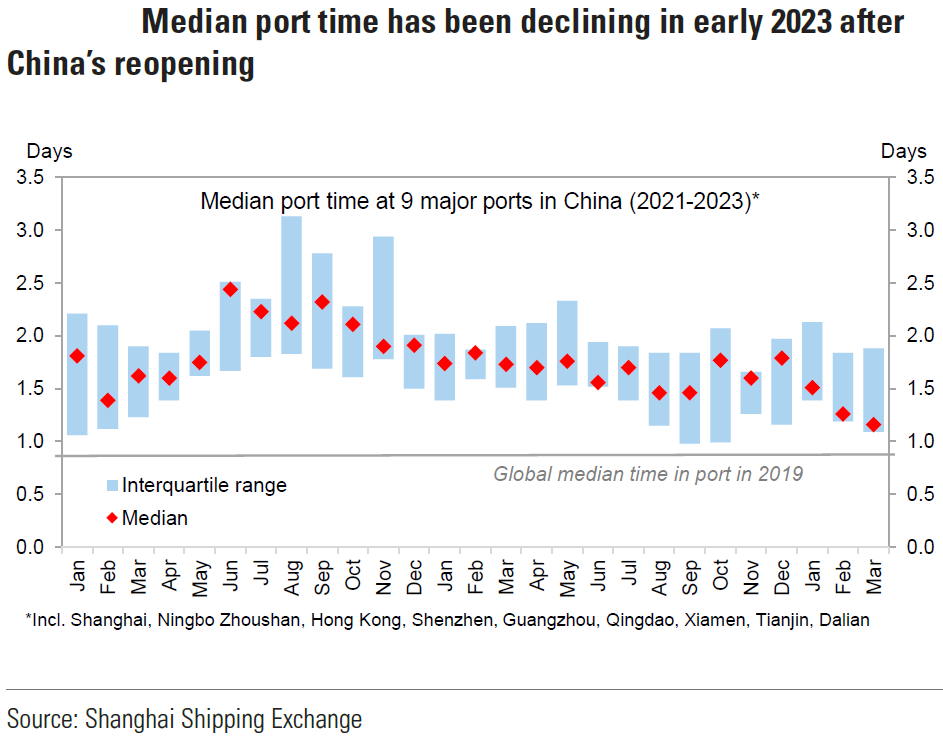
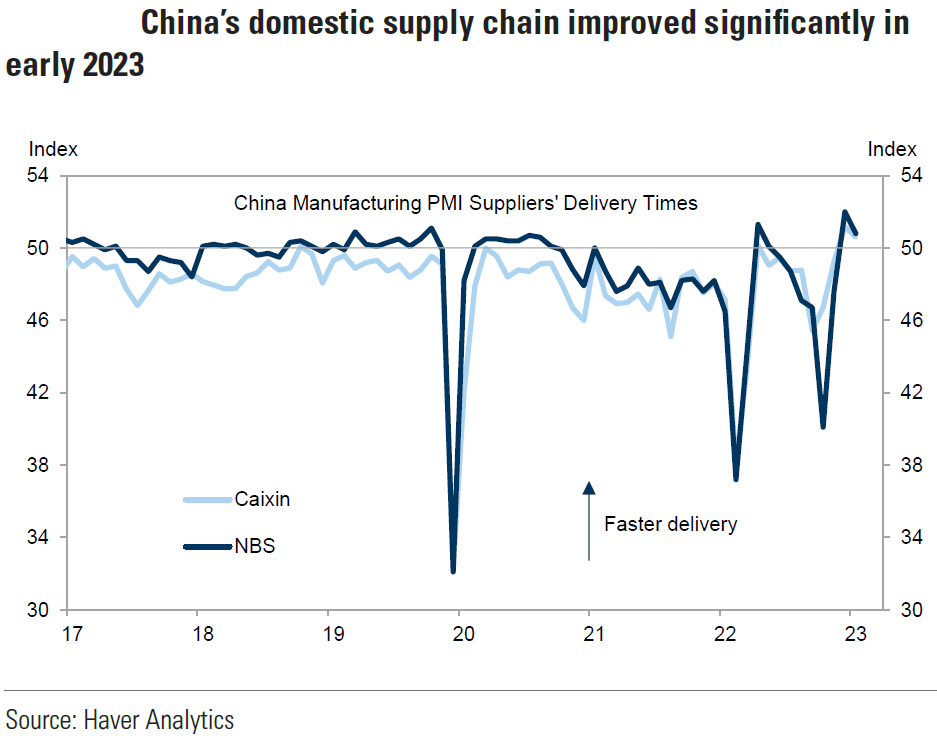
China’s March exports rose 14.8% y/y in U.S. Dollar (USD) terms for the first time in six months versus expectations of a 7.1% decrease and versus a decrease of 6.8% y/y in the January-February period. This was the biggest divergence from expectations since at least 2018. Imports were 1.4% y/y lower versus an expected drop of 6.4%. On a sequential monthly basis, exports rose 8.0% versus an increase of 6.7% in the January-February period, and imports rose 3.8% versus an increase of 1.4% in January-February. It appears that the easing of global and domestic supply chain issues played a significant role in these large gains. We suspect that there was also near-term built-up demand that exacerbated these gains when that demand could finally be met better due to easing of supply chain constraints. Many analysts have raised now their estimates for Q1 China GDP growth rates. Goldman raised their Q1 GDP growth estimate to over 10% annualized and 6% for all of 2023. Exports were broad based across both developed countries and emerging markets (EM), including the U.S., Europe and major EM economies, such as Latin America and Africa. On April 13, JPM broke down the exports by product group: “exports of lower-end consumer goods (including garments, clothing, footwear and toys) jumped 37.5% m/m sa [seasonally adjusted] in March (growing 47.8% 3m/3m saar[seasonally adjusted annual rate]). Besides, exports of mechanical and electrical products also showed strong growth at 10.8% m/m sa in march (growing 45.0% 3m/3m saar). In addition, exports of autos rose notably by 11.5% m/m sa (or 57.1% 3m/3m saar).” We continue to expect “rapidity of change” to surprise. In our opinion, there is very little that is “linear” about the current economic growth and inflation patterns. “Bumpy” and rather unpredictable patterns should be expected. We believe that we are in an environment where “you never can tell” on month-to-month patterns. At best, we hope to understand and forecast the general directions of economic growth and inflation patterns. We certainly did not expect these very robust export growth rates given the worse-than-expected March manufacturing PMIs of China discussed in last week’s commentary. To support further a continuing growth trajectory for China, China’s new credit rose in March to the highest seasonally adjusted monthly level ever. Another positive development in March was that medium-to-long-term new borrowing increased for households – mostly mortgages – and corporates.
Source: Goldman Sachs, China Economic Activity and Policy Tracker: April 13 (4-14-2023)
Source: Goldman Sachs, China: Trade growth surprised sharply to the upside in March (4-13-2023)
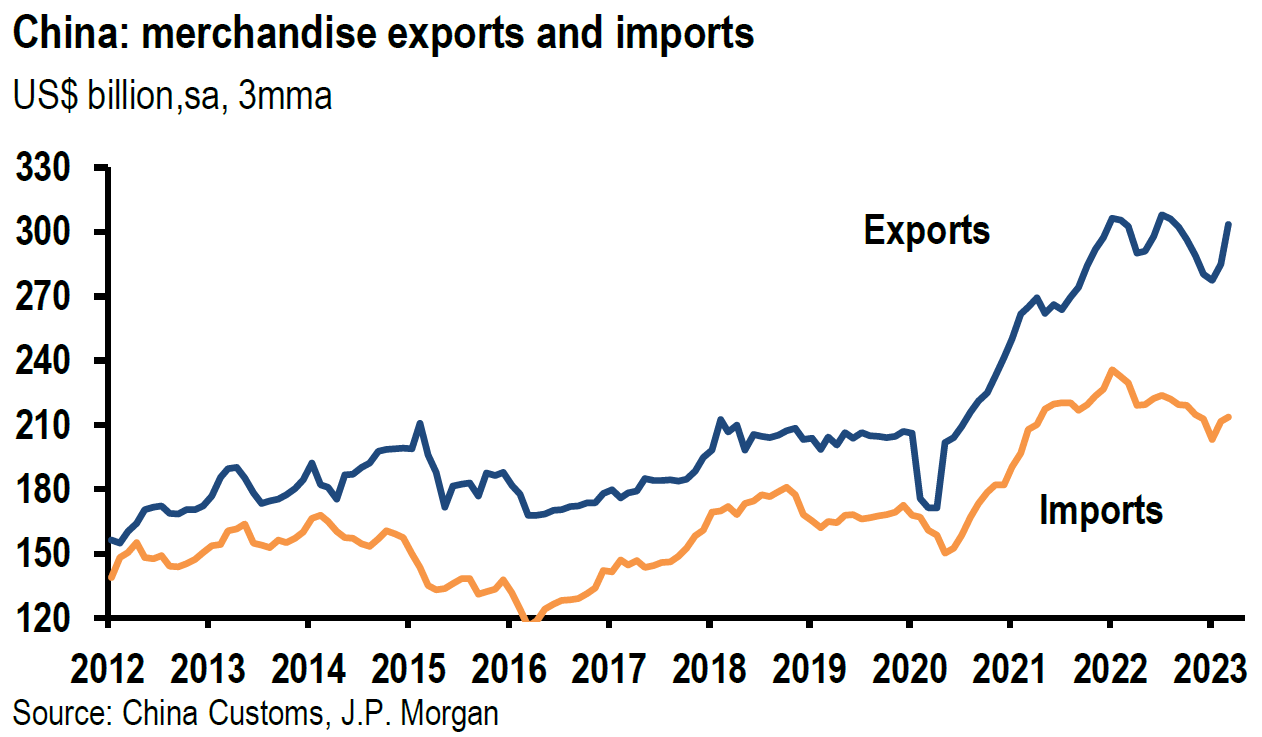
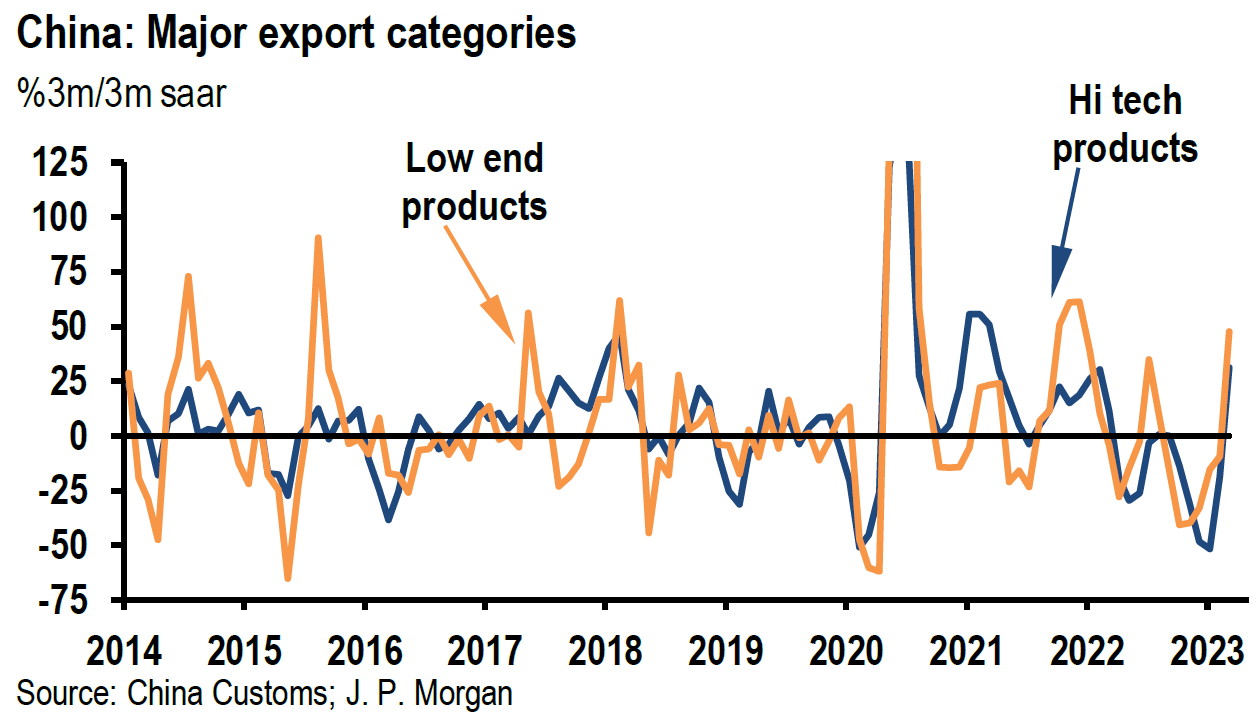
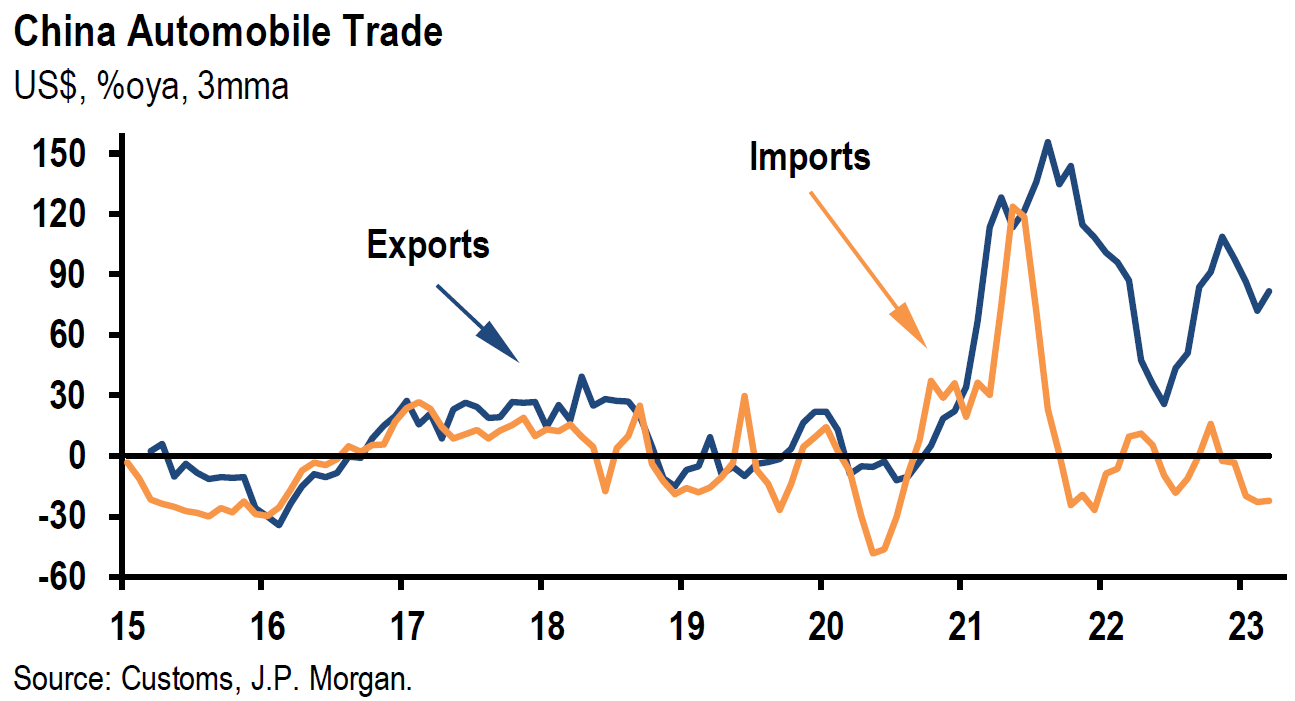
Source: JP Morgan, China (4-13-2023)
U.S. March Retail Sales Fall More than Expected
Retail sales declined 1.0% m/m versus an expected drop of 0.4% and compared to an upwardly revised drop of 0.2% in February. Excluding autos and gasoline, sales declined 0.3% m/m. The so-called core retail sales, which excludes autos, gasoline, building materials and food services and approximate more closely with the consumer spending part of GDP, was also 0.3% lower, which was better than expected. Core retail sales for February was 0.5% higher m/m. Online sales were 1.9% higher m/m and sales at restaurants and bars rose 0.1% m/m. We interpret this data as showing a slowing momentum in household spending. Bank of America data released this week showed a deceleration of credit and debt usage for March that was the weakest in two years.
University of Michigan Consumer Sentiment – April (Preliminary) Better than Expected
Consumer sentiment in the U.S. unexpectedly rose to 63.5 in April from 62 in March, which was also the expected level for April. Current conditions increased to 68.6 from 66.3 in March and expectations increased to 60.3 from 59.2. “Rising sentiment for lower income consumers was offset by declines among those with higher incomes.” Much to our surprise, year ahead inflation expectations rose to 4.6% in April from 3.6% in March. These expectations have been fluctuating between increases and decreases over the past four months. Uncertainty about the short term has remained elevated relative to more long-term inflation expectations. Long run inflation expectations remain well anchored as they showed an inflation expectation of 2.9% for the fifth consecutive month. We were surprised similarly by the rise in one year ahead inflation expectations in the latest New York Fed survey. Given our analysis of the most recent inflation data we have analyzed, we expected a more stable set of short-term expectations. Presumably, consumers’ short term inflation expectations reflect uncertainties just as bond market volatility has reflected uncertainties in regard to economic growth and inflation.
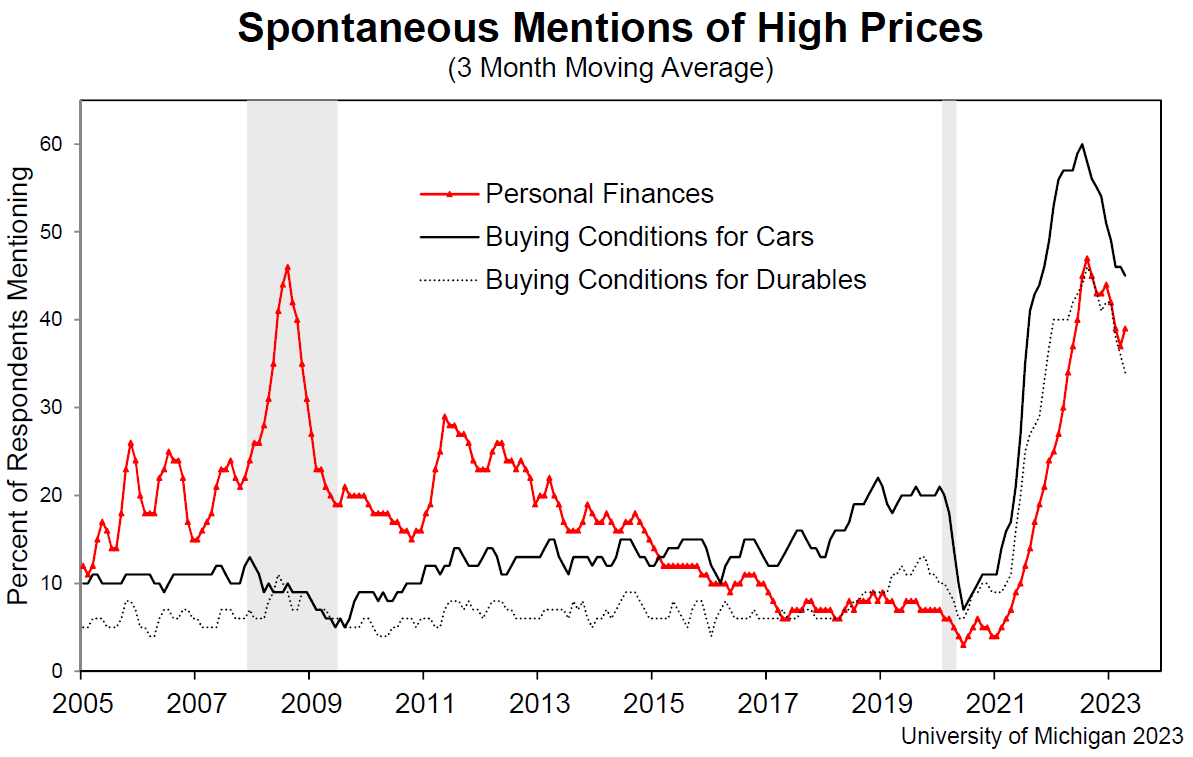
Source: University of Michigan 2023 (April 2023)
U.S. March Import and Export Prices Decline
Import prices declined 0.6% m/m versus an expected decline of -0.1% and compared to an upwardly revised increase of 0.2%in February. This was the largest monthly decline since November 2022. Import prices declined by -4.6% y/y versus an annual decline of -1.0% in February. This was the largest annual decline since a decline of -6.3% in May 2020. U.S. export prices were lower -0.3% m/m versus an expected -0.1% decline. This was the first monthly decline since December 2022. February was revised higher to a positive 0.4%. Export prices declined 4.8% y/y, which was the biggest annual decline since -67% drop in both May 2019 and May 2020. We will monitor these numbers closely to determine if this could develop into a more sustainable deflationary trend.
Bottom Line
For the time being we are maintaining our basic investment approach as expressed in last week’s commentary. We continue to prefer high quality stocks that offer good balance sheets, as well as relatively stable cash flows and profit margins. We prefer a global diversified portfolio for long term investors. We continue to stress that stock selectivity in this current environment is of paramount importance. We forecast continued financial markets volatility.
We continue to remain concerned that there could be more disruptions stemming from issues relating to smaller regional banks. Hopefully we will develop a clearer picture of credit availability as regional banks report their earnings, reserve allowances and their proclivity to lend.
We found it striking that uncertainties surrounding consumers’ year ahead expectations appear to sometimes mirror fixed income volatility even while their longer term expectations remain well anchored generally.
We expect the Fed to hike the federal funds rate by 25 bps at its next meeting and then “pause” for quite “some time.”

Definitions:
Federal Open Market Committee (FOMC) – The Federal Open Market Committee (FOMC) is the branch of the Federal Reserve System that determines the direction of monetary policy specifically by directing open market operations. The committee is made up of 12 members: the seven members of the Board of Governors; the president of the Federal Reserve Bank of New York; and four of the remaining 11 Reserve Bank presidents on a rotating basis.
Basis Points (bps) – A basis point is one hundredth of one percent, used chiefly in expressing differences of interest rates.
Inverted Yield Curve – An inverted yield curve describes the unusual drop of yields on longer-term debt below yields on short-term debt of the same credit quality. Sometimes referred to as a negative yield curve, the inverted curve has proven in the past to be a relatively reliable lead indicator of a recession.
Headline Consumer Price Index (Headline CPI) – Headline inflation is the raw inflation figure reported through the Consumer Price Index (CPI) that is released monthly by the Bureau of Labor Statistics (BLS). The CPI calculates the cost to purchase a fixed basket of goods to determine how much inflation is occurring in the broad economy. The CPI uses a base year and indexes the current year’s prices, according to the base year’s values.
Core Consumer Price Index (Core CPI) – Core inflation removes the CPI components that can exhibit large amounts of volatility from month to month, which can cause unwanted distortion to the headline figure. The most commonly removed factors are those relating to the costs of food and energy. Food prices can be affected by factors outside of those attributed to the economy, such as environmental shifts that cause issues in the growth of crops. Energy costs, such as oil production, can be affected by forces outside of traditional supply and demand, such as political dissent.
Producer Price Index (PPI) – The producer price index (PPI), published by the Bureau of Labor Statistics (BLS), is a group of indexes that calculates and represents the average movement in selling prices from domestic production over time. It is a measure of inflation based on input costs to producers.
Core Producer Price Index (PPI) – The core producer price index (PPI), published by the Bureau of Labor Statistics (BLS), is a group of indexes that calculates and represents the average movement in selling prices from domestic production over time that excludes food and energy prices, which are the more volatile parts of inflation.
Retail Sales – Retail sales represent a key macroeconomic metric that tracks consumer demand for finished goods. It acts as a key economic barometer and whether inflationary pressures exist. Retail sales are measured by durable and non-durable goods purchased over a defined period of time.
CME FedWatch Tool – This tool acts as a barometer for the market’s expectation of potential changes to the fed funds target rate while assessing potential Fed movements around FOMC meetings.
NFIB Small Business Optimism Index – The Small Business Optimism Index is a composite of ten seasonally adjusted components. It provides an indication of the health of small businesses in the U.S., which account of roughly 50% of the nation’s private workforce.
Nasdaq 100 (NDX) – The Nasdaq-100 is a stock market index made up of 101 equity securities issued by 100 of the largest non-financial companies listed on the Nasdaq stock exchange. It is a modified capitalization-weighted index.
Initial Unemployment Insurance Claims – Initial claims are new jobless claims filed by U.S. workers seeking unemployment compensation, included in the unemployment insurance weekly claims report.
Continuing Claims – Continuing claims track the number of U.S. residents filing for ongoing unemployment benefits in a given week. Continuing claims measure ongoing unemployment benefits, which is in contrast to initial claims, which track new filings for benefits.
IMPORTANT DISCLOSURES
The views and opinions included in these materials belong to their author and do not necessarily reflect the views and opinions of NewEdge Capital Group, LLC.
This information is general in nature and has been prepared solely for informational and educational purposes and does not constitute an offer or a recommendation to buy or sell any particular security or to adopt any specific investment strategy.
NewEdge and its affiliates do not render advice on legal, tax and/or tax accounting matters. You should consult your personal tax and/or legal advisor to learn about any potential tax or other implications that may result from acting on a particular recommendation.
The trademarks and service marks contained herein are the property of their respective owners. Unless otherwise specifically indicated, all information with respect to any third party not affiliated with NewEdge has been provided by, and is the sole responsibility of, such third party and has not been independently verified by NewEdge, its affiliates or any other independent third party. No representation is given with respect to its accuracy or completeness, and such information and opinions may change without notice.
Investing involves risk, including possible loss of principal. Past performance is no guarantee of future results.
Any forward-looking statements or forecasts are based on assumptions and actual results are expected to vary from any such statements or forecasts. No assurance can be given that investment objectives or target returns will be achieved. Future returns may be higher or lower than the estimates presented herein.
An investment cannot be made directly in an index. Indices are unmanaged and have no fees or expenses. You can obtain information about many indices online at a variety of sources including: https://www.sec.gov/fast-answers/answersindiceshtm.html or http://www.nasdaq.com/reference/index-descriptions.aspx.
All data is subject to change without notice.
© 2024 NewEdge Capital Group, LLC


