


Our Process & Performance
Three years ago, we published our initial whitepaper Quality Focused Investing at NewEdge Wealth. This was our deep dive into the merits of owning high-quality businesses for long-term investors and it explored the foundation for our quality equity portfolios, which sit within NewEdge Investment Solutions (“NEIS”). These portfolios are powered by the collective efforts of the NewEdge Investment Team, leveraging our robust investment resources and employing a multi-disciplinary approach that combines fundamental, quantitative, technical, and macro-economic analysis. While our investment team and managed assets have grown over the years, our core principle of prioritizing quality within equity markets has remained constant, and in our view this approach continues to offer many structural advantages for our clients. These advantages include harnessing the power of compounding and time in the market (as opposed to trying to time the market), capturing structural alpha through more consistent and fundamentally driven growth, achieving enhanced downside protection, and generating greater tax efficiency through lower turnover.
Our initial paper illustrated the long-term benefits of quality focused investing and was grounded in analysis and conclusions informed by quantitative studies and historical index-level performance. It has always been our goal to produce a sequel, evaluating our realized results since inception and further exploring this topic with updated insights and more granular analysis. Having recently established our 5-year composite performance track record, we are excited to once again revisit the topic of Quality Investing – going deeper into the subject and offering a closer look into our investment process, which has been instrumental to the success of our equity portfolios. Ultimately, our goal is for our readers and investors to get a better sense of how we identify quality, how we build and manage portfolios that continuously prioritize this market factor, and how our disciplined process allows us to deliver ongoing value for our investors.
Summary & Key Takeaways:
- The quality anomaly, in our view, remains a fascinating market inefficiency and a source of persistent alpha, providing long-term investors with the opportunity for above-average compound growth through market cycles with reduced volatility.
- This anomaly is driven by a combination of structural factors, including common behavioral biases among investors (who are largely short-term oriented), index construction (which rewards capitalization over consistent profit generation), and a general under appreciation for durable growth and resilient business moats (attributes that can provide insulation from economic cycles, industry cross currents, and ultimately support more consistent shareholder value creation)
- Quality as an investment strategy continues to gain traction, evidenced by the growth of assets within the category and growth of investment vehicles that provide some degree of exposure to this factor. While performance varies widely for this group of vehicles, due to the various ways to define and gain exposure to “quality”, in our view this still nascent but growing adoption validates the structural advantages of quality investing that we have outlined.
- Quality companies can provide more durable long-term value creation – the result of sustained competitive advantages, and a powerful profit-generating flywheel driven by efficient capital allocation, premium returns on capital, and healthy free cash flow generation.
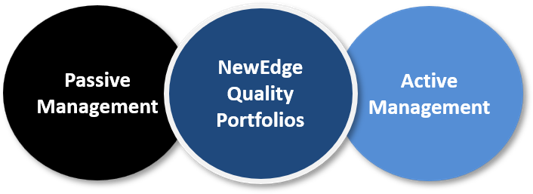
- We believe our portfolios sit at the intersection of active and passive management which allows us to capitalize on the advantages of each style while minimizing some of the drawbacks. Ultimately, we utilize a tax-efficient and rules-based framework (common in passive vehicles) and combine this with active security selection to effectively manage risk and generate more consistent alpha.
- In our view, effective security selection has been key to our long-term success. We utilize a quantitative screening methodology, which is designed to filter for companies with industry leading fundamentals, and combine this with a rigorous qualitative analysis of business characteristics and industry dynamics. Ultimately, it is this process, which is grounded in data and enhanced by judgement, that we believe has allowed us to deliver substantial results for our clients.
- We believe our results thus far illustrate the value of our approach. On average, and net of all fees since inception, our NewEdge (“NEIS”) Quality Portfolios have generated positive annualized alpha, above average risk-adjusted returns, below market betas, and positively skewed upside and downside capture ratios.
- While we are encouraged by our results thus far, we recognize that not all environments are ideal for our style of investing. Our rules-based framework can prevent us from owning certain companies, and sentiment, positioning, and short-term speculative behavior can, at times, be powerful market drivers. While this can lead to variations in our performance relative to broad indices in short-term windows, we continue to view the quality factor as an effective way to generate long-term compound growth.
- Looking ahead, we believe our portfolios remain well positioned to continue to deliver value for our clients as the market cycle matures. Equity markets have produced above average returns for several years now, the bull market is aging, and we are entering an environment in which, over the next five years, earnings growth may become a more critical market driver – an environment that may further illustrate the long-term benefits of quality-focused investing.
NewEdge Quality Equity Portfolios – Highlights of our Historical Performance
As Theodore Roosevelt famously said, “The more you know about the past, the better prepared you are for the future”. This statement certainly aligns with our data-driven approach and while we recognize that the last five years have been a relatively brief window, we wanted to begin with the historical results of our NewEdge Portfolios over this period, which coincides with our composite inception (3/31/21 – 3/31/26).
We currently manage four core equity portfolios covering nearly all global equity market segments and a universe of more than 5,000 investable public companies. This includes our Quality Growth – Large Cap Growth, Quality Dividend – U.S. Large Cap Value, Quality Small/Mid – U.S. Small and Mid-Caps, and International Quality – Foreign Developed and Emerging Markets. We also manage blended portfolios that incorporate these underlying strategies into a single unified account structure, like our hybrid 50% Quality Growth / 50% Quality Dividend blend which is indexed to the S&P 500.
NewEdge U.S. Large Cap Quality Hybrid – 50% Quality Growth / 50% Quality Dividend with Semiannual Rebalancing – Performance Since Inception
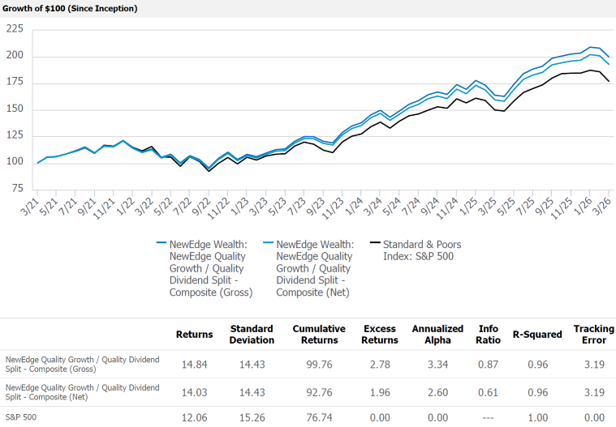
Source: eVestment, NewEdge Wealth, data from 3/31/21 – 3/31/26. Net performance includes advisory and management fees.
As the data above illustrates, we have produced solid results over the past five years, and below we highlight several key areas that particularly stand out. All data is net of management and advisory fees as of 3/31/26.
- Alpha Generation: All four NEIS quality equity portfolios have generated positive alpha since inception, averaging 4.3% annually, primarily driven by security selection and effective risk management.
- Consistency: All four portfolios have maintained below index betas, averaging 0.86 since inception, and above average information ratios, averaging 0.55 since inception. Information ratio measures the consistency of our excess returns, and combined, these metrics suggest a tendency towards more stable returns and consistent performance relative to peers.
- Risk Management: Our portfolios have generated average upside capture of 95% and average downside capture of 81% since inception, illustrating our ability to participate in strong markets and protect capital in adverse markets.
- Top Quartile Rankings: All four portfolios have delivered performance that ranks in the top quartile of their respective peer groups (comprised of several hundred active managers). Our Quality Dividend Portfolio, for example, ranks in the top 2% of Large Cap Value Managers over the past five years.
- Compound Growth: Over the past five years, our flagship Quality Growth and Quality Dividend Portfolios have produced average cumulative net returns of 93%, an excess of 1,600 basis points relative to the S&P 500 Index over the same time period.
- Tax Efficiency: One of the primary goals has been delivering efficient after-tax returns for our investors. Based on available data, we believe both our average turnover and average realized gains per year for each of our portfolios are competitive when compared to industry averages.
The Advantages of Quality – A Refresher on our Initial Whitepaper
We began our first whitepaper with the popular quote, often attributed to Warren Buffett, that “It is far better to buy a wonderful company at a reasonable price than a reasonable company at a wonderful price.” Looking back years later, we continue to believe in this philosophy and would argue that it has been validated by our experiences and our results.
As we highlighted in our initial report, “quality” can have a wide range of interpretations and lead to a wide range of investor conclusions and outcomes, but the idea of prioritizing great companies at fair valuations, as opposed to fair companies at great valuations, while also capitalizing on the more consistent compound growth these companies can provide, is, however, largely consistent across the quality investing landscape. While the definition of a great company is open to interpretation, in our view great companies are those that can consistently deliver fundamental shareholder value creation (or earnings growth) for their investors.
Quality investing is a perpetual strategy, one that can evolve with market cycles and, for NewEdge, remains centered on businesses with durable earnings growth. It is an approach that allows long-term investors to continuously participate in the compound growth of equity markets while maintaining a degree of insulation from economic, earnings, and overall market volatility. These attributes, in our view, are largely why quality companies can be an ideal core equity allocation for many investors, eliminating the need to time markets and cycles and instead capitalizing on the power of time in the market.
The Power of Compounding
While focusing on time in the market and maintaining broad equity market exposure sounds similar to passive investing, where quality investing differs, and partly why we think it continues to gain adoption, is in the composition of this exposure. Instead of having pure beta or total exposure to broad markets, quality investing offers beta to a subset of companies that are adept at delivering more consistent earnings growth and long-term shareholder value creation.
Historically, anywhere from 10-30% of the companies in broad equity markets do not produce positive earnings. While in the short term this lack of profits may not seem important, ultimately it can act as a drag on returns over longer horizons given earnings drive over 90% of long-term market performance. As a result, we believe that being more surgical in the implementation of equity market exposure and prioritizing profitable companies can both improve the odds of long-term success and provide a smoother return profile in a historically volatile asset class.
MSCI Quality vs. MSCI Cap Weighted Index EPS Growth
As the following charts indicate, historically, the higher quality cohort of companies has produced more consistent earnings growth across cycles. Combined with the power of compounding, this has resulted in premium cumulative earnings relative to the traditional cap-weighted index.
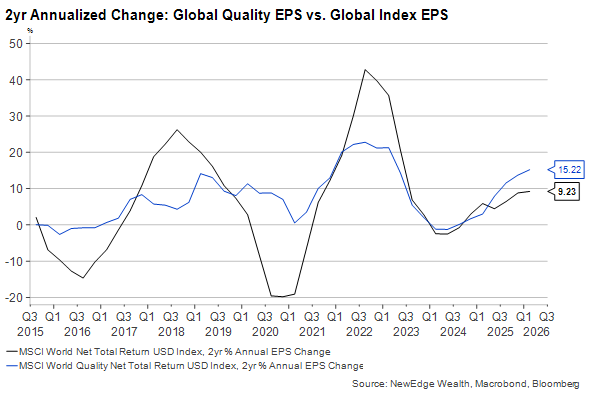
Data as of 3/31/26
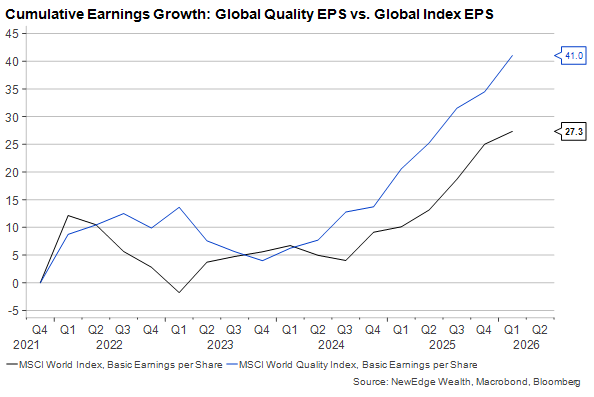
Data as of 3/31/26
One study from GMO Research found that historically higher quality companies have outperformed their lower quality counterparts over the past three decades by 4% annually with a third less volatility. Our analysis of the MSCI World Quality Index and the MSCI World Index provides evidence to this point as over the past twenty years (ended 3/31/26) the MSCI World Quality has outperformed its cap-weighted counterpart by 2.6% annually, while also outperforming in 85% of rolling 10-year periods since 1998. This compelling return profile is a great starting point, but ultimately it is just one of the many benefits that are afforded by quality investing.
A byproduct of the lower volatility often exhibited by the higher quality segment is that it can mitigate the emotional discomfort and detrimental reactions that can often arise from turbulent market environments, decisions like selling at the bottom or spending long periods out of the market. An emphasis on quality (and the core earnings drivers of a business) also helps minimize the noise that surrounds many companies in the short-term, where narratives and sentiment can lead share price to substantially deviate from the underlying intrinsic value of a company.
Lastly, an emphasis on quality and compound earnings growth requires a more patient and disciplined approach. This helps investors maintain a long-term investment mindset, reducing turnover and taxable gains, which can be an additional drag on long-term results. As we have seen and experienced over the years, while quality companies don’t outperform in all environments, we believe quality continues to offer structural advantages to long-term investors that make this style and cohort of companies an important component of any asset allocation.
Why the Quality Anomaly Exists
Ultimately, investing in equities requires taking added risk in exchange for potentially higher returns. One way to mitigate some of this risk is by maintaining a long-term strategy, accepting that equity markets are positively biased over the long run and that the probability of loss is inversely correlated to your time horizon (meaning the longer you stay invested, the lower the likelihood that you will experience an absolute loss from your starting point). Equity risk can be further reduced by applying fundamental filters – focusing on companies with resilient profitability and strong balance sheets, for example – which can make it easier for a company to navigate economic and interest rate turbulence.
Despite this evidence, equity market investors generally underutilize these fundamental tools. Instead, many investors gravitate towards companies with exciting secular narratives, focusing on near-term results and the mere potential of profitability instead of proven profitability. In addition, while passive investors may have a long investment horizon, passive vehicles essentially reward recent performance and momentum, providing exposure to an entire market and weighting companies by their capitalization, regardless of underlying earnings growth or fundamental characteristics. Broadly, this combination of index structure and behavioral bias from investors often causes more durable, less exciting companies to be overlooked and underappreciated relative to their long-term earnings power. Ultimately, a combination that creates persistent opportunities for longer-term, fundamentally oriented investors or what we call the quality anomaly.
What Makes a Quality Company – The Recipe for Long-term Success
As we noted, there is no shortage of available investment vehicles today aimed at providing exposure to quality factor or high-quality companies within various market segments. While there are a wide range of definitions of quality (and performance) among these strategies, they tend to prioritize similar fundamental metrics that can allow for more durable compound earnings growth. This includes filtering broad indices based on metrics like free cash flow generation, returns on capital, balance sheet strength, and earnings accruals (the deviation between reported earnings and free cash flow which can hint at underlying stress or less durable growth). Historical evidence confirms the efficacy of these metrics in quality security selection, although there remains nuance in their application and long-term value. While we evaluate similar metrics at NewEdge, we believe understanding these nuances is critical. Focusing solely on companies with the highest free cash flow yield (FCF as a percentage of market capitalization) for example, can result in a portfolio overly indexed to mature industries and businesses, and names where “quality” is driven more by a discounted valuation and could be masking a distressed business.
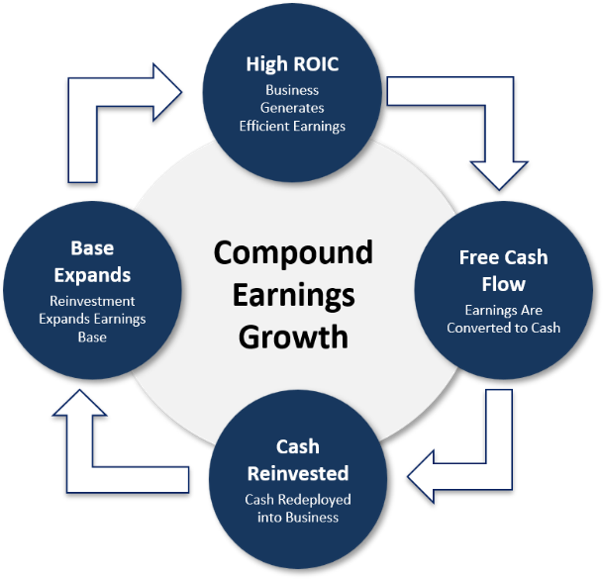
As part of our security selection process, we utilize a wide range of fundamental metrics – leveraging data, comparative rankings, and support from our partners at Empirical Research – to continuously filter higher and lower quality companies from a universe that includes 26 separate industry groups and nearly 5,000 companies around the world. While the quantitative screening process is driven by dozens of fundamental metrics, two of the most important are free cash flow generation and capital efficiency (measured by returns on capital). Individually, these metrics are illustrative of the health of a business and have been well correlated to long-term performance, evidenced by the fact that over the past 20 years, companies in the highest quintile of Return on Invested Capital “ROIC” and highest quintile of Free Cash Flow Margin have outperformed companies in the lowest quintile by more than five percent annually1. When combined, however, these metrics can reveal a business with a powerful compounding engine, where capital is efficiently turned into profits, the majority of those profits are converted to cash flow, and that cash flow is reinvested to expand the base of a business and ultimately generate more profits, which is the primary driver of long-term value creation.
An automotive analogy can be a helpful way to understand these concepts: if a business was a car, return on capital can be thought of as the engine, and high returns on capital would indicate horsepower, efficiency, and durability, all of which can help a business or car navigate a wide range of environments. In addition, consistently high returns on capital are typically evidence of inherent competitive advantages, such as economies of scale, pricing power, or access to unique resources and technology, all attributes that can provide defense against competition and support sustained industry dominance.
Free cash flow is the lifeblood of a business and can be thought of as the fuel for a car that allows the engine to generate optimal performance. Companies that produce substantial free cash flow are often operationally efficient, disciplined capital allocators, and they tend to have more flexibility in pursuing strategic initiatives to unlock shareholder value. Lastly, free cash flow and the liquidity it provides can allow a company to be less reliant on debt and equity market financing, providing insulation from capital markets’ turbulence and unexpected changes in economic cycles.
Filtering companies at the industry group level is a key differentiator of our process as well. We recognize that capital intensity varies across industries and maintaining diversification across groups is a valuable risk management tool. Overall, we believe focusing on industry leaders with premium returns on capital and healthy free cash flow generation can provide a steady foundation for investors looking to identify a quality business and an earnings flywheel.
At NewEdge we take this screening process a step further, focusing on the stability of these and many other fundamental data points, evaluating the historical variability of these metrics to help identify companies with the most durable earnings power across market cycles. It is important to note, however, that total free cash flow can vary depending on reinvestment rates (how much free cash flow is invested back into a business), as well as the opportunities for future return on invested capital. In addition, we also recognize that a drawback of this approach is the potential to initially underestimate companies with historically volatile but accelerating profitability and capital efficiency, often evident in earlier stage companies or those experiencing cyclical upturn in demand. Both considerations make additional context and qualitative work an essential addition to our quantitative screening process.
One final piece of our screening process is a focus on valuation, an aspect that in our view is overlooked and less utilized by our peers. Quality investors and value investors, while fundamentally oriented, tend to share less in common than one would expect. Value investors emphasize companies trading at meaningful discounts to measures of estimated intrinsic value. Quality investors on the other hand look at valuation as evidence of the competitive advantages and long-term earnings power of a business, sometimes accepting that a premium valuation for a business, like a luxury good or collectible, is worth paying up for.
At NewEdge we recognize that not all quality is created equal and wide valuation ranges for high-quality businesses are common. However, we believe it is vital to maintain a valuation discipline as a margin of safety. Lofty valuations can indicate high expectations and crowded consensus views, both of which can bring risks of disappointment and rapid rerating. At the same time, while cheap valuations may suggest a compelling risk/return profile, they can also indicate long-term structural concerns lay behind otherwise healthy near-term fundamental results. We believe it is important to assign context to the valuation of a business and assess current valuation relative to peers and relative to history to provide an added margin of safety. This is an area where judgement, a deep understanding of industry dynamics and competitive advantages, and the “why” a business is high or low quality can add meaningful value and reduce the risk of loss from multiple compression.
Continuously Prioritizing Quality – The NewEdge Portfolio Management Process
Having a deep understanding of what makes a quality company and a consistent screening process to identify these companies provides a solid foundation for our quality investing framework. Equally important, however, is our process for building and managing portfolios of quality companies, a process that ensures diversification across industry groups, provides effective risk management, and allows for continuous exposure to high-quality companies as market and business cycles evolve. In our view, having a clearly defined process in this area has allowed us to continue to scale and deliver more consistent results relative to peers.
The genesis for the NewEdge Quality Portfolios was the belief that we could build solutions that were optimized for the needs of our clients. Our well-rounded experience as advisors and allocators led to a deep appreciation for the structural advantages and flaws of both active and passive management, and we set out to build portfolios that could capitalize on the best of what each investing style has to offer.
We often describe our NewEdge portfolios as sitting at the intersection of active and passive management, and in our view, it is an intersection that continues to be both underserved and offers unique advantages for long-term investors. Our portfolios harness the efficient structure of passive investing, using a rules-based framework that prioritizes low turnover and low tracking error to produce more efficient long-term returns. We combine this structure with the benefits of active management and fundamental security selection, which include the potential for alpha generation and added risk management. It also frees us from being beholden to index constitution and the inherent flaw of owning an entire universe of companies regardless of their earnings power.
In addition to our strategic position at the intersection of the active and passive investment landscape, the north star for our NewEdge Quality Portfolios has always been efficiency. While we may not generate above average performance in all markets, we know there are certain variables we can control for, and efficiency is one crucial aspect.
When we talk about efficiency it is multi-faceted – a combination of return efficiency (providing more consistent returns, and reduced downside capture), tax efficiency (being sensitive to substantial gains and maintaining relatively low turnover), and fee efficiency (providing our strategies at fees that are on par with comparable passive vehicles and below industry peers). Combined, these variables, if not properly managed, can be substantial drags on long-term asset growth. In our view, our ability to be efficient in all three areas is another key distinction of our platform and contributor to our long-term results.
Having a clear picture of where our portfolios stand in the investment landscape and our goal of efficient compound growth informs our portfolio management process. However, just as important is our investment decision framework which allows us to deliver on this efficient compounding goal while continuously optimizing portfolios around the quality factor. At a minimum we believe our portfolios should maintain effective diversification, low tracking error, and reasonable position sizes, all of which can serve as risk management tools and help us deliver more consistent long-term growth and reduced downside capture.
We conduct regular optimizations for each of our portfolios and while we monitor positions daily, generally we rebalance monthly or ad hoc depending on market conditions. As part of these optimizations we review every holding and many potential additions from a wide range of perspectives, evaluating performance, as well as numerous fundamental, technical, macro, and company specific data points. This analysis leverages the combined intellectual power and resources of the NewEdge investment team, including our CIO views, our robust team of portfolio strategists and specialists, our NewEdge Investment Advisory Board, and our external network of leading independent and bulge bracket research firms. This rigorous analysis can be thought of as a decision tree, ultimately starting at the highest level, asking is this a high-quality business and is it performing, and subsequently drilling down into more granular analysis by evaluating the durability of a business, dissecting revenue contribution, industry headwinds and tailwinds, competitive positioning, sentiment, and significant idiosyncratic factors and events on the horizon that could impact quantitative metrics and fundamental drivers going forward.
In this second step, our investment team harnesses the power of quantitative data, applies judgement based on our expertise, experience, and our mosaic of investment resources. This is also where our team overlays real world and practical portfolio management oversight, accounting for variables that data can often overlook such as non-recurring items, management turnover, regulatory issues, revenue concentration, and idiosyncratic risks.
Ultimately, we know the recipe for a quality business – but having a deeper context and understanding of why a business may be high quality is just as important. This step, and our application of judgement, enhances the power of our data-driven approach, often helping to reduce some of the common issues found in quantitative investing: reliance on backward-looking data, excessive turnover, and potential value traps or anchoring biases – situations where data and the market may be telling two different stories.
Overall, our process remains grounded in data that is aimed at identifying underappreciated (or overappreciated) earnings power. This has clearly been an effective tool for security selection and risk management, evidenced by our above average hit rates on both additions and exits over the years. Our ability to leverage this data, contextualize it, and apply judgement at the implementation and portfolio management levels has further supported our long-term success and, ultimately, our ability to deliver on our north star of efficient compound growth.
The Results of Quality Investing at NewEdge Wealth
As we briefly illustrated earlier, over the past five years the NewEdge Quality Equity Portfolios have delivered solid results and have largely capitalized on many of the strategic advantages of the quality factor outlined in our initial whitepaper, notably consistent returns that match or exceed our indices with less overall volatility, positive alpha generation, solid performance relative to active peers, and efficient after-tax, after-fee compound growth. In addition, there are a handful of key performance metrics to specifically detail.
-
- Downside Protection: While the overall S&P 500 index has generated a healthy 12% annualized return over the last five years, this has not been achieved without downside volatility. Remarkably, if you had randomly invested on any day over this 5-year period, there was a 35% probability of, at some point, being down 10% or more from your initial entry point. While volatility is often the cost of being an equity investor, we have long said one of the key benefits of prioritizing the quality factor has been the ability to participate in equity markets with lower volatility and reduced downside capture. Quality companies are generally well built to produce more consistent earnings growth, and due to their free cash flow generation, strong balance sheets, and operational efficiency, these companies are able to navigate periods of economic, interest rate, and market volatility.
-
- Focusing on our flagship Quality Growth and Quality Dividend Portfolios over the past five years, below we illustrate how these portfolios have largely delivered on this structural advantage. Examining all index drawdowns that have exceeded 10% since inception of our strategies, both portfolios have produced 84% average downside capture. Importantly, this reduced downside capture has not required us to forgo upside participation, as our Growth Portfolio has produced net annualized returns of 12.1% and our Dividend Portfolio has produced net annualized return of 15.6%.
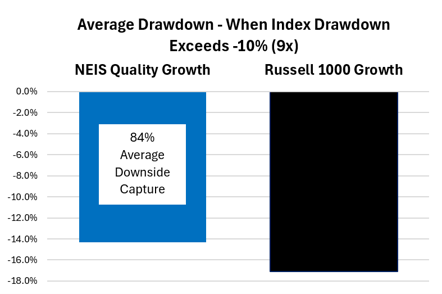
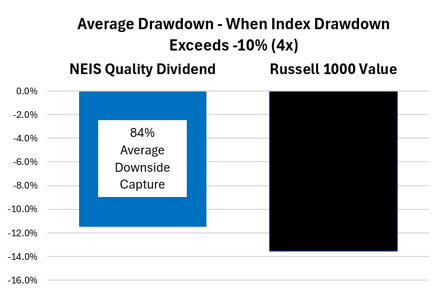
Source: Bloomberg, NewEdge Wealth, data from 3/31/21 – 3/31/26. Portfolio Performance is net of a 1% total annual fee, applied during the drawdown period.
- Risk Adjusted Performance (Alpha, Sharpe, Information Ratios): We acknowledge that investors can’t eat risk-adjusted performance. However, our ability to deliver above average results in each metric helps illustrate the value of our quality focused approach. All four of our strategies have delivered positive annualized alpha since inception, while both our sharpe ratios (return per unit of risk), and information ratios (excess return per unit of active risk, essentially the consistency of excess return), for each portfolio have registered well above industry averages.
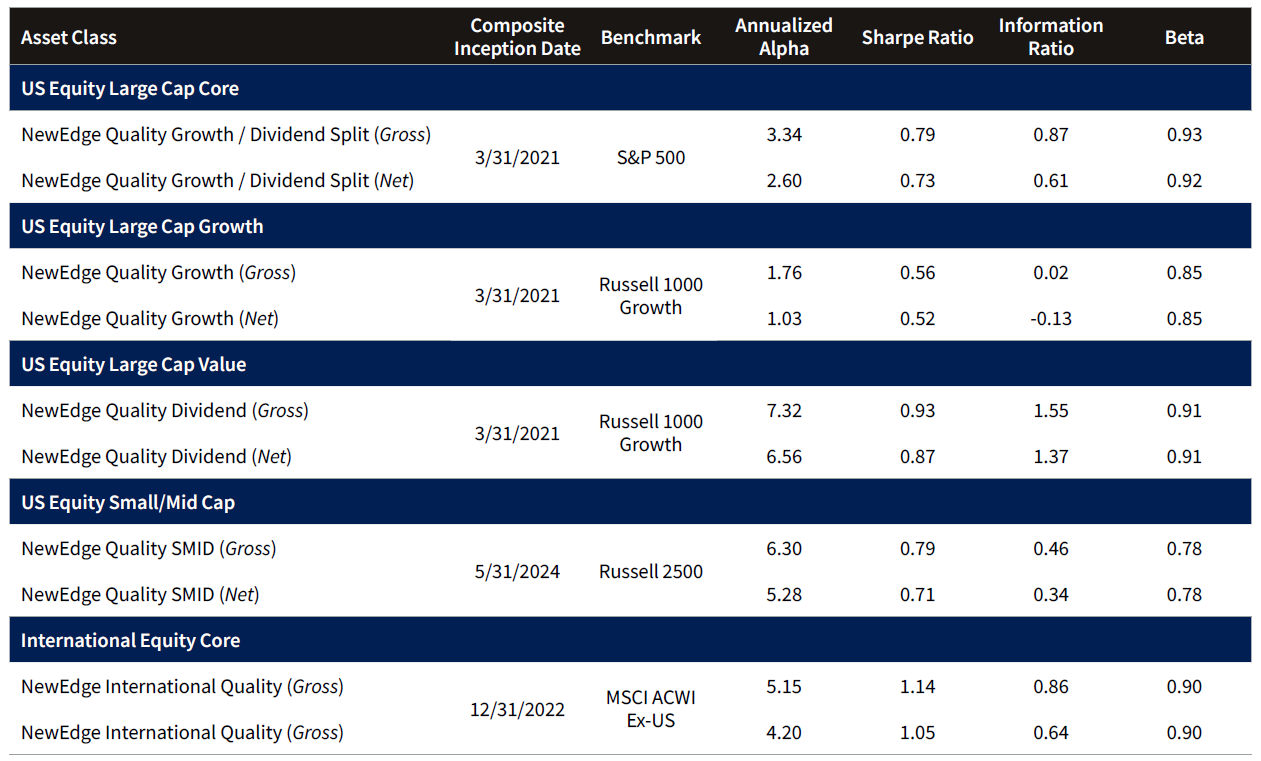
Source: eVestment, NewEdge Wealth, data from 3/31/21 – 3/31/26. Net performance includes advisory and management fees.
- Peer Group Comparisons: As we noted efficient compound growth remains our north star, however, we believe it is important to evaluate our overall performance relative to active managers in each category for our portfolios. Relative to our peers, our portfolios have produced top quartile rankings in both return and alpha generation, further illustrating the benefits of our process and overall quality-focused approach.
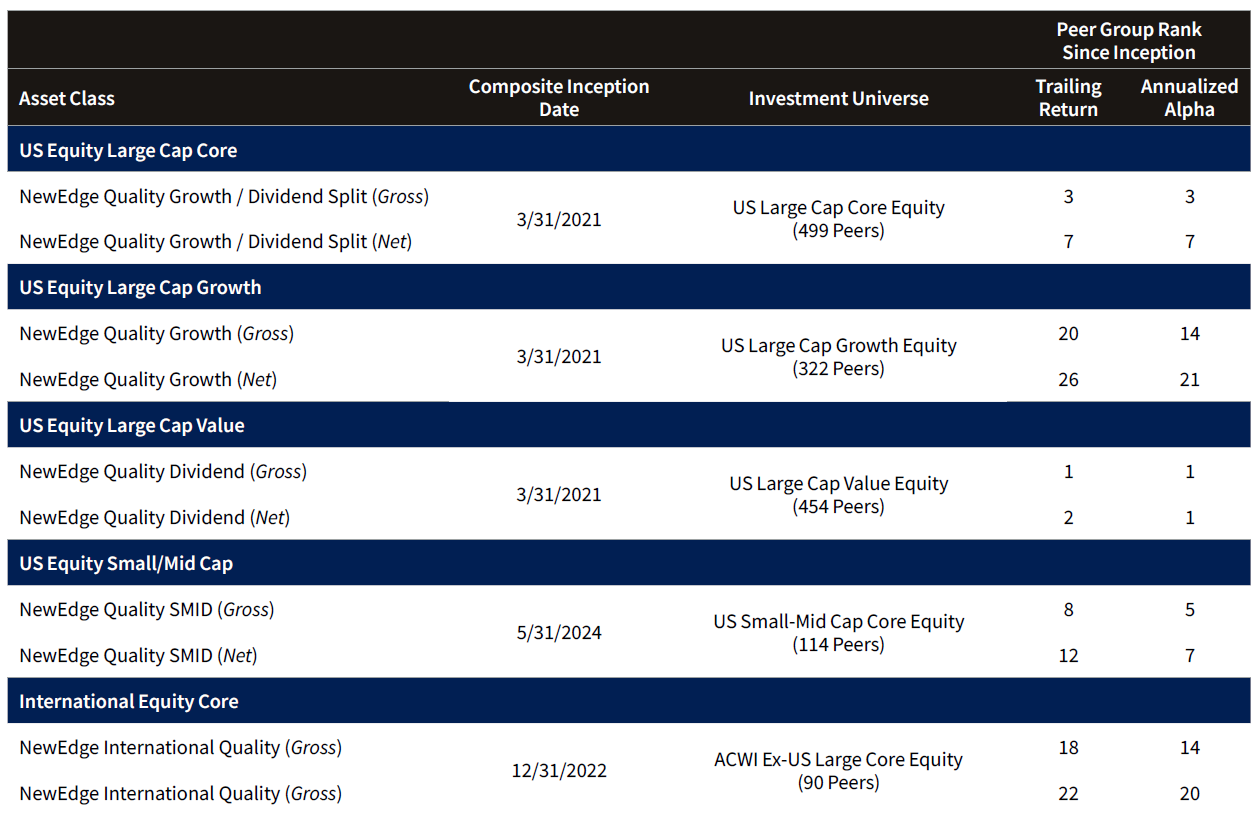
Source: eVestment, NewEdge Wealth, data from 3/31/21 – 3/31/26. Net performance includes advisory and management fees.
Looking Ahead – The Future of Quality Focused Investing
We are certainly encouraged by our results to date and are confident we can continue to deliver value to our clients, fueled by our ability to capitalize on the advantages of both active and passive management, our consistent and disciplined process, and our vast and expanding network of investment resources both within NewEdge and externally. However, we recognize that quality investing does not work in all environments and there will be periods when our performance may trail broad indices, circumstances that can result from index concentration, periods of ample liquidity, position crowding, lofty enthusiasm, and expectations from market participants.
We have experienced several of these more speculative-led environments over the past five years, and equity market performance thus far in 2026 has also exhibited some of these characteristics. Through May of this year, for example, the Goldman Sachs Index of non-profitable tech companies (a collection of fast-growing businesses that do not currently produce positive earnings) has returned 57%, dwarfing the 11% total return of the broader S&P 500 over this period. While this type of enthusiasm and risk appetite can reward highly tactical investors, taking a longer-term view illustrates the drawbacks of this approach, as from 3/31/21 through 5/31/26 this same group of non-profitable companies has returned just 1.4% annually, compared to the 15.0% return of the S&P 500.
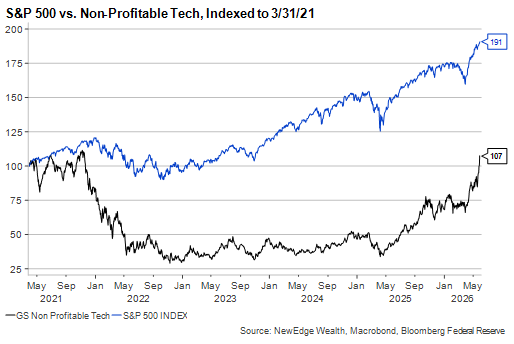
Data from 3/31/21 – 5/31/26.
Over the past five years, broad equity markets have produced cumulative and annualized returns that well exceed long-term averages, fueled by a robust combination of economic and earnings momentum, enthusiasm for the generational build out and adoption of AI products and services, and generally more supportive fiscal and monetary policies. It is certainly reasonable to expect a more balanced environment in the next five to ten years where equity markets generate returns that align with longer-term averages. In this environment, earnings growth is likely to be a more powerful market driver, and in our view, disciplined investors prioritizing more durable and profitable companies may be better positioned to achieve their long-term goals.
In closing, we continue to believe in the structural advantages of the quality factor for long-term equity market investors and believe high-quality businesses that offer more resilient earnings growth should continue to be a core piece of a diversified asset allocation. As our results have demonstrated, capitalizing on the quality anomaly and maintaining a disciplined process oriented around these businesses can ultimately provide a more comfortable investing experience and improve the odds of long-term success. We also continue to believe in the power of data and using history as a guide and framework for identifying great businesses. Leveraging this data, combining it with rigorous qualitative analysis and disciplined portfolio management, remains our foundation and leaves us well positioned to deliver on our mission of generating efficient compound growth. Owning quality companies may not always “beat the market”, but like a lighthouse in stormy seas, prioritizing these businesses can provide direction and stability when it is most needed and ultimately help produce better long-term outcomes.
SOURCES
1 Empirical Research as of 3/31/26
Important Disclosures
The views and opinions included in these materials belong to their author and do not necessarily reflect the views and opinions of NewEdge Capital Group, LLC.
This information is general in nature and has been prepared solely for informational and educational purposes and does not constitute an offer or a recommendation to buy or sell any particular security or to adopt any specific investment strategy.
NewEdge and its affiliates do not render advice on legal, tax and/or tax accounting matters. You should consult your personal tax and/or legal advisor to learn about any potential tax or other implications that may result from acting on a particular recommendation.
The trademarks and service marks contained herein are the property of their respective owners. Unless otherwise specifically indicated, all information with respect to any third party not affiliated with NewEdge has been provided by, and is the sole responsibility of, such third party and has not been independently verified by NewEdge, its affiliates or any other independent third party. No representation is given with respect to its accuracy or completeness, and such information and opinions may change without notice.
Investing involves risk, including possible loss of principal. Past performance is not a guarantee of future results.
Any forward-looking statements or forecasts are based on assumptions and actual results are expected to vary from any such statements or forecasts. No assurance can be given that investment objectives or target returns will be achieved. Future returns may be higher or lower than the estimates presented herein.
Indices referenced herein are unmanaged, do not reflect fees, expenses, or transaction costs, and are not available for direct investment. Index performance is shown for illustrative purposes only and does not represent the performance of any investment strategy or portfolio. You can obtain information about many indices online at a variety of sources including: https://www.sec.gov/answers/indices.htm
All data and information are presented as of the date of this publication and are subject to change without notice.
© 2026 NewEdge Capital Group, LLC
