
In 2008, during turbulent and terrifying times for markets, Warren Buffet wrote to investors: “Long ago, Ben Graham taught me that ‘Price is what you pay; value is what you get.’”
Oftentimes, prices diverge from value in meaningful ways. One source of these divergences can be emotion.
In a way, when the dominant emotion is euphoria and exuberance, prices trade far above value, and when the dominant emotion is distress and despondency, prices trade far below value.
In uncertain markets and economies, both price and value can change quickly. Price changes quickly as assets experience heightened volatility, but value can also change quickly as the visibility on current earnings and future growth becomes cloudy.
When both price and value change quickly, it can be difficult to determine how much of the current price is reflective of real value or emotion.
It is in this spirit of trying to remove as much of the emotion out of various price levels that we present the following charts and analysis for a dose of dispassion.
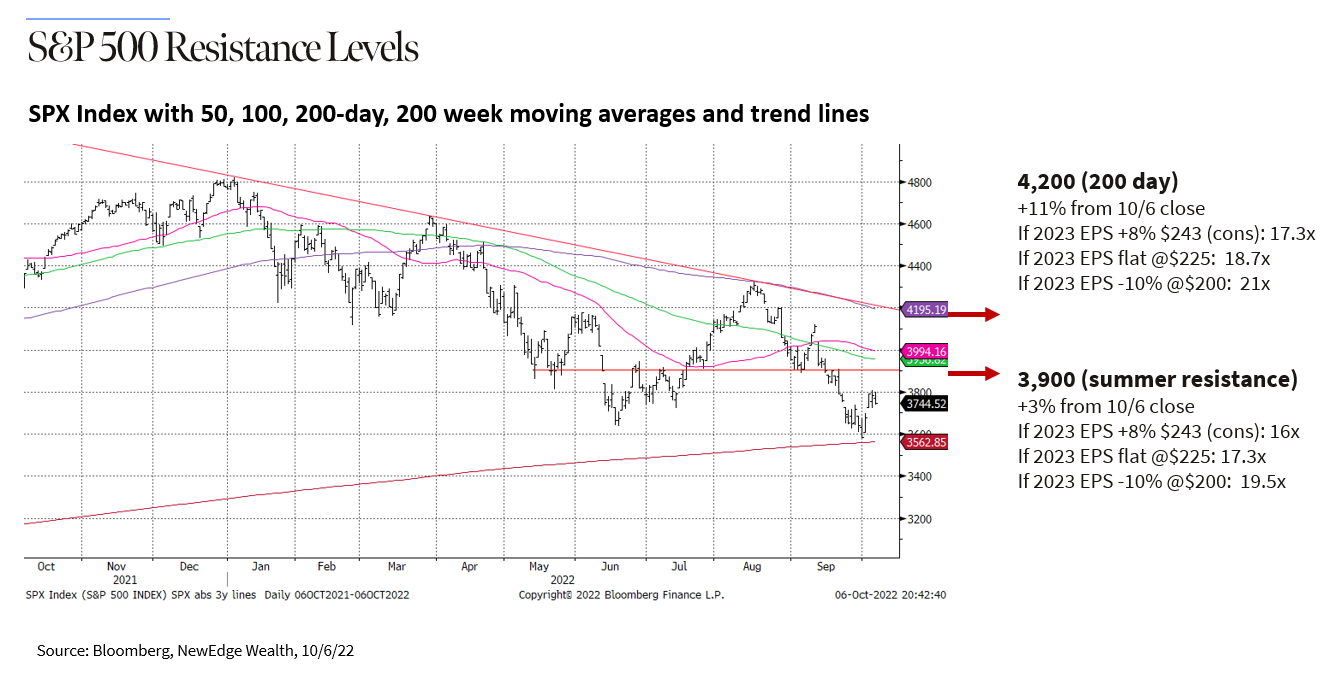
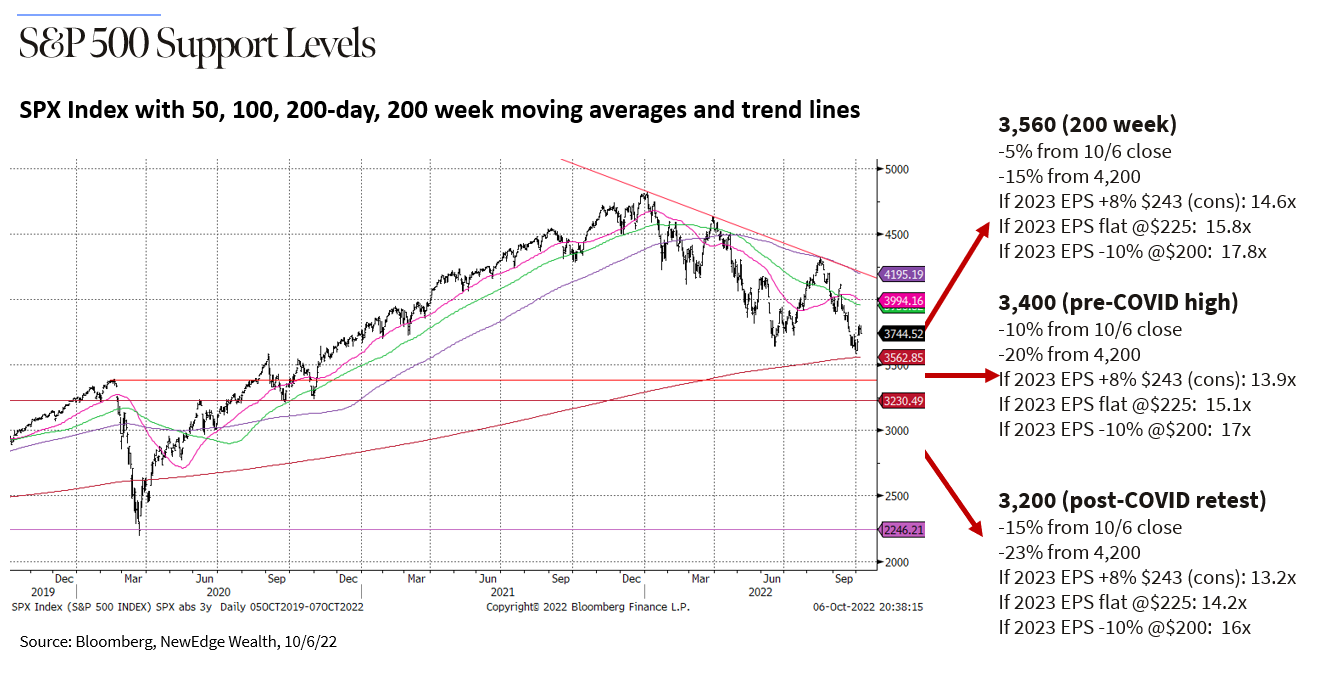
Below, you will see two charts, one with resistance levels (potential near term upside) and another with support levels (potential near term downside).
The price levels chosen are driven by technical resistance (4,200 and 3,900) and support (3,560, 3,400, 3,200) levels that are driven by trend lines and/or prior levels of support (when markets previously dared not go lower) and resistance (when markets previously dared not go higher).
The earnings estimates (EPS) chosen correspond to current 8% year over year consensus growth estimates (likely too high ), flat estimates year over year (consistent with a non-recessionary Fed tightening cycle), and -10% year over year (consistent with a mild, “average” recessionary decline).
As you can see from the above charts, there are fairly widespread outcomes for this market, depending on what you assume is reasonable for both earnings and valuations.
In our view, current EPS estimates for 2023 are likely too high, while we still see downside risk for valuations as the Fed continues to tighten policy and earnings better reflect economic reality.
Our more cautious view on earnings and valuations does not prohibit stronger markets in the very near term. Institutional positioning in equities has become very light/short, sentiment is pronouncedly bearish, and technical measures have been flashing “oversold” (essentially moving too far too fast to the downside). When these decidedly bearish conditions are present, it does not take a substantial surprise of good news in order to get markets moving in the other direction (as shorts are covered and positioning is normalized).
However, given the headwinds to earnings and valuations in the medium-term, we see a risk that any technical bounce could be short-lived, mostly if markets hit up against the resistance levels illustrated above.
On the other hand, if near-term weakness continues and accelerates, we want to avoid the emotional fear response that often comes when markets plumb new lows. By referencing the charts above we can better see that as markets move lower, valuations become more attractive and the bar for earnings gets lower. We believe the combination of lower valuations and lower earnings is typically a strong setup for potentially solid forward returns in the future.
This is why, as we discussed in our recent article, we want to be prepared to use downside volatility to add to equities for longer term investors. This is not about catching the ultimate low or ringing the bell at the bottom. Instead, it is about being disciplined about long-term potential when the near-term is highly uncertain.
A dose of dispassion is helpful in times like these.
IMPORTANT DISCLOSURES
The views and opinions included in these materials belong to their author and do not necessarily reflect the views and opinions of NewEdge Capital Group, LLC.
This information is general in nature and has been prepared solely for informational and educational purposes and does not constitute an offer or a recommendation to buy or sell any particular security or to adopt any specific investment strategy.
NewEdge and its affiliates do not render advice on legal, tax and/or tax accounting matters. You should consult your personal tax and/or legal advisor to learn about any potential tax or other implications that may result from acting on a particular recommendation.
The trademarks and service marks contained herein are the property of their respective owners. Unless otherwise specifically indicated, all information with respect to any third party not affiliated with NewEdge has been provided by, and is the sole responsibility of, such third party and has not been independently verified by NewEdge, its affiliates or any other independent third party. No representation is given with respect to its accuracy or completeness, and such information and opinions may change without notice.
Investing involves risk, including possible loss of principal. Past performance is no guarantee of future results.
Any forward-looking statements or forecasts are based on assumptions and actual results are expected to vary from any such statements or forecasts. No assurance can be given that investment objectives or target returns will be achieved. Future returns may be higher or lower than the estimates presented herein.
An investment cannot be made directly in an index. Indices are unmanaged and have no fees or expenses. You can obtain information about many indices online at a variety of sources including: https://www.sec.gov/answers/indices.htm.
All data is subject to change without notice.
© 2026 NewEdge Capital Group, LLC