


Buck Season: The U.S. Debt Ceiling Dynamics and Impact on Markets
The antlers of white tail deer bucks play an important role in their health, generational success, and survival. Antlers help regulate body temperature, attract mates, and protect bucks’ skulls when they bash into each other fighting for does. Usually there is a clear winner in these fights, with both bucks walking away relatively unscathed.
But, on rare occasions, these same antlers can be dangerous and deadly. Occasionally, when duking it out, the two bucks’ antlers can get permanently stuck. The bucks, unable to free themselves from battle positions, fight to the point of exhaustion and either die of starvation or a predator attack.
Congress’s gridlock and battling is a lot like two bucks fighting. Most of the time the party disputes carry manageable market risks, but occasionally this gridlock has the potential to wreak havoc on the U.S. economy and financial markets. The time that these Congressional economy and market risks are the amplified is during debt ceiling debates, which is what we are locked in today.
Below we want to focus on the impact of the debt ceiling fight on investors, but for those who would like helpful background on key concepts related to the debt-ceiling debate, here are articles and audio from the Brookings Institute, NPR, Associated Press, Odd Lots Podcast, Dan Clifton of Strategas, and Libby Cantrill of PIMCO.
Also, to succinctly summarize the current state of the debt ceiling fight:
- The Republicans in the House of Representatives passed a bill this week to raise the debt ceiling tied to $4.8 trillion of spending cuts over the next five years.
- The bill raises the debt ceiling by $1.5 trillion or extends it until March 2024, whichever comes first, which would revive the debt ceiling as an election-year issue.
- This bill is expected to be dead on arrival to both the White House (with President Biden demanding a “clean” increase of the debt ceiling) and the Senate (with Democrats balking at the budget cuts and relative, making the 60 votes needed unachievable).
- The purpose of this bill is to kick off negotiations between the two parties, who are faced with the looming “x-date”, when the Treasury exhausts its “extraordinary measures” to not go over the debt limit.
- The timing of the x-date, and, thus, how much time Congress has to negotiate, is uncertain, with the Treasury and some analysts cautioning it could be as soon as mid-June, and other analysts projecting later in July or August (depending on tax receipts, spending, and the level of the Treasury cash balance, called the Treasury General Account).
- Given the passage of the House bill, some spending cuts are likely in the final resolution. Spending cuts have the potential of being a drag on U.S. economic growth, as they were post the Sequestration/Budget Control Act of 2011.
- It is possible that a resolution to the debt ceiling will come close to the x-date, with Strategas estimating a 75% probability of a resolution within two weeks of the x-date and a 65% probability of a resolution within one week.
- There is a chance that a resolution could happen after the x-date, and the Treasury will have to prioritize spending, such as for interest payments, potentially resulting in a government shutdown.
- The odds of a default are forecasted to be very low (but non-zero), while the odds of a credit rating downgrade could be higher. Analysts note multiple measures that the Treasury can take to continue to pay interest on existing debt and roll over maturing debt in order to avoid a default (the U.S. has never defaulted on its debt). However, analysts note that the brinkmanship using the “full faith and credit” of the U.S. Treasury as a bargaining chip could risk credit rating downgrades, like in 2011.
What does all of this mean for investors? We will consider the major asset classes: cash, bonds, and equites. We will compare performance to the 2011 debt ceiling debacle, which was eventually resolved after a U.S. credit downgrade, a government shutdown, and a negotiated plan for significant spending cuts (the Budget Control Act of 2011).
Cash Investors
As interest rates have risen, holders of cash have moved low yielding bank deposits into higher yielding instruments such as Treasury Bills and money market funds (money markets or MMF). However, given fears of default (though considered a low probability) and volatility within Treasury Bills, investors have expressed concern that typically safe and stable money markets could experience price volatility and investor outflows.
Price volatility (with the Net Asset Value of a fund falling below $1, referred to as “breaking the buck”) and runs on money market funds are rare. The last time a MMF broke the buck was in 2008 during the GFC, however since this time, the quality of the assets within MMFs has improved (the 2008 MMF that broke held commercial paper from Lehman Brothers). Further, the Fed’s Reverse Repo Facility that was stood up in 2013 can provide an essential source of liquidity that allows funds to avoid being a forced seller in the event of underlying asset volatility and investor redemptions. Investor redemptions will have to be monitored for MMFs, mostly if the debt ceiling debate nears the “brink” and fears of default rise.
All in, our fixed income portfolio manager, Ben Emons, expects today’s high quality money market funds to remain safe, liquid, and unlikely to “break the buck”. Ben notes that there are differences between types of money market funds and how they care fare in a worst case debt showdown. He writes: “The caution is about Treasury money market funds that do not have a redemption gate (unlike prime funds). However, these MMFs have prepared for a debt ceiling by avoiding the T-bills that mature in the period of when the X-date may hit. Even with this potential volatility, the liquidity of T-bills outside the X-date zone should remain sufficient. If the crisis gets worse, the Fed can intervene with a T-bill liquidity program, like in 2019.”
Bond Investors
For short-term bond holders, yields have already started to rise for Treasury Bills expiring near the potential x-dates. A further spike in yields is possible once the timing of the x-date becomes more certain and if a resolution is not yet achieved.
On rolling Treasury Bills themselves, Ben Emons considers rolling expiring T-bills further out to the fall of 2023 in order to avoid volatility near the potential x-dates.
For longer-term bond holders, the debt ceiling episode of 2011 saw yields fall in a flight-to-safety trade and reflect lower growth and inflation expectations given the negotiated austerity resolution. The 10-year Treasury yield fell 100 bps from 2.7% in February 2011 to 1.7% September 2011.
For credit investors in 2011, the debt ceiling uncertainty and spending cuts resulted in a widening of credit spreads and weaker period of performance of investment grade and high yield bonds. Investment grade Baa spreads widened nearly 100 bps starting in July 2011. High yield funds experienced downside volatility, with HYG (iShares iBoxx $ High Yield Corporate Bond ETF) falling -15% rapidly in the summer of 2011, taking about 6 months to return to the pre debt ceiling price levels.
Equity Investors
We believe there is the potential for three main impacts for equity investors from the debt ceiling: heightened uncertainty which sparks a risk-off mood, reduced growth (both GDP and EPS) if government spending is cut meaningfully as part of a negotiation, and liquidity dynamics going into and coming out of a resolution.
Looking at 2011, we can see the first two potential impacts at play. The S&P 500 swiftly responded to debt ceiling issues with an 18% sell-off in late-July/early-August, hitting an ultimate low in October and taking until February of the following year to reach pre-debt ceiling levels.
This proved to be an attractive buying opportunity for investors, partially driven by how discounted the index became following the 2011 sell-off. The S&P 500 traded to just 10.5x forward PE in 2011, nearly to the depths reached in 2008. For perspective, today’s PE is 18.5x forward, about 7% above the 10-year average.
On the third potential impact, as we discussed two weeks ago, the liquidity dynamics related to the debt ceiling have been a key contributor to market strength in the past two quarters. We described how the Treasury has spent down its Treasury General Account cash balance to avoid going over the debt-ceiling, which has effectively added liquidity into markets and the economy. Once the debt ceiling is resolved and the Treasury returns to normal issuance of debt, we could see this market boosting liquidity source fade and spark renewed downward pressure of valuations, which are nearing pre-pandemic peaks.
Conclusion
This Buck Season debt ceiling debate is just getting started. Depending on the timing of the x-date, Congress could be locked in this fight for the next 1-3 months.
We expect a resolution, but it could come with much more angst and uncertainty than arguably necessary. The uncertainty does carry the potential to roil markets for risk assets, which may also have to weigh the impact of lower growth from negotiated budget cuts. We must also consider the impact of liquidity on the path of risk assets once a resolution is achieved. We will watch money market fund flows closely but note the higher quality of underlying holdings vs. prior debt ceiling debates and the existence liquidity facilities that can reduce the risk of fund value volatility.
Top Points of the Week
By Cameron Dawson, CFA®
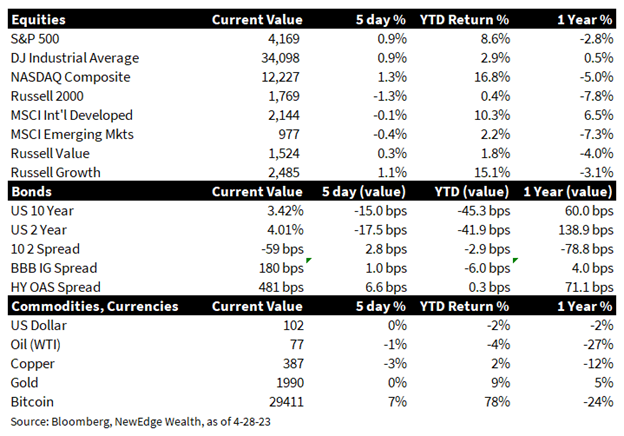
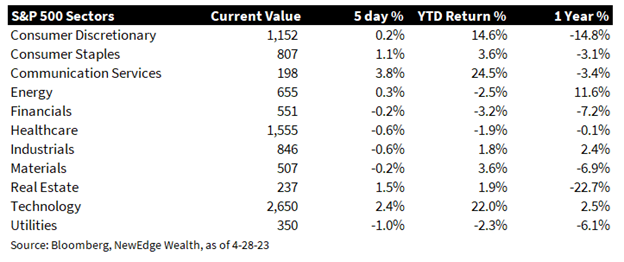
- Equities rally: Large cap U.S. equities rallied on the week, boosted by strong earnings reports from some of the biggest weights in the large cap indices. Yet again, small cap equities (Russell 2000) trailed, ending the week lower. Growth outperformed Value (Russell 1000 indices), driven by strong Technology and Communications sector earnings (the two best performing sectors on the week). International markets lagged, ending the week lower as well.
- Yields drop: Treasury yields fell for the week, with both the 2-year and 10-year yields lower. Yields moved lower in response to an update from the troubled First Republic Bank, which raised concerns that banking issues could continue and in turn increased probabilities/bets that the Fed could ease policy in 2H23. Credit spreads widened slightly on the week but remain relatively contained (below the SVB and summer-2022 highs).
- Overall earnings season: 1Q23 earnings season is about half-way completed, with 53% of the S&P 500 reporting. According to FactSet, 79% of companies have beat EPS estimates (above the 5-year average of 77%), with an aggregate beat of 6.9% (below the 5-year average of 8.4%). Overall EPS growth is coming in at -3.7% vs. -6.7% forecasts going into earnings season. Overall revenue growth is coming in at +2.9%. This is the second quarter in a row where revenues have risen but earnings have fallen due to margin compression.
- First Republic Earnings and Banks: For signs of continued regional banking stress, investors closely watched the delayed release of First Republic Bank (FRC) 1Q23 earnings. The company’s update Monday night, which tried to signal stability in 2Q23 post the March turmoil, did not serve to assuage investor concerns. Shares plummeted in response (-40% on Tuesday and another -50% on Friday; interestingly, other regional banks sold off in sympathy on Tuesday, but rallied on Friday, not signaling contagion). FRC’s troubled balance sheet, with its deadweight of a concentration in ultra-low interest rate mortgages and underwater marketable securities, is making a non-government rescue plan (or as the company called it, “strategic alternatives”) difficult to achieve. The company discussed cutting costs (25% headcount reduction) and shrinking its balance sheet (cutting down on loan growth). Broad loan growth continues to be the must-watch metric to determine if regional banking issues will have broader economic implications.
- Tech/Communications Earnings Highlights: Earnings this week were dominated by large Technology and Communications companies. Broadly speaking, earnings beat estimates, which drove large rallies in multiple heavyweight names. MSFT shares flew higher with the company pointing to continued strong demand in its cloud business and pointing to the potential for artificial intelligence to drive growth in its search business. META shares soared as cost cutting and the “year of efficiency” drove margin expansion, while revenues surprisingly grew YoY (after three quarters of declines), as the company pointed to improving trends in its core advertising business. GOOG/GOOGL shares rose slightly on its report of an improvement in advertising revenues and the benefits of cost cuts. AMZN was the laggard, with shares reversing early gains when the company warned about a slowdown in its cloud business, its key profit diver.
- Inflation data in-line, but elevated wage data makes Fed hike likely next week: March Personal Consumption Expenditures (PCE, this is the Fed’s preferred inflation metric) price data was in-line with estimates and moderated from February data (Headline YoY, Headline MoM, Core YoY, Core MoM). Notably and encouragingly, the Supercore Inflation data (Core Services Ex-Housing, the Fed’s new must-watch metric) showed moderation from February (YoY, MoM). Not so encouragingly, the 1Q23 Employment Cost Index came in above expectations (+1.2% vs. +1.1% consensus), accelerated from 4Q22 (+1.1%), and continues to run well above the highs seen in the pre-pandemic cycle (the ECI never went above +0.8% from 2008-2020). This ECI data increases the odds of a Fed hike next week in May.
- 1Q23 GDP Softer, But Stronger Under the Surface: The initial read on 1Q23 GDP (QoQ Annualized) came in below expectations (1.1% vs. 1.9% consensus), primarily due to a drag from lower inventories, which represented an over -2% drag on the quarter’s growth. Under the surface, the report was stronger, with Final Sales to Private Domestic Purchasers, which removes this inventory dynamic, accelerated to 3.2% (SAAR), which is the fastest pace since 2Q21.
- Next week in earnings: Earnings season rolls on, with another 162 S&P 500 names releasing quarterly updates. All eyes will be on AAPL on Thursday, as the largest weight in the S&P 500 (7.5%) and second largest weight in the NASDAQ (12.6%). Bloomberg consensus expects F2Q23 EPS of $1.43 (-6.1%), primarily driven by an expected -5% drop in revenue YoY. Reads on the U.S. consumer may be gleaned from SBUX, KHC, and MAR. There are also a host of Healthcare (CVS, RGN, PFE) and Energy (EOG, COP) reporting next week.
- Next week in data, and the Fed: The Fed meets for its May Federal Open Market Committee (FOMC) meeting on Tuesday and Wednesday, with the press conference Wednesday. The market currently ascribes an 88% probability that the Fed will hike rates next week, with a 24% probability of another hike in June. Note the Fed does not update the Dot Plot or the Summary Economic Projections (SEP) at this meeting, meaning the forward guidance for rates will have to be gleaned from the press conference. The Institute of Supply Management (ISM) released April Purchasing Managers Indices (PMI) for both Manufacturing (46.8 consensus, signaling continued contraction) and Services (51.8 consensus, signaling slight expansion).
IMPORTANT DISCLOSURES
Abbreviations:
Dot Plot: The Fed dot plot is published quarterly as a chart showing where each of the 12 members of the FOMC expect the federal funds rate to be for each of the next three years and the long term; ECI: Employment Cost Index; EPS: Earnings per Share; GDP: gross domestic product;GFC: Great financial crisis; ISM Manufacturing PMI: Institute for Supply Management Purchasing Managers Index; PCE: personal consumption expenditures; PE: price to earnings ratio, the ratio of share price of a stock to its EPS; SAAR: seasonally adjusted annual rate.
Index Information: All returns represent total return for stated period. S&P 500 is a total return index that reflects both changes in the prices of stocks in the S&P 500 Index as well as the reinvestment of the dividend income from its underlying stocks. Dow Jones Industrial Average (DJ Industrial Average) is a price-weighted average of 30 actively traded blue-chip stocks trading New York Stock Exchange and Nasdaq. The NASDAQ Composite Index measures all NASDAQ domestic and international based common type stocks listed on the Nasdaq Stock Market. Russell 2000 is an index that measures the performance of the small-cap segment of the U.S. equity universe. MSCI International Developed measures equity market performance of large, developed markets not including the U.S. MSCI Emerging Markets (MSCI Emerging Mkts) measures equity market performance of emerging markets. Russell 1000 Growth Index measures the performance of the large- cap growth segment of the US equity universe. It includes those Russell 1000 companies with relatively higher price-to-book ratios, higher I/B/E/S forecast medium term (2 year) growth and higher sales per share historical growth (5 years). The Russell 1000 Value Index measures the performance of the large cap value segment of the US equity universe. It includes those Russell 1000 companies with relatively lower price-to-book ratios, lower I/B/E/S forecast medium term (2 year) growth and lower sales per share historical growth (5 years). The BBB IG Spread is the Bloomberg Baa Corporate Index that measures the spread of BBB/Baa U.S. corporate bond yields over Treasuries. The HY OAS is the High Yield Option Adjusted Spread index measuring the spread of high yield bonds over Treasuries. Sector Returns: Sectors are based on the GICS methodology. Returns are cumulative total return for stated period, including reinvestment of dividends.
The views and opinions included in these materials belong to their author and do not necessarily reflect the views and opinions of NewEdge Capital Group, LLC.
This information is general in nature and has been prepared solely for informational and educational purposes and does not constitute an offer or a recommendation to buy or sell any particular security or to adopt any specific investment strategy.
NewEdge and its affiliates do not render advice on legal, tax and/or tax accounting matters. You should consult your personal tax and/or legal advisor to learn about any potential tax or other implications that may result from acting on a particular recommendation.
The trademarks and service marks contained herein are the property of their respective owners. Unless otherwise specifically indicated, all information with respect to any third party not affiliated with NewEdge has been provided by, and is the sole responsibility of, such third party and has not been independently verified by NewEdge, its affiliates or any other independent third party. No representation is given with respect to its accuracy or completeness, and such information and opinions may change without notice.
Investing involves risk, including possible loss of principal. Past performance is no guarantee of future results.
Any forward-looking statements or forecasts are based on assumptions and actual results are expected to vary from any such statements or forecasts. No assurance can be given that investment objectives or target returns will be achieved. Future returns may be higher or lower than the estimates presented herein.
An investment cannot be made directly in an index. Indices are unmanaged and have no fees or expenses. You can obtain information about many indices online at a variety of sources including: https://www.sec.gov/answers/indices.htm.
All data is subject to change without notice.
© 2026 NewEdge Capital Group, LLC

