


I Am a River: Running with the Liquidity Current
Is that what you want?
Is that what you really want?
A river, a river
A river running underground
– “I Am a River”, Foo Fighters
Don’t fight the Fed.
Fighting the flow of Fed-related liquidity is like trying to swim against a powerful river current: you can swim as hard as you can, but you will make little forward progress if the flow of the current is working against your efforts.
The Fed’s liquidity current can flow in two directions (much like the Tonle Sap River in Cambodia, which is the only river in the world that changes directions twice a year!), so appreciating the direction of the current is vital.
In practice, the “don’t fight the Fed” mantra means that when the Fed is easing and making liquidity more abundant, don’t be bearish (negative), but when the Fed is tightening and making liquidity more scarce, don’t be bullish (positive).
So how, with all of the Fed’s hawkish, tightening talk, plus continued rate hikes, have equity markets been so strong and resilient in 2023?
There are multiple reasons and narratives for this resilience, including: positioning being very light/short to start the year, 2022’s laggards being aggressively oversold into the end of last year, optimism about a soft/no landing and the resulting earnings resilience, and expectations for future Fed easing.
However, we think the most powerful, and possibly most underappreciated, reason for 2023’s equity resilience is that, despite the Fed’s hawkish talk, there has been an incredible, somewhat stealth (like Foo’s “river running underground”, referring to the Minetta Creek in Manhattan), increase in liquidity since the start of 2023. We think this liquidity has boosted markets through expanded valuations (we wrote two weeks ago about Technology stock strength and how it all came from PE multiple expansion, while earnings estimates have been cut).
Effectively, the “river running underground” has run in the opposite direction of what most perceived at the start of the year: instead of liquidity becoming increasingly scarce, it has become increasingly abundant, meaning those with bearish/cautious views have been swimming against the current.
The analysis of the degree of liquidity addition comes from the incomparable Dan Clifton at Strategas Research Partners. Dan and team calculate that there was a $755 billion increase in liquidity in 1Q23. To put that into context, that is more liquidity added in 1Q23 than was removed during any single quarter in 2022, with the max reduction being in 2Q22 at -$707B.
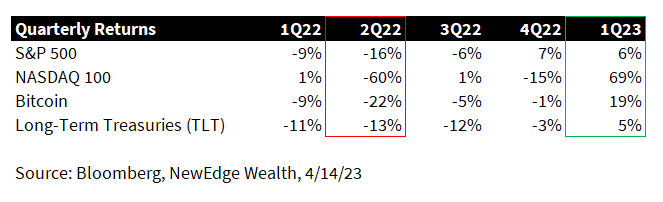
This is interesting considering that the worst quarter for risk asset returns was 2Q22, as seen in the table below. As bad as 2Q22 was for risk assets from a liquidity perspective, the benefit to risk assets from added liquidity in 1Q23 was even greater. Also note how the most liquidity-sensitive assets, such as crypto and long-duration Growth stocks performed the worst in 2Q22 and the best in 2Q23.
So if the Fed is still raising rates and talking hawkish, from where did this added liquidity come? There were two key sources, with one coming from the Fed’s response to the Silicon Valley Bank (SVB) collapse and regional bank issues, and the second from the Treasuries “extraordinary measures” to avoid going over the debt ceiling.
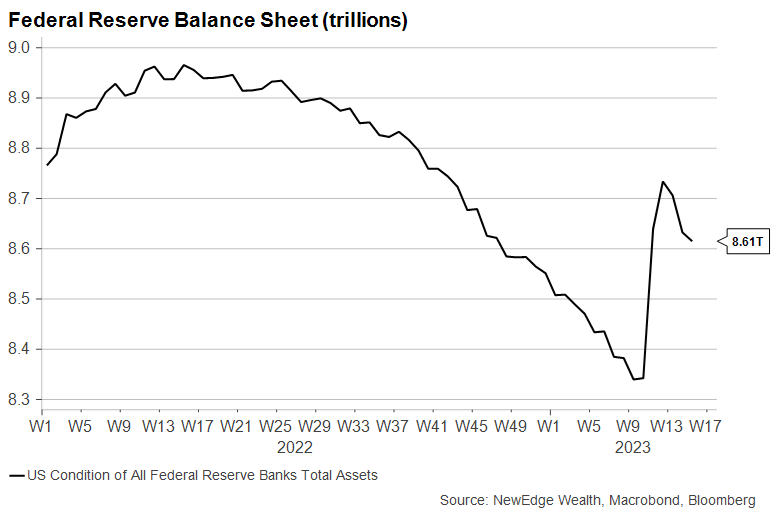
Strategas estimates that the Fed’s response to SVB injected $500B of liquidity into financial markets. Though the Fed’s provision of liquidity to banks in the wake of SVB (allowing banks to source liquidity from the Fed using bonds held at losses but pledged at par for collateral) is not equivalent to traditional Quantitative Easing (the outright purchase of bonds by the Fed to expand its balance sheet), the effect was still impactful to markets, which observed that in a mere two weeks, nearly 2/3 of the Fed’s Quantitative Tightening that started in 2Q22 was reversed.
Looking forward, now that the banking sector appears to be stabilizing by observing statistics like banks’ usage of the Fed’s Discount Window, we are starting to see the Fed’s balance sheet shrink again and Quantitative Tightening take hold.
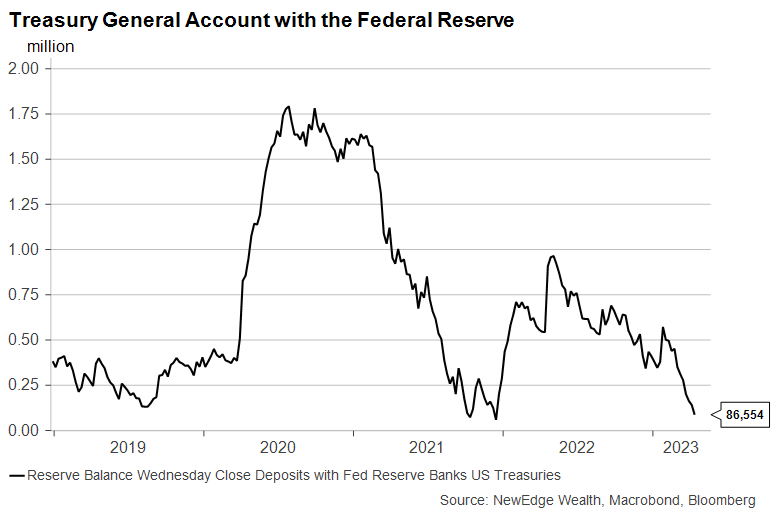
The second source of liquidity is from dynamics around the debt ceiling. As the Treasury’s debt has neared its Congressional-imposed limit, with no Congressional will to raise this limit, the Treasury has had to turn to “extraordinary measures” in order to avoid going over the limit. One of those extraordinary measures is for the Treasury to spend down its excess cash balance that it holds at the Fed, called the Treasury General Account (TGA). By spending its excess cash, instead of issuing new debt, the Treasury is effectively increasing liquidity in the financial system.
This Reuters article from 2021 does a great job outlining the impact of the TGA being reduced, which is described in the article as “tsunami of cash into depository bank reserves”. This spending down of the TGA in 2021 coincided with a massive blow-off top rally in Growth, speculative, long-duration, liquidity-sensitive assets.
Looking forward, once the debt ceiling is resolved (or the Treasury exhausts its “extraordinary measures”, expected to be in June at the latest), this source of added liquidity will fade and could potentially turn into being a headwind for risk asset valuations.
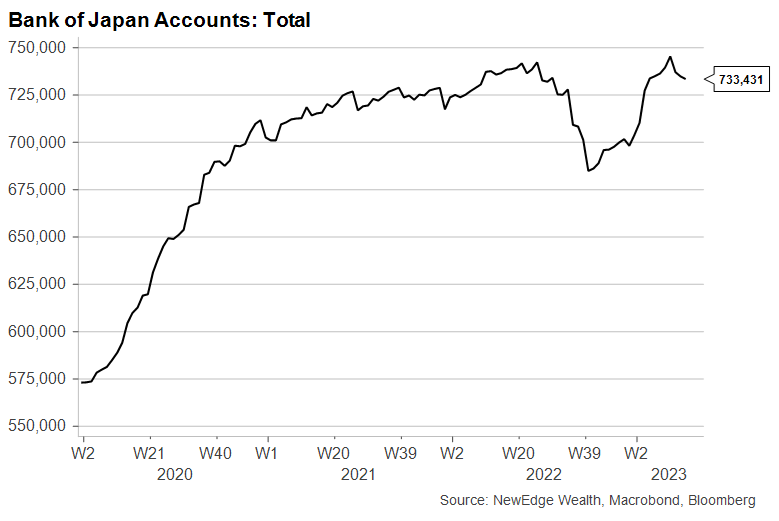
When thinking about liquidity, we must be global and consider the impact of other major central banks. The most impactful central bank on liquidity in recent months has been the Bank of Japan, which has expanded its balance sheet by nearly $1 trillion USD since October 2022, buying bonds in order to defend the interest rate peg of its Yield Curve Control (YCC) policy.
Looking forward, questions remain if the new Governor of the Bank of Japan, Kazuo Ueda, will continue with this dovish monetary policy path. Analysts have posited that the recent drop in global yields may give the BOJ the leeway to relax the YCC policy. If this occurs, we could see less bond buying, and thus less liquidity support at the margin, from the BOJ.
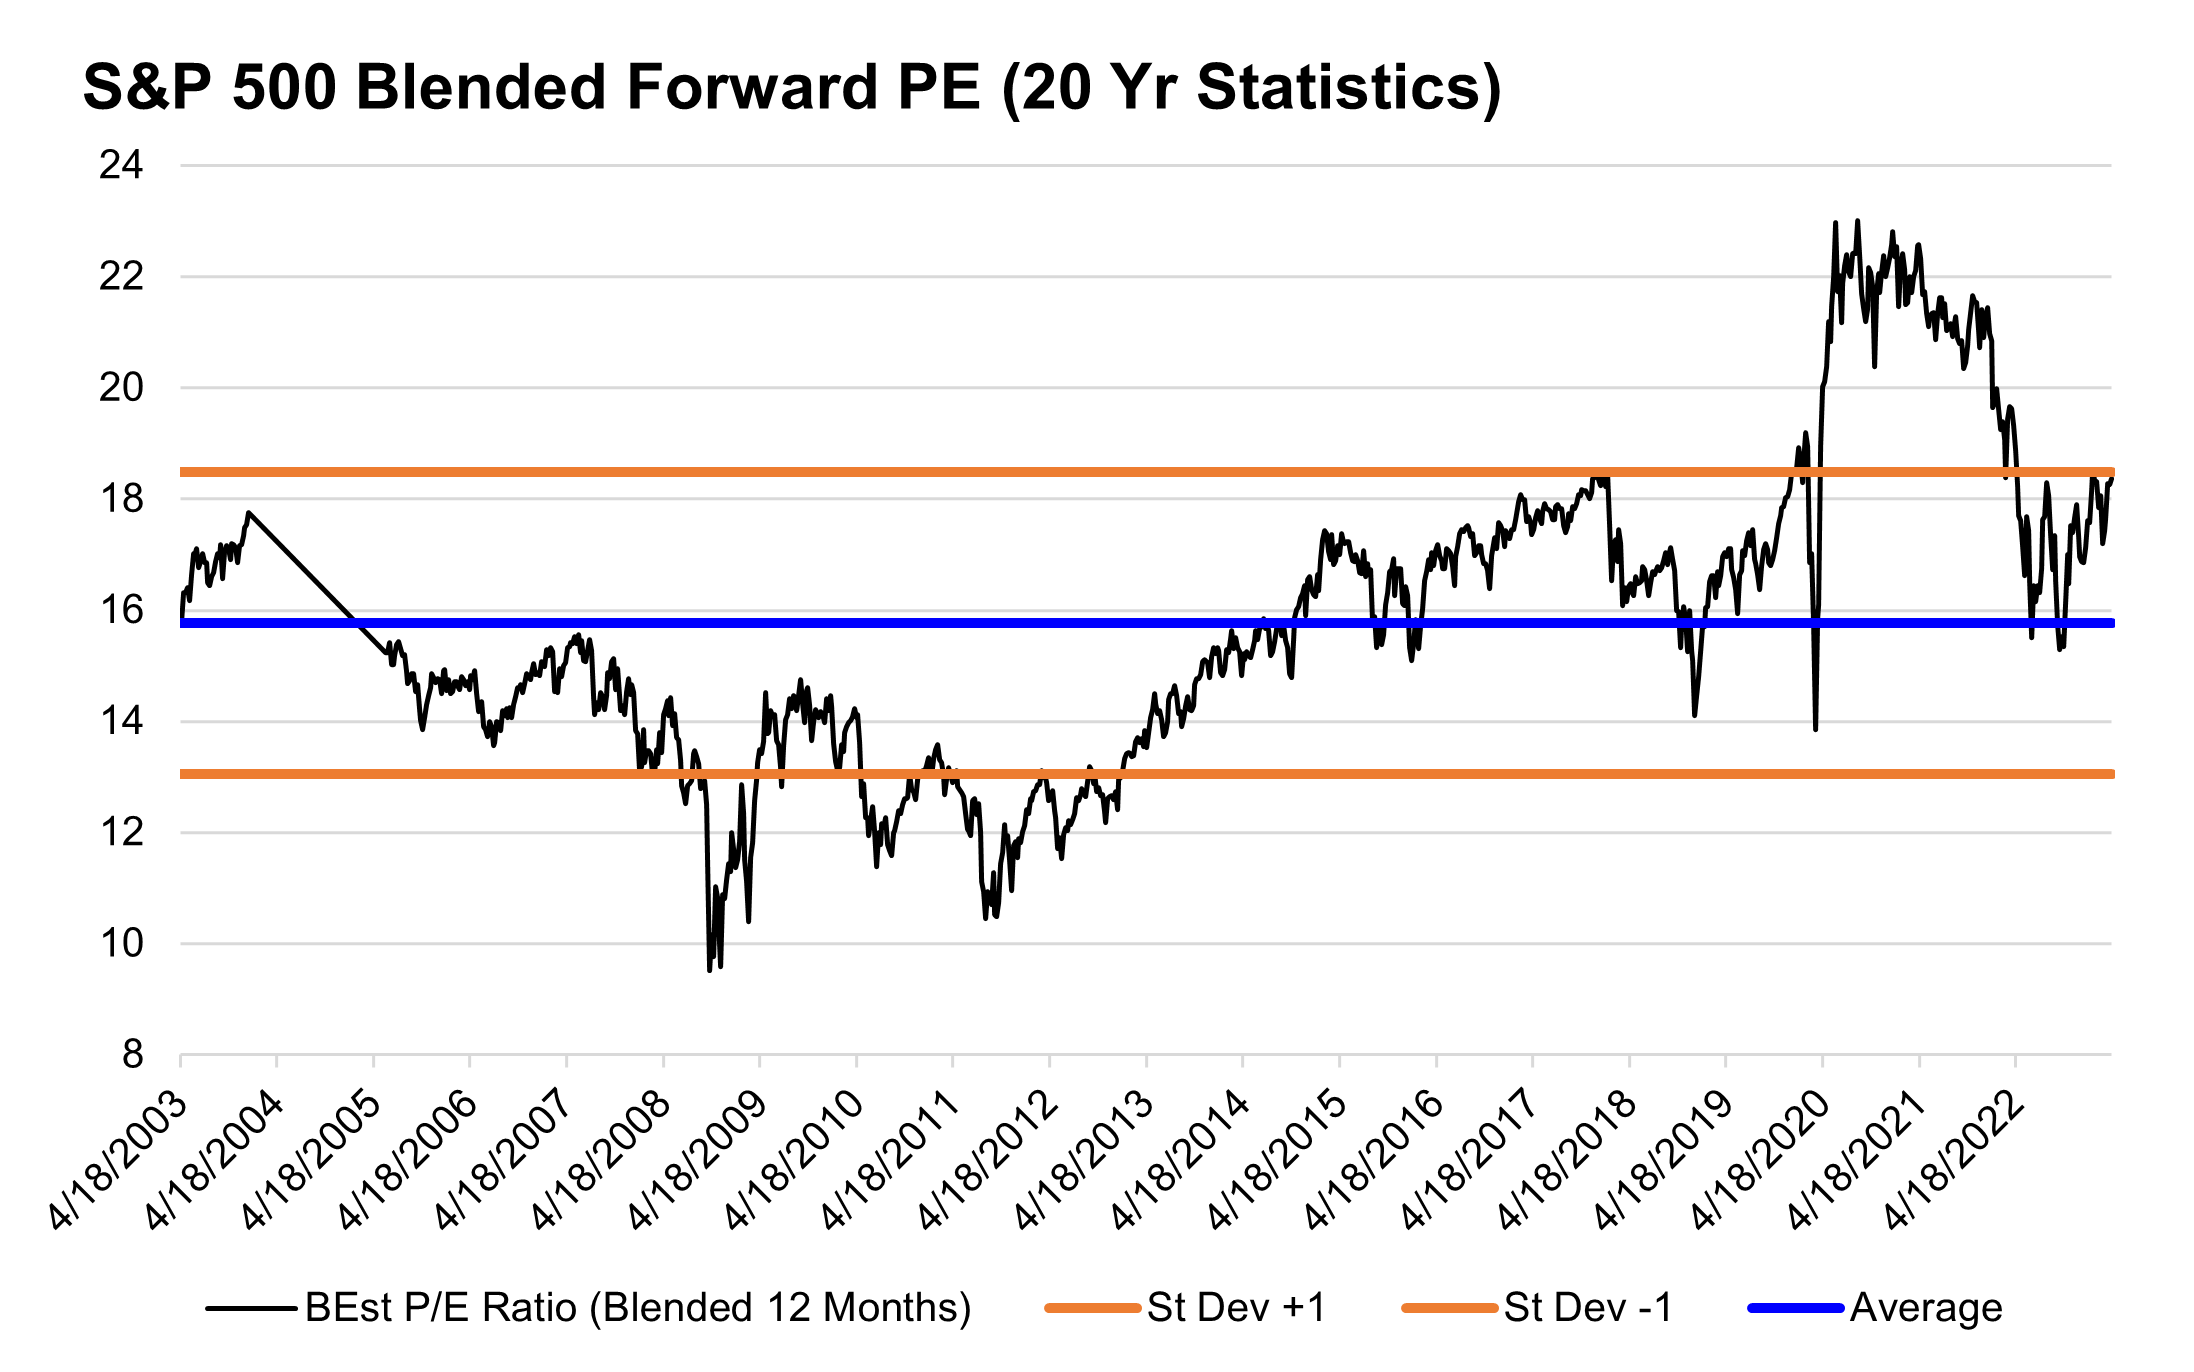
Taking all of these sources of liquidity together, we can observe that they have likely been a huge tailwind to risk asset markets since the October 2022 low. We think this is a key reason why we have seen equity valuation multiples expand aggressively in recent months, even while earnings estimates have been continuously trimmed. For the S&P 500, we have been flagging that valuations could hit a ceiling at ~19x (the pre-pandemic peak) if markets don’t receive a pandemic-era-sized injection of stimulus.
We see potential for these sources of liquidity to become less supportive in the coming months. If banking issues continue to abate (the early read on large bank earnings have been positive), the dominant driver of the Fed’s balance sheet will return to being Quantitative Tightening. Once the debt ceiling is resolved, the Treasury’s actions may turn to be a headwind to liquidity. And if the Bank of Japan relaxes its yield curve control policy, we could see less foreign liquidity support at the margin.
For equity markets, this all could mean less fuel for valuation multiples to continue their breakneck expansion, possibly retreating back towards average levels. And so, we are on watch for this underground river of liquidity to change direction once again.
Top Points of the Week
By Jay Peters, CFA®
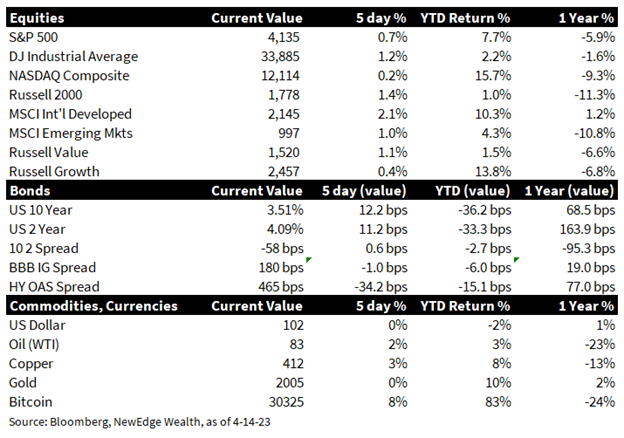
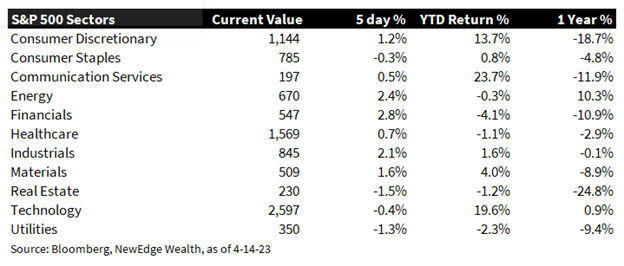
- Equities Rise for the Week: U.S. equities posted another week of gains, led by the more cyclical value (Russell 1000 Value Index) and small cap (Russell 2000 Index) segments. The Financials and Energy sectors were the top performers for the week, boosted by healthy bank earnings and rising oil prices. International markets (MSCI All Country World ex U.S. Index) modestly outperformed their U.S. counterparts (S&P500), as the U.S. dollar posted a 1% decline.
- Bank Earnings Exceed Expectations: First quarter earnings season kicked off on a positive note on Friday morning with surprisingly strong results from some of the nation’s largest banks. Both JPM and WFC posted healthy top and bottom-line beats with revenues and earnings surging year-over-year, driven by robust net interest income. At the same time, both banks set aside increased provisions for loan losses, citing expectations of a deteriorating economic environment.
- Fed minutes point to another hike in May: On Wednesday, the minutes of last month’s Federal Reserve policy meeting were released and illustrate a Fed that remains committed to curbing inflation despite increased recessionary concerns. The minutes showed most officials projected rates would reach 5.1% this year, suggesting one more quarter point hike in May and then an extended hold. Policymakers also emphasized the need for “flexibility and optionality” given the high uncertainty around the impact of recent banking stress.
- Oil prices continue to climb: Crude oil prices rose for the fourth consecutive week, topping $82 a barrel, following comments from OPEC citing a healthy supply deficit which is expected to continue to widen this year. WTI prices have rebounded strongly from a low of $67 a barrel in mid-March following OPEC’s surprise production cut.
- U.S. Dollar continues to slide: The dollar posted its fifth consecutive weakly decline and is on pace for the longest losing streak in three years amid speculation that the Federal Reserve is close to ending its rate-hike campaign.
- Continued Weakness in Retail Sales: March saw a second straight month of broad declines in retail sales, reflecting weakness in demand for discretionary services and consumer expectations of a worsening economy. Rising gas prices in the coming months may put further pressure on consumer spending.
- Jobless claims are trending upwards: Jobless claims for the week continued their gradual climb which began in January. Initial claims rose by 11k to 239k, above consensus and bringing the four-week moving average of claims to 240k.
- Interest rates were relatively calm this week: The U.S. 2 Year Treasury Yield rose by 10bps on the week and the U.S. 10 Year Treasury Yield rose by 13bps on the week, resulting in slightly less inverted yield curve at -58bps between 2s and 10s. The current inversion is now in its seventh month and Bloomberg consensus estimates suggest it will deepen further in the second quarter, with expectations of a 2s and 10s yield spread of -69bps by quarter end.
- Inflation data came in softer than expected: The Consumer Price Index and Producer Price Index came in below expectations for the month of March, with CPI rising 5.0% year-over-year (compared to 6.0% last month) and PPI rising 2.7% year-over-year (compared to 4.6% last month). Declines in food an energy prices were a substantial factor however as the deceleration inflation was less pronounced when you exclude those items. Measures like Supercore CPI (Core Services ex-Shelter) remain elevated and well above the Fed’s target of 2%.
- Coming up next week: We will get a healthy dose of first quarter earnings results next week from a wide range of industry groups. Notables include American Express which should provide a glimpse into the state of consumer spending, healthcare companies Johnson & Johnson and Philip Morris which will provide context around corporate pricing power, and semiconductor company Lam Research, which as a member one of the most cyclical industries should provide insight into the state of demand for chips and consumer electronics.
IMPORTANT DISCLOSURES
Abbreviations:
BOJ: Bank of Japan; WTI: West Texas Intermediate Crude – West Texas Intermediate can refer to a grade or a mix of crude oil, and/or the spot price, the futures price, or the assessed price for that oil; colloquially WTI usually refers to the price of the New York Mercantile Exchange WTI Crude Oil futures contract or the contract itself; OPEC: Organization of the Petroleum Exporting Countries; CPI: Consumer Price Index; PPI: Producer Price Index
Index Information: All returns represent total return for stated period. S&P 500 is a total return index that reflects both changes in the prices of stocks in the S&P 500 Index as well as the reinvestment of the dividend income from its underlying stocks. The NASDAQ Composite Index measures all NASDAQ domestic and international based common type stocks listed on the Nasdaq Stock Market. The NASDAQ 100 is an index that is comprised of 100 of the largest non-financial companies listed on the Nasdaq Stock Market based on market capitalization. Russell 2000 is an index that measures the performance of the small-cap segment of the U.S. equity universe. MSCI International Developed measures equity market performance of large, developed markets not including the U.S. MSCI Emerging Markets (MSCI Emerging Mkts) measures equity market performance of emerging marketsThe Russell 1000 Value Index measures the performance of the large cap value segment of the US equity universe. It includes those Russell 1000 companies with relatively lower price-to-book ratios, lower I/B/E/S forecast medium term (2 year) growth and lower sales per share historical growth (5 years).
Sector Returns: Sectors are based on the GICS methodology. Returns are cumulative total return for stated period, including reinvestment of dividends.
The views and opinions included in these materials belong to their author and do not necessarily reflect the views and opinions of NewEdge Capital Group, LLC.
This information is general in nature and has been prepared solely for informational and educational purposes and does not constitute an offer or a recommendation to buy or sell any particular security or to adopt any specific investment strategy.
NewEdge and its affiliates do not render advice on legal, tax and/or tax accounting matters. You should consult your personal tax and/or legal advisor to learn about any potential tax or other implications that may result from acting on a particular recommendation.
The trademarks and service marks contained herein are the property of their respective owners. Unless otherwise specifically indicated, all information with respect to any third party not affiliated with NewEdge has been provided by, and is the sole responsibility of, such third party and has not been independently verified by NewEdge, its affiliates or any other independent third party. No representation is given with respect to its accuracy or completeness, and such information and opinions may change without notice.
Investing involves risk, including possible loss of principal. Past performance is no guarantee of future results.
Any forward-looking statements or forecasts are based on assumptions and actual results are expected to vary from any such statements or forecasts. No assurance can be given that investment objectives or target returns will be achieved. Future returns may be higher or lower than the estimates presented herein.
An investment cannot be made directly in an index. Indices are unmanaged and have no fees or expenses. You can obtain information about many indices online at a variety of sources including: https://www.sec.gov/answers/indices.htm.
All data is subject to change without notice.
© 2026 NewEdge Capital Group, LLC

