


The world is a vampire
Sent to drain
Secret destroyers
Hold you up to the flames
– Bullet with Butterfly Wings, The Smashing Pumpkins
The Fed is a vampire. Sent to drain…
We all heard the phrase “when the Fed raises rates, something breaks” so much in the past year that this aphorism nearly became stale, mostly given the backdrop of renewed calm and optimism in markets to start 2023.
However, after the swift collapse of two west coast banks this week (Silicon Valley Bank and Silvergate), now something has actually broken this tightening cycle, and markets have been rudely awakened to the reality of a world where liquidity is tight, and the cost of money (interest rates) is high.
For as startling as this week’s events are, we should not be all too shocked that the Fed’s rapid and large tightening is causing challenges for the riskiest, most liquidity-sensitive, most speculative, and lowest-quality parts of financial markets and the economy. After all, the tempering of prior-cycle excesses through tighter financial conditions is one of the key ways that monetary policy impacts markets and the economy.
This is Warren Buffet’s tide going out to reveal short-less swimmers happening in real time.
So to evoke the melancholy verse of Billy Cogran, clearly there has been a bullet, the swift failure of two banks, and now the question is if this bullet has butterfly wings, meaning will there be a contagion that impacts the broader financial system (like the flap of the butterfly wings in Chaos Theory where a small event catalyzes much larger changes)?
There are unique characteristics to the collapse of Silvergate (crypto) and SVB (concentrated early-stage customer base and particularly poor balance sheet investments), but these unique weaknesses were revealed by higher rates from the Fed’s tightening. In SVB’s case, higher rates on Treasuries led to both losses in its poorly invested securities portfolio and losses of customer cash deposits that sought higher rates outside of the bank.
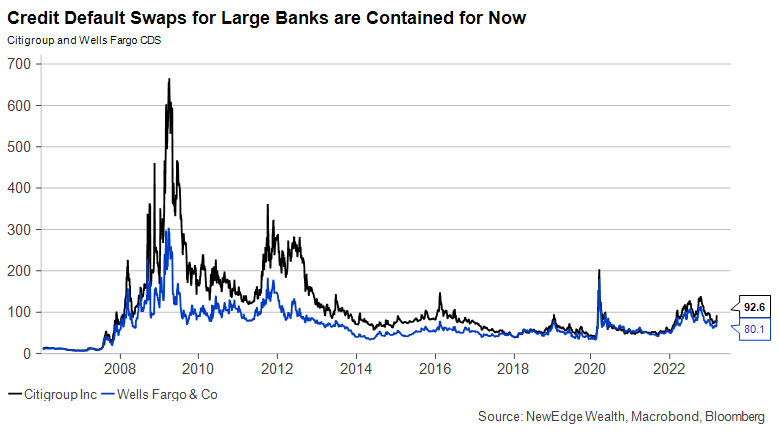
All banks are feeling this pinch from greater competition for deposits, but the largest U.S. banks have far better balance sheets and capital ratios, thanks to post-Great Financial Crisis (GFC) regulation, which can weather this Net Interest Margin and Net Interest Income pinch.
We can see the market’s pricing of risk to the large banks by looking at credit default swaps, which jumped on Thursday and Friday, but remain well below highs seen as recently as October 2022 and are miles below the GFC levels.
Looking outside of the banks, there are likely to be implications for SVB’s early-stage, venture customer base as well. In the near-term, these cash-burning companies could face liquidity crunches – Bloomberg reports that some startups are worried about making payroll. Funding costs are likely to continue to rise for these riskier companies, which could reveal going-concern risk for companies that begin to run low on their cash buffers. Eventually, investors that can step in to provide liquidity to the worthiest companies will likely benefit from more attractive valuations and terms than what were offered during the heady venture boom days of 2020-2021.
Of course, these early-stage companies are employers and customers of goods and services themselves, so there can be broader economic implications if more early-stage companies fold under the pressure of high funding costs.
We are following Bloomberg’s Bankruptcy Tracker closely for signs of accelerating stress. Interestingly, as of the end of February, there were 39 bankruptcy filings year-to-date, the fastest pace since 2009. Note that this is with a backdrop of an economy that has yet to see a material slowing, with still robust business investment and consumer spending. This would suggest that these bankruptcies could be the result of dubious business models that cannot be sustained when funding costs are high.
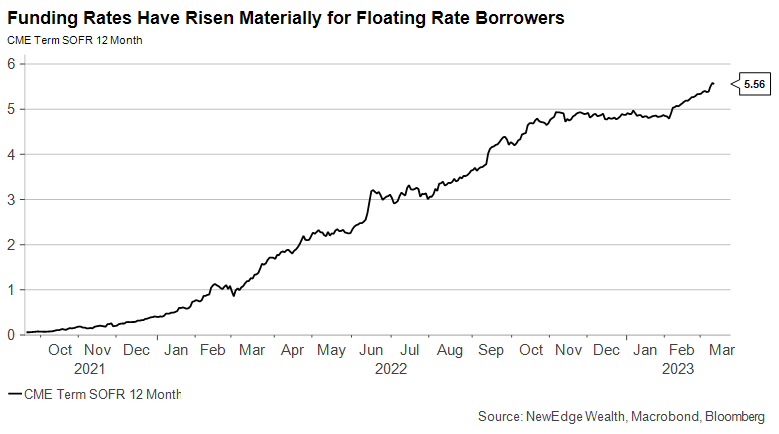
There is a similar dynamic happening within small cap stocks, which have underperformed sharply this week. Over 40% of the Russell 2000 is unprofitable, while according to JP Morgan’s Dubravko Lakos and team, 40% of the debt held by S&P 600 companies is floating rate, meaning they have seen a rapid rise in their interest costs as the Fed has raised rates.
One of our key assertions from last year was that it is not just about the destination the Fed reaches on rates, it is how long they stay there. Low quality floating rate borrowers may be able to tolerate much higher rates for a short time, but when these higher costs are sustained for multiple quarters, we are likely to see stress emerge.
Fed Response
All of these pockets of stress raise today’s hottest debated question: what can, or will, the Fed do in response?
We have seen the Fed step in to stabilize markets following emerging stress in concentrated banks, such as the Fed’s 2016 policy pivot to halting rate hikes, which was partially in response to stresses in regional banks that had concentrated exposure to oil and gas customers.
But there’s a key difference between 2016’s backdrop and today, and that is inflation. If inflation remains elevated, the Fed will likely have less room to step in and support markets when early signs of stress emerge (like they did in 2018 as well). This is likely why there is still a ~30% probability priced into markets that the Fed will raise 50 bps at its March 21st meeting. A hot CPI print next week on March 14th would complicate this inflation vs. financial stability trade-off further.
Market Response
Bond markets responded to all these events by sending both long and short yields lower. The 10-Year Treasury dropped on a flight to safety bid, while the 2-Year Treasury dropped as the bond market began to question how long the Fed can keep rates elevated given this emerging financial stress. We continue to watch the 2-year closely as signs of financial stress and imminent recession, with a precipitously falling 2-year typically a sign that bigger economic trouble, and thus much easier Fed policy, is on the horizon.
For equity markets, the weakness has been pronounced and ended with the S&P 500 and NASDAQ closing below major support levels (the 200-day moving average). We have been dubious that the recent strength was the beginning of the next bull market and thus saw no reason to “chase” recent stock strength.
The equity price action this week raises the likelihood of a re-test of the December lows and even a continuation of the prior downtrend back toward the October lows. The probability of these re-tests will depend on the earnings outlook (do we see greater estimate reductions to 2023 and 2024 in response to emerging economic stress?) and the path of valuations, which depends on both risk appetite and interest rates.
We have been noting that the recent level of valuations was not consistent with the level of interest rates and the tightness of liquidity (meaning valuations were levitating on a thin cloud of ebullient emotion). We could see this optimism evaporate with recent headlines, and, thus, valuations fall back towards reasonable levels (16-17x forward for the S&P 500). We also note that falling interest rates are not always positive for stocks if interest rates are falling for bad reasons (acute economic stress).
The issues of the last week are also a great reminder of the importance of quality equity investing, mostly in the later, riskier stages of the economic cycle. High quality companies that have strong balance sheets and robust cash flow generation can be resilient in times of liquidity, market, and economic stress.
Overall, we encourage investors to revisit our 2023 outlook with its mantra: “enjoy what you can, endure what you must”. This means there are likely to continue to be market stresses and volatility ahead, but the longer and further we stay in this bear market, the more opportunities will emerge for improved returns in future years.
Top Points of the Week
By Ben Emons
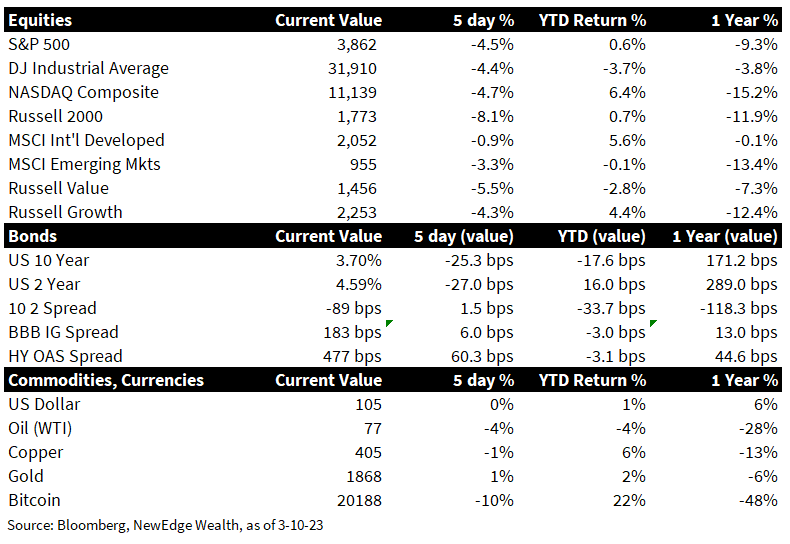
- Stocks Tumble: The equity market traded sideways and choppy until the fallout of Silicon Valley Bank (SIVB) came to light. The regional bank index, KRX, lost 16% on the week with SIVB, Signature Bank, and First Republic/CA down by 40 to 60% (SIVB halted on Friday). International equities reacted negatively but Europe, and Japan outperformed US equities, while China underperformed.
- Yields Drop: Treasury yields gyrated between Powell’s testimony and the SIVB headlines. At one point, the 2Y yield reached 5.08% and the probability of a 50-basis point hike at the March FOMC meeting rose to 80 percent. As the SIVB story unraveled, the 2Y yield fell by 40 bps and the market lowered its expected “terminal rate” to 5.25%, down 50 basis points from the intra-week highs. The yield curve steepened with the difference between the 2Y and 10Y narrowing to -90 basis points from -110 basis points. Short term T-bill yields also declined but they remain around 4.75% to 5%.
- Silicon Valley Bank: By late Thursday, it became apparent that Silicon Valley Bank was running into liquidity problems. The bank sold $21 billion in Treasury and mortgage-backed securities, realizing $1.8 billion in losses to cover customer deposit withdrawals that amount to up to $16 billion. The bank attempted to raise equity capital of $2.5 billion but failed and halted shares trading. The venture capital firms that had substantial deposits with SIVB rushed to get their money out. As liquidity issues mounted, the bank collapsed, and the FDIC took receivership.
- Powell Testimony: Going into the testimony, the expectations were low of Powell delivering a surprise. His statement was more hawkish and emphasized that if the totality of the data was stronger, it could warrant a faster pace of tightening to get to a higher rate than foreseen. Although Powell toned down on the second day of testimony by saying the March meeting had not been decided, he repeated a faster pace and higher rates.
- Non-Farm Payrolls: The non-farm payrolls came in hotter than expected at 311K (vs. consensus at 224K) but average hourly earnings softened to 0.2% on the month and the unemployment rate rose to 3.6% as the labor force participation went up to 63.4%. The breakdown showed robust job growth in leisure (108K) with technology -25K, the third consecutive month of losses.
- The BOJ and BOC: The Bank of Canada left rates unchanged but signaled to stay on hold for the time being. Inflation remains challenged and why the bank keeps optionality. The Bank of Japan left policy unchanged as expected but Kuroda said that the exit of easy monetary policy is too premature because the economy is showing signs of weakness.
- ECB: The ECB meeting next Thursday is not a non-event for markets. The central bank is expected to raise rates by 50 basis points because of still-rising inflation. The European economic data has been more resilient, while the banking system does not have systemic exposure to SIVB or US regional banks. The ECB is expected to deliver a 50-basis points hike, followed by at least two similar-sized hikes.
- Coming Up Next Week (CPI): There are two key macroeconomic events next week: CPI and retail sales. The Cleveland Fed CPINow is unchanged at 6.2% (vs. 6.0% consensus), and prices paid in ISM indices were higher, as well as the Atlanta Fed Wage tracker and gas prices are up by 5% since the last CPI report. The headline CPI is expected at 0.4% M/M and the core is expected at 0.4% M/M, a slight moderation but still elevated given the price pressures that have broadened in the economy.
- Coming Up Next Week (retail sales): Auto sales have weakened recently, which could show up in retail sales. The headline reading is expected to decline to 0.2% after a 3% expansion in January. Excluding autos and gas, the gain is 0.2% compared to 2.6% in January. The Beige Book noted moderate-to-strong growth in several districts during a typically slow seasonal period, which may flag an upside risk to the seasonally adjusted retail sales.
IMPORTANT DISCLOSURES
Abbreviations: Beige Book: Summary of Commentary on Current Economic Conditions by Federal Reserve District is a report is published eight times per year, where each Federal Reserve Bank summarizes anecdotal information on current economic conditions in its District; BOC: Bank of Canada; BOJ: Bank of Japan; CPI: Consumer Price Index; ECB: European Central Bank; GFC: great financial crisis; Powell: Jerome Powell, Chair of the Board of Governors of the Federal Reserve System.
Index Information: All returns represent total return for stated period. S&P 500 is a total return index that reflects both changes in the prices of stocks in the S&P 500 Index as well as the reinvestment of the dividend income from its underlying stocks. Dow Jones Industrial Average (DJ Industrial Average) is a price-weighted average of 30 actively traded blue-chip stocks trading New York Stock Exchange and Nasdaq. The NASDAQ Composite Index measures all NASDAQ domestic and international based common type stocks listed on the Nasdaq Stock Market. Russell 2000 is an index that measures the performance of the small-cap segment of the U.S. equity universe. MSCI International Developed measures equity market performance of large, developed markets not including the U.S. MSCI Emerging Markets (MSCI Emerging Mkts) measures equity market performance of emerging markets. Russell 1000 Growth Index measures the performance of the large- cap growth segment of the US equity universe. It includes those Russell 1000 companies with relatively higher price-to-book ratios, higher I/B/E/S forecast medium term (2 year) growth and higher sales per share historical growth (5 years). The Russell 1000 Value Index measures the performance of the large cap value segment of the US equity universe. It includes those Russell 1000 companies with relatively lower price-to-book ratios, lower I/B/E/S forecast medium term (2 year) growth and lower sales per share historical growth (5 years). The BBB IG Spread is the Bloomberg Baa Corporate Index that measures the spread of BBB/Baa U.S. corporate bond yields over Treasuries. The HY OAS is the High Yield Option Adjusted Spread index measuring the spread of high yield bonds over Treasuries. The KBW Nasdaq Bank Index is a modified market capitalization weighted index designed to track the performance of leading banks and thrifts that are publicly traded in the U.S that includes banking stocks representing large U.S. national money centers, regional banks and thrift institutions. Cleveland Fed CPINow is an estimate of inflation at present, using daily oil price, weekly gasoline retail price, and monthly consumer price. The Atlanta Fed’s Wage Growth Tracker is a measure of the nominal wage growth of individuals.
The views and opinions included in these materials belong to their author and do not necessarily reflect the views and opinions of NewEdge Capital Group, LLC.
This information is general in nature and has been prepared solely for informational and educational purposes and does not constitute an offer or a recommendation to buy or sell any particular security or to adopt any specific investment strategy.
NewEdge and its affiliates do not render advice on legal, tax and/or tax accounting matters. You should consult your personal tax and/or legal advisor to learn about any potential tax or other implications that may result from acting on a particular recommendation.
The trademarks and service marks contained herein are the property of their respective owners. Unless otherwise specifically indicated, all information with respect to any third party not affiliated with NewEdge has been provided by, and is the sole responsibility of, such third party and has not been independently verified by NewEdge, its affiliates or any other independent third party. No representation is given with respect to its accuracy or completeness, and such information and opinions may change without notice.
Investing involves risk, including possible loss of principal. Past performance is no guarantee of future results.
Any forward-looking statements or forecasts are based on assumptions and actual results are expected to vary from any such statements or forecasts. No assurance can be given that investment objectives or target returns will be achieved. Future returns may be higher or lower than the estimates presented herein.
An investment cannot be made directly in an index. Indices are unmanaged and have no fees or expenses. You can obtain information about many indices online at a variety of sources including: https://www.sec.gov/answers/indices.htm.
All data is subject to change without notice.
© 2026 NewEdge Capital Group, LLC

