


Too much love will kill you
Just as sure as none at all
It’ll drain the power that’s in you
Make you plead and scream and crawl
–Too Much Love Will Kill You, Queen
Respect the tape. That’s the message from market technicians (those who analyze price and volume data in markets) after this week’s rally. The ebullient response by equities to the Fed’s seemingly dovish press conference resulted in meaningful “breakouts” and surges in momentum in many stock indices. Taken alone, this springing price action, often referred to as “escape velocity”, could suggest that the Bear of 2022 is over and that a new Bull is upon us.
There is solid historical precedent to respect this high-velocity message from prices. Markets are forward-looking and often change direction long before fundamental data justifies these moves. The overarching market narrative is even slower to change course, with overly optimistic or pessimistic outlooks persisting long after the market turns for the worse or better, respectively.
One reason for markets changing course before data and narrative is that it takes time for broad market participants to appreciate what is truly driving the price action. A stale market narrative could be focusing on the wrong driver and miss what is most important for prices.
Recall the months coming out of the March 2020 COVID low. Markets ripped higher despite frightful virus data, corporate profit warnings, and shuddering economic activity. It turns out that trillions of dollars of financial and monetary stimulus were a far more powerful driver for markets than pandemic lockdowns. The bearish market narrative was slow to appreciate the bullish backdrop of stimulus. Those who respected the tape, with its massive surges in momentum, were the earliest to pick up on this shift.
A similar story happened in 2019 when an earnings and economic slowdown kept many market participants cautious, but stock prices rose rapidly thanks to the Fed’s pivot away from tightening policy. The market was the first to know and the narrative was the last to know.
Same in 2016. The fundamental world felt like it was ending due to the “industrial recession” all throughout 2016, and yet markets ripped higher due to renewed accommodation from Fed policy.
So, it is at times like this, when the narrative seems clear (growth is slowing, stocks are rich, the Fed remains tight) but markets seem to disagree (breaking above downtrend lines, momentum surges, breadth thrusts) that we have to ask ourselves how we can respect the tape.
First, we have to acknowledge that there are occasionally, but not often, false signals in price action. We had one as recently as the summer of 2022, when prices rose rapidly, with strong breadth and momentum, and yet this surge did not lead to the start of a new bull market at that time.
Second, respecting the tape may come with a finite horizon. Momentum is clearly to the upside in the near term (note the resilience of equity indices on Friday after the blow-out jobs report and weak tech earnings). The next level of resistance is up to 4,300 on the S&P 500 (the August 2022 high), while seasonality could fade as a tailwind as we get into the second quarter.
Third, and this is where Queen comes in, respecting the velocity of the tape does not mean ignoring our vulnerabilities.
Too high of a valuation multiple, too much exuberance, too much soft-landing optimism, and too much anticipation of Fed accommodation could all kill this rally if the data does not come in at ideal levels. Too much love will kill you.
Put another way, we think that the higher markets trade in the near term, the more vulnerable they become to unhappy surprises in data or policy.
This may not seem like an overly groundbreaking assertion, but there is an important distinction between today’s rally and the 2016, 2019, and 2020 recoveries we mentioned earlier. All of those rallies had measurable shifts in policy and liquidity that allowed markets to shake off challenging incoming data. Money supply growth (M2 Money Supply YoY) reaccelerated at the same time that each of these rallies began. This expanding liquidity supported the rebound in valuations and drowned out the fearful sentiment that (lagging) economic data was still weak.
Today we have yet to see any reacceleration in money supply growth that would suggest that increasingly abundant liquidity conditions can overwhelm challenging data. The market may want the Fed to pivot to easing, but Fed policies have not yet resulted in more improving liquidity conditions that would allow us to ignore fundamental considerations.
It is vital to observe in the chart below that the turns in liquidity were coincident with the market recoveries in 2016, 2019, and 2020 and did not lag the recoveries like the data, sentiment, and narrative did at those times. If October 2022 was the start of the next bull run, it would be unique in its lack of support from money supply growth.
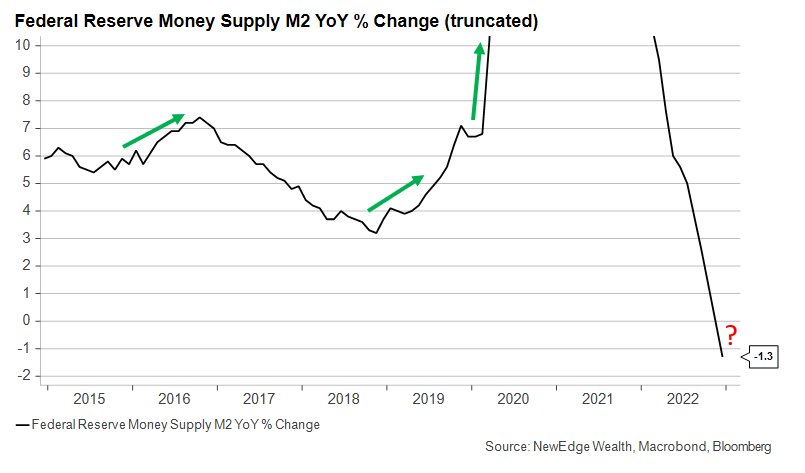
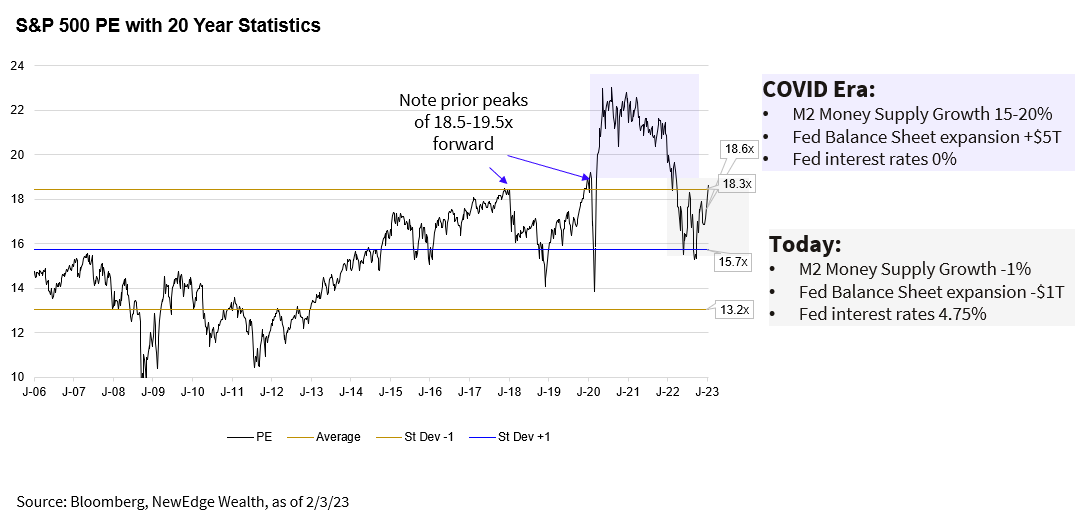
As we think of our vulnerabilities, we see equity valuations priced at near perfection. For many indices, we are now nearing or above the pre-pandemic highs in valuation. We do not think a return to pandemic-era valuations is justified, even if the Fed pauses, as these effervescent valuations were made possible by unprecedented stimulus (0% fed funds rate, -1% 10-year real interest rate, peak 20% money supply growth YoY, $5T balance sheet expansion).
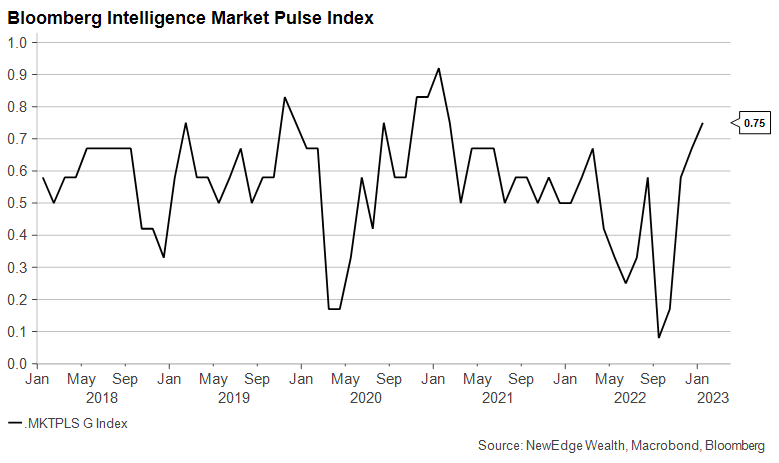
We have also seen a return to exuberance in markets and a normalization in positioning. The Bloomberg Intelligence Market Pulse Index is now back to levels not seen since the irrational exuberance of early 2021 (a market period that legendary short seller Jim Chanos says was the most pronounced period of speculative fervor that he has ever observed in his career). Of course, this positioning and sentiment could have room to run further (positioning could become extremely long vs. just neutral), but the bar for upside surprise to expectations is certainly getting higher as investors become more optimistic.
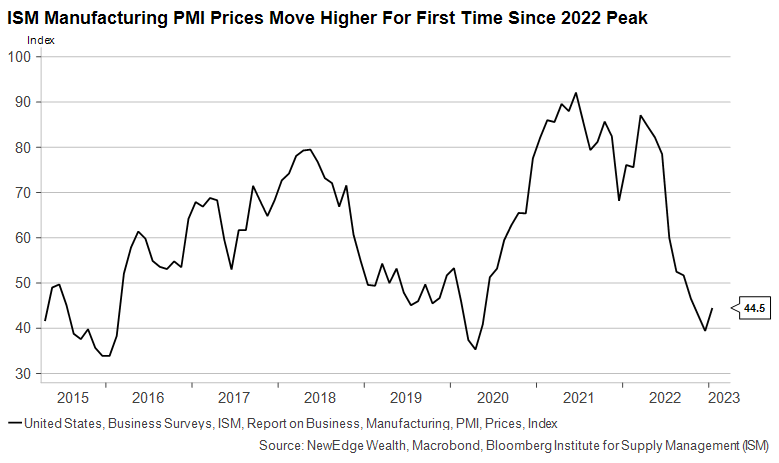
Lastly on vulnerabilities, we must consider that a rapid deceleration in inflation (at no expense to growth) is not just consensus but is likely fully priced into markets. Last week we discussed the risks posed by energy prices for month-over-month inflation data, and this week we may have seen early evidence of this rebound in inflation momentum. For the first time since March of 2022, the Price component of the manufacturing PMI turned higher. We are not calling for a return to 2021-2022 levels of YoY inflation (much of the pandemic-era, truly transitory inflation drivers are behind us), however, we do think it could be too soon for markets or the Fed to call the all-clear on the fight against inflation.
When we balance all of these factors of velocity and vulnerabilities, we see the potential for markets to continue their bullish run in the very near term, but the higher we push, the less attractive the risk reward becomes. Higher prices become even more precarious as we have not seen any coincident shift in liquidity conditions and now have perfectly priced optimism about the path forward for inflation and growth. And so we won’t forget that, “too much love will kill you…”
Top Points of the Week

- Stocks Rip: Global equities rallied for the week, led by U.S. Growth and technology shares, which benefited from a drop in interest rates. Value and Emerging Market shares lagged the most. Major indices, including the S&P 500 and NASDAQ, continued to trade above their important 200-day moving averages, with the S&P 500 breaking above the important 65-day high at 4,100. We have recently seen the most improvement in trend for large cap US equities since the bear market began in early 2022.
- Yields Fall: U.S. Treasury yields fell by 15 basis points on the week, and 50 basis points of rate cuts were priced in by year-end. A stronger-than-expected payrolls report reversed some of the rallies in bonds with the 2Y yield rising back above 4.20 percent and rate cut expectations paring back. The European Central Bank and the Bank of England moderated their tone about inflation and bond markets interpreted that rate hike cycles are globally coming to an end. European and emerging market bond yields declined by 25 basis points on average.
- Central Bank Bonanza: three major central banks announced rate hike decisions that were in line with expectations this week (the U.S. Federal Reserve, the European Central Bank, and the Bank of England). The Federal Reserve announced a 25 bps hike to 4.5-4.75% and pointed to the need for “ongoing” interest rate hikes to control inflation. Risk assets rallied sharply following the Fed’s press conference on Wednesday when Chairman Powell struck a dovish tone, acknowledging recent disinflation (a decline in the pace of inflation) and not pushing back against the recent easing in financial conditions. Markets are currently expecting the Fed to raise rates one more time in 2023 and to begin cutting rates in the second half of the year.
- U.S. Earnings Season: just over 50% of the S&P companies have reported earnings for 4Q22. The number of positive earnings surprises runs at 70.9%, which is below the 5-year average of 77%. According to Bloomberg, sales are beating by 1% and earnings are beating by 1.5%, the weakest beats since 2020. The sector with the biggest positive surprises is consumer discretionary (12.9% above estimates), followed by healthcare and utilities (6%) while technology is flat, and industrials and staples had negative earnings surprises.
- The U.S. Labor Market Remains Extremely Tight: Despite the weather-related weakness in the lower-than-expected ADP jobs report on Tuesday, the non-farm payrolls report on Friday surprised with a significant gain of 517K jobs added (versus 190K expected). Initial Jobless Claims of 183k (vs. 195k consensus) was another multi-year low for this time of the year, and below the very tight labor markets of 2018, 2019, and 2022. The job openings (JOLTS) passed back above 11 million with turnover rates rising but for technology, turnover has notably dropped. The impact of tech layoffs, however, is not coming through meaningfully in jobs data.
- Wage Data Slowing: The Employment Cost Index moderated to 1% (1.5% expected), with all of the downside in the number driven by lower bonus payments (60 bps drag). Quarterly growth in compensation for civilian workers edged down to 1.0% in the fourth quarter from 1.2% in the third, lower than the market consensus (1.1%). Annualized, compensation growth decelerated to 4% from the above 5% pace in the preceding three quarters. Markets are watching wage data closely, as the Fed has expressed discontent with elevated wages as it works to dampen inflation.
- Manufacturing Slowing Further: The Institute of Supply Management (ISM) January Manufacturing Purchasing Managers Index (PMI) showed further contraction in manufacturing data (47.4 vs. 48.4 prior, readings below 50 signal contraction). The price component ticked higher for the first time since March 2022, possibly due to higher energy costs and a weaker USD causing import prices to rise. Interestingly, the employment component remained resilient at 50.4, with ISM pointing to employers not wanting to lay workers off because they expect a stronger second half of the year.
- Debt Ceiling Fight: the first meeting between President Biden and Speaker McCarthy was productive in working towards avoiding a debt default. The Democrats, however, intensified a fundraising email campaign to make voters aware of the Republicans’ budget cut plans, including social security and Medicaid. Republicans are internally divided about how to address the debt ceiling to their base. The Treasury projects that special measures run out sometime by June and financial markets estimate that by end of July through mid-August the Treasury could run out of money and skip paying interest on Treasury bills.
- Coming Up Next Week: Powell is interviewed on Tuesday at the Economic Club of Washington. Powell may address the discussion in the press conference about financial conditions, disinflation, and when the Fed may end the rate hike cycle. Other Fed speakers are San Francisco Fed Daly and New York Fed Williams who speak to financial media about Fed policy outlook. The WSJ live interview with Williams should be watched for the centrist view within the Fed about disinflation. A few economic data points on the radar are consumer credit, jobless claims, Michigan confidence (65 consensus estimate), and inflation expectations. Next week’s earnings highlights are Lyft, Robinhood, Disney, Hilton, and PayPal.
IMPORTANT DISCLOSURES
Abbreviations: 10 2 spread: 10-2 Year Treasury Yield Spread; EPS: Earnings per Share; Fedspeak: refers to speeches about monetary policy given by members of the U.S. Federal Reserve Board of Governors. PCE: personal consumption expenditures; ARKK Innovation is an ETF that focuses on disruption innovation (the introduction of a technologically enable new product or service that potentially changes the way the world works); IPO Index is a stock market index based upon a portfolio of newly public companies listed on non-U.S. exchanges; JOLTS is the Job Openings and Labor Turnover Survey; M2 is the Federal Reserve’s estimate of the total money supply including all of the cash people have on hand plus all of the money deposited in checking accounts, savings accounts, and other short-term saving vehicles; Michigan confidence is the University of Michigan Consumer Sentiment Index.
Index Information: All returns represent total return for stated period. S&P 500 is a total return index that reflects both changes in the prices of stocks in the S&P 500 Index as well as the reinvestment of the dividend income from its underlying stocks. Dow Jones Industrial Average (DJ Industrial Average) is a price-weighted average of 30 actively traded blue-chip stocks trading New York Stock Exchange and Nasdaq. The NASDAQ Composite Index measures all NASDAQ domestic and international based common type stocks listed on the Nasdaq Stock Market. Russell 2000 is an index that measures the performance of the small-cap segment of the U.S. equity universe. MSCI International Developed measures equity market performance of large, developed markets not including the U.S. MSCI Emerging Markets (MSCI Emerging Mkts) measures equity market performance of emerging markets. Russell 1000 Growth Index measures the performance of the large- cap growth segment of the US equity universe. It includes those Russell 1000 companies with relatively higher price-to-book ratios, higher I/B/E/S forecast medium term (2 year) growth and higher sales per share historical growth (5 years). The Russell 1000 Value Index measures the performance of the large cap value segment of the US equity universe. It includes those Russell 1000 companies with relatively lower price-to-book ratios, lower I/B/E/S forecast medium term (2 year) growth and lower sales per share historical growth (5 years). The “BBB IG Spread” is the Bloomberg Baa Corporate Index that measures the spread of BBB/Baa U.S. corporate bond yields over Treasuries. The HY OAS is the High Yield Option Adjusted Spread index measuring the spread of high yield bonds over Treasuries. The Empire Fed Manufacturing Survey is a monthly survey of manufacturers in New York State conducted by the Federal Reserve Bank of New York with readings above 50 signaling expansion and below 50 contraction. The Bloomberg Intelligence Market Pulse Index quantifies sentiment using 6 factors — price breadth, pairwise correlation, low vol performance, defensive vs. cyclical sector performance, high vs. low leverage performance and high yield spreads. The ADP jobs report is the ADP National Employment Report and it measures levels of non-farm private employment. The Employment Cost Index (ECI) measures the change in the cost of labor, free from the influence of employment shifts among occupations and industries.
The views and opinions included in these materials belong to their author and do not necessarily reflect the views and opinions of NewEdge Capital Group, LLC.
This information is general in nature and has been prepared solely for informational and educational purposes and does not constitute an offer or a recommendation to buy or sell any particular security or to adopt any specific investment strategy.
NewEdge and its affiliates do not render advice on legal, tax and/or tax accounting matters. You should consult your personal tax and/or legal advisor to learn about any potential tax or other implications that may result from acting on a particular recommendation.
The trademarks and service marks contained herein are the property of their respective owners. Unless otherwise specifically indicated, all information with respect to any third party not affiliated with NewEdge has been provided by, and is the sole responsibility of, such third party and has not been independently verified by NewEdge, its affiliates or any other independent third party. No representation is given with respect to its accuracy or completeness, and such information and opinions may change without notice.
Investing involves risk, including possible loss of principal. Past performance is no guarantee of future results.
Any forward-looking statements or forecasts are based on assumptions and actual results are expected to vary from any such statements or forecasts. No assurance can be given that investment objectives or target returns will be achieved. Future returns may be higher or lower than the estimates presented herein.
An investment cannot be made directly in an index. Indices are unmanaged and have no fees or expenses. You can obtain information about many indices online at a variety of sources including: https://www.sec.gov/answers/indices.htm.
All data is subject to change without notice.
© 2026 NewEdge Capital Group, LLC

