


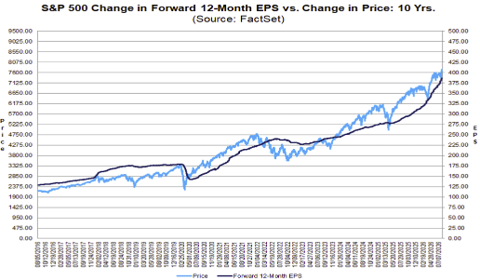
This week we are providing our assessment and analysis of the second quarter U.S. equity earnings season, a quarter that, once again, illustrated remarkable corporate profit growth, which continues to serve as a key pillar of support for many equity market segments. As we have discussed over the past several years, accelerating corporate profits and continuously rising earnings expectations for future years have been one of the main drivers of U.S. equity market performance, contributing to overall resiliency amidst a more turbulent macro backdrop and providing validation to investors who have stayed the course despite elevated volatility and some significant market dislocations.
This surging earnings growth, while supportive in the near term, ultimately raises questions about long-term durability and eventual normalization (as it creates a higher bar and tougher year-over-year comparisons going forward). In our view, this makes Creed’s 1999 uplifting anthem “Higher” a fitting analogy for this week’s Weekly Edge, a song that alludes to golden streets and asks the question on the mind of many equity market participants: “Can you take me higher?” into year-end.
Source: FactSet, Data as of 8/7/26
“A Place with Golden Streets” – Q2 Earnings Season Recap
With over 90% of the S&P500 having reported thus far, the index is on pace for one of its best earnings seasons this century, as overall revenue growth is tracking at +15% YoY and adjusted EPS growth is tracking at +31% YoY (this adjusted measure excludes recent one-time gains on private investments for several large technology companies, gains which, when included, inflate GAAP EPS growth to over 50% YoY and need to be taken with a grain of salt as our CIO Cameron Dawson pointed out a few weeks ago).
This level of adjusted earnings growth, roughly 3x the long-term average for the S&P500, is typically only seen in post recessionary environments, which often coincide with easing policy and a recovery in economic activity, making these results even more impressive in the context of the second-quarter macro environment where rising interest rates and elevated geopolitical uncertainty were prevailing headwinds to consumption and profitability.
While index-level results were influenced by some of the largest constituents, trends under the surface confirm a healthy quarter of profitability as well. The median S&P500 company is on pace to deliver 14% YoY EPS growth and 6% YoY revenue growth, both accelerating from last quarter and near the highest levels this decade.
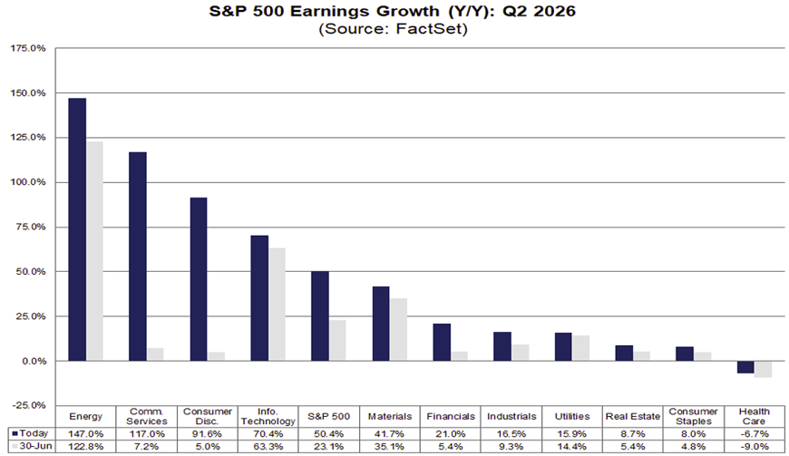
At the same time, earnings surprises remain above average as well; nearly 90% of companies have beaten bottom-line estimates by an average of 29% (a record quarterly EPS surprise), and 75% of companies have beaten top-line estimates by an average of 3% (nearly double the average revenue beat rate over the past 10 years). Lastly, at the sector level, we see healthy contribution as well, with 10 of 11 sectors on pace to post positive YoY EPS growth, and 8 of 11 are on pace to deliver double-digit YoY EPS growth, led by the Energy, Communications, and Consumer Discretionary sectors.
Source: FactSet, Data as of 8/7/26
It is important to point out, however, that surging growth in some of the largest companies and segments is skewing index- and sector-level results this quarter. Excluding Amazon, for example, would reduce the Consumer Discretionary EPS growth rate from 92% to just 7% YoY. Excluding Amazon and Alphabet from the S&P500 index (two companies that have seen the largest EPS boost from markups on private investments) would reduce the overall earnings surprise rate from 29% to just 10%, a sizable haircut but still a healthy beat rate relative to history. Lastly, when excluding major market segments like semiconductors and the Magnificent Seven, we see underlying earnings growth for the rest of the market of 15% YoY, again healthy profit growth but a far cry from the 30% adjusted EPS growth reported for the broad S&P 500 Index. Overall, this confirms our view that corporate profitability and earnings momentum remain strong, but it is not as robust (or durable given the cyclical nature of some of the largest contributors) as headline measures suggest.
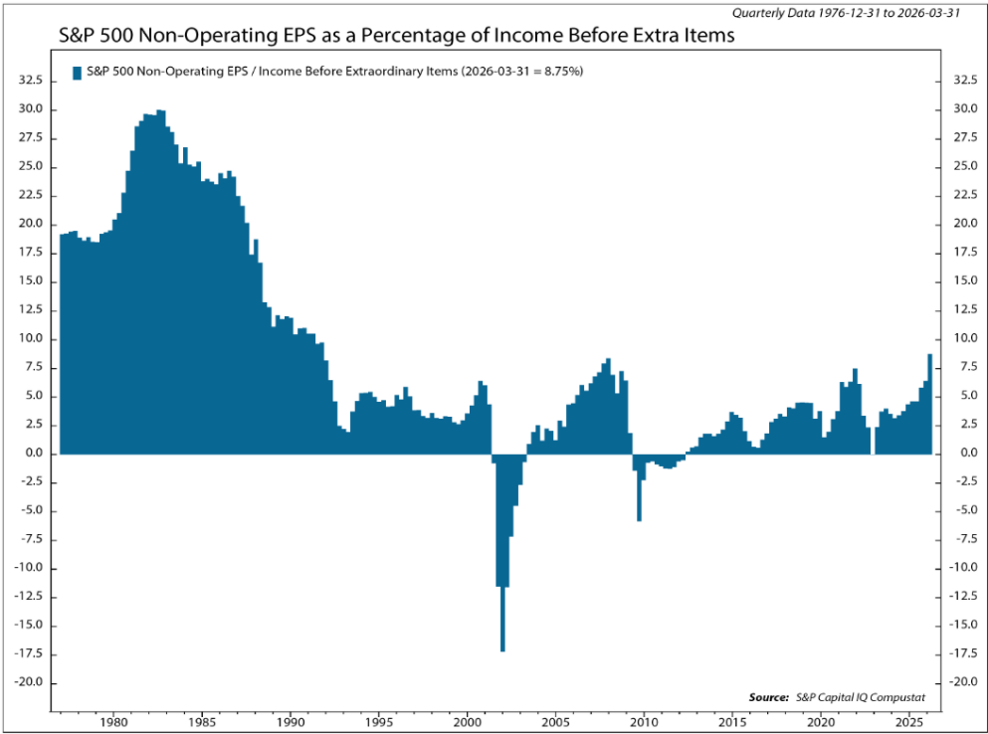
While recent revaluations on private investments for some of the largest tech companies have meaningfully boosted GAAP EPS, at this point the ratio of this non-operating income relative to core operating income is elevated but far from extreme levels (averaging around 9% at the end of Q1 and likely headed into the low double digits for Q2). In the 1980s, for example, non-operating income accounted for over 25% of corporate EPS (thanks to the healthy yields generated on cash at the time), and historically this non-operating income has risen alongside a pickup in IPO activity and private capital fundraising. This is a metric that bears watching, as it has historically risen in later-cycle environments, and while it does not suggest an imminent end to the earnings cycle, non-operating income growth as a percentage of total income can lead to more volatile earnings in future quarters.
S&P500 Non-Operating EPS to Core Operating Income
Source: S&P Capital IQ, Data as of 3/31/26
“Up High, I Feel Like I’m Alive” – Expanding Corporate Profit Margins
Another positive data point this season has been overall profit margins, which surged once again in Q2 due to a combination of accelerating top-line growth, embedded operating leverage, and disciplined expense management at many companies. Overall net profit margins for the S&P500 are on pace to reach 16.9% this quarter, expanding by over 400bps over the past year to the highest level since 2009. While the majority of margin expansion has been concentrated among the largest companies in the technology, communications, and discretionary sectors (boosted by the one-time benefits of unrealized gains on private investments as well as surging semiconductor profitability), in aggregate, 8 of 11 sectors are seeing margin expansion and approximately 60% of companies within the S&P 500 have generated some level of margin expansion over the past year. These measures indicate that expanding profit margins are becoming more broad-based across the large-cap equity universe, a bullish signal as historically rising profitability has been supportive of a higher valuation multiple on the broader index.
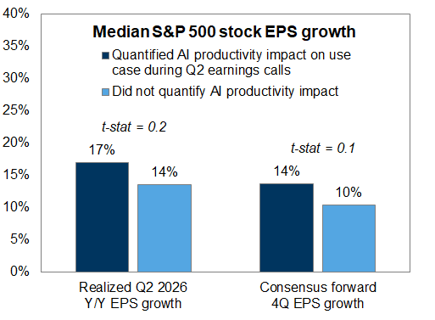
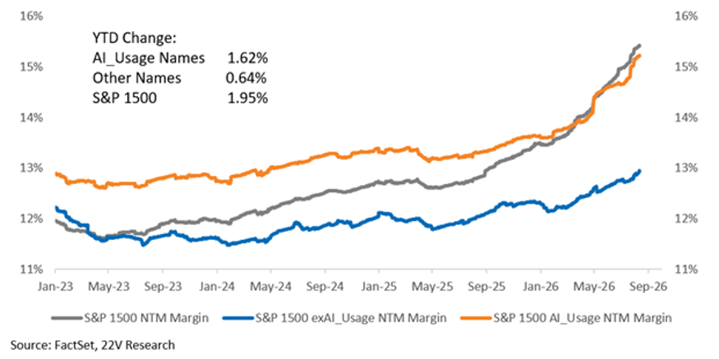
In recent years, we have suggested that disciplined expense management would be a vital tool in allowing companies to deliver and exceed earnings growth expectations in a late-cycle economic environment. While corporate belt-tightening has certainly been a contributor to this season’s remarkable earnings growth, we are seeing signs that AI integration is having a positive effect on corporate profitability as well. When bifurcating the large-cap U.S. equity universe into companies that have specified AI use cases in their businesses and those that have not, we can see that those using AI have garnered a greater share of earnings growth, positive revisions, and margin expansion.
Change in YoY EPS Growth (median S&P500 Company)
Source: FactSet, Goldman Sachs, Data as of 8/16/26
Change in NTM Profit Margins (S&P1500 AI Usage and ex AI Usage Baskets)
Source: FactSet, 22V Research. Data as of 8/16/26
While this data can certainly be skewed by the composition of companies and industry groups (as Real Estate, for example, has low expectations for earnings growth and margin expansion but likely has little use of AI today), it could suggest greater AI adoption in the future from companies looking to generate incremental margin expansion.
“Cause There’s a Hunger” – The Impact of AI Capex
The most substantial driver of S&P500 EPS growth over the past several years has been the remarkable growth in AI-related capex spending, investment that continues to exceed expectations in both magnitude and duration. Estimates from Empirical Research and JP Morgan as of April 2026 suggest AI capex has accounted for nearly 70% of the S&P500 earnings growth over the past three years, making the trend in capex growth and hyperscaler capex commentaries an essential watch item each quarter.
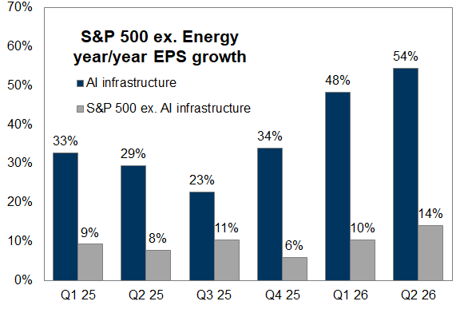
Once again in Q2, we saw hyperscaler capex estimates surpass expectations, topping already lofty estimates by an average of 13%, while forward guidance generally indicated AI-related capex will continue to increase in the coming quarters. The beneficiaries of this capex continue to garner the majority of EPS growth within the S&P500, and this quarter the spread in YoY EPS growth for the AI infrastructure segment relative to the non-AI infrastructure segment within the S&P500 hit a record 40%.
Relative EPS Growth Rates (S&P500 AI vs. Non AI Infrastructure)
Source: FactSet, Goldman Sachs, Data as of 8/16/26
While elevated AI capex continues to erode free cash flow for the hyperscalers (which could lead to continued debt and equity issuance for the group in the future), it does help fuel rising EPS growth expectations for many key industry groups like semiconductors, capital goods, and hardware, and given their outsized weights today, this continues to have a positive impact on broad S&P500 index EPS estimates as well. Eventually, this spending will normalize, and it is possible 2026 will be the year when AI capex growth peaks (as we are on track for over $700B in hyperscaler capex this year, an increase of more than 90% relative to last year). As this spending growth normalizes (consensus expects 30% growth in 2027), we should anticipate some moderation in the earnings revision momentum for the S&P500 as well. In this scenario, fundamentals and durable growth are likely to take on a greater role in markets, and we may also see wider dispersion as companies that can continue to deliver on expectations are rewarded.
Closing Thoughts
The second quarter earnings season has certainly been impressive, evidenced by the magnitude of and breadth of earnings growth, above-average beat rates, and healthy margin expansion within the index. While some of these metrics are inflated by one-time gains and non-operating activity, even excluding these items, we see a generally healthy environment for corporate profitability today, fueled by rising nominal GDP growth and continued operational efficiency at many companies.
At the same time, we recognize that the current outsized EPS growth rates for the S&P500 will be difficult to replicate going forward, and the index is likely “over-earning” today relative to historical levels. This above-trend growth has been the result of a confluence of factors, some durable (like supply chain optimization and operational efficiency), and some less durable (like private market gains, tariff refunds, and tax benefits). All in all, this growth provides a healthy fundamental signal for long-term investors, yet its composition suggests the environment may not be as “sunny” as reported results indicate. In our view, this warrants a continued emphasis on higher-quality companies, those with durable top and bottom-line growth, premium profitability, and great capital efficiency, fundamental metrics that have historically supported more consistent profit generation and may become more appreciated as the earnings cycle ages.
IMPORTANT DISCLOSURES
The views and opinions included in these materials belong to their author and do not necessarily reflect the views and opinions of NewEdge Capital Group, LLC.
This information is general in nature and has been prepared solely for informational and educational purposes and does not constitute an offer or a recommendation to buy or sell any particular security or to adopt any specific investment strategy.
NewEdge and its affiliates do not render advice on legal, tax and/or tax accounting matters. You should consult your personal tax and/or legal advisor to learn about any potential tax or other implications that may result from acting on a particular recommendation.
The trademarks and service marks contained herein are the property of their respective owners. Unless otherwise specifically indicated, all information with respect to any third party not affiliated with NewEdge has been provided by, and is the sole responsibility of, such third party and has not been independently verified by NewEdge, its affiliates or any other independent third party. No representation is given with respect to its accuracy or completeness, and such information and opinions may change without notice.
Investing involves risk, including possible loss of principal. Past performance is no guarantee of future results.
Any forward-looking statements or forecasts are based on assumptions and actual results are expected to vary from any such statements or forecasts. No assurance can be given that investment objectives or target returns will be achieved. Future returns may be higher or lower than the estimates presented herein.
An investment cannot be made directly in an index. Indices are unmanaged and have no fees or expenses. You can obtain information about many indices online at a variety of sources including: https://www.sec.gov/answers/indices.htm.
All data is subject to change without notice.
© 2026 NewEdge Capital Group, LLC

